


Pattern Spotted is our Wednesday format that showcases real-world applications of Monday’s Pattern Decoded. This week: Long Upper Shadow. [...]
Read More →Pattern Spotted: Long Upper Shadow


Pattern Spotted is our Wednesday format that showcases real-world applications of Monday’s Pattern Decoded. This week: Long Upper Shadow. [...]
Read More →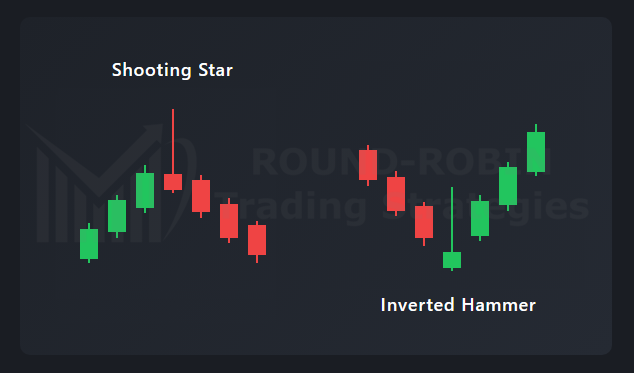
Pattern Decoded is our Monday format where we cover the most well-known patterns in technical analysis. This week we talk about Japanese candlesticks and the Long Upper Shadow. [...]
Read More →This week, Silver deserves our attention and that of half the planet.
To talk about Silver, I believe the right approach is to step back from the chart to admire it from a distance, a long distance.
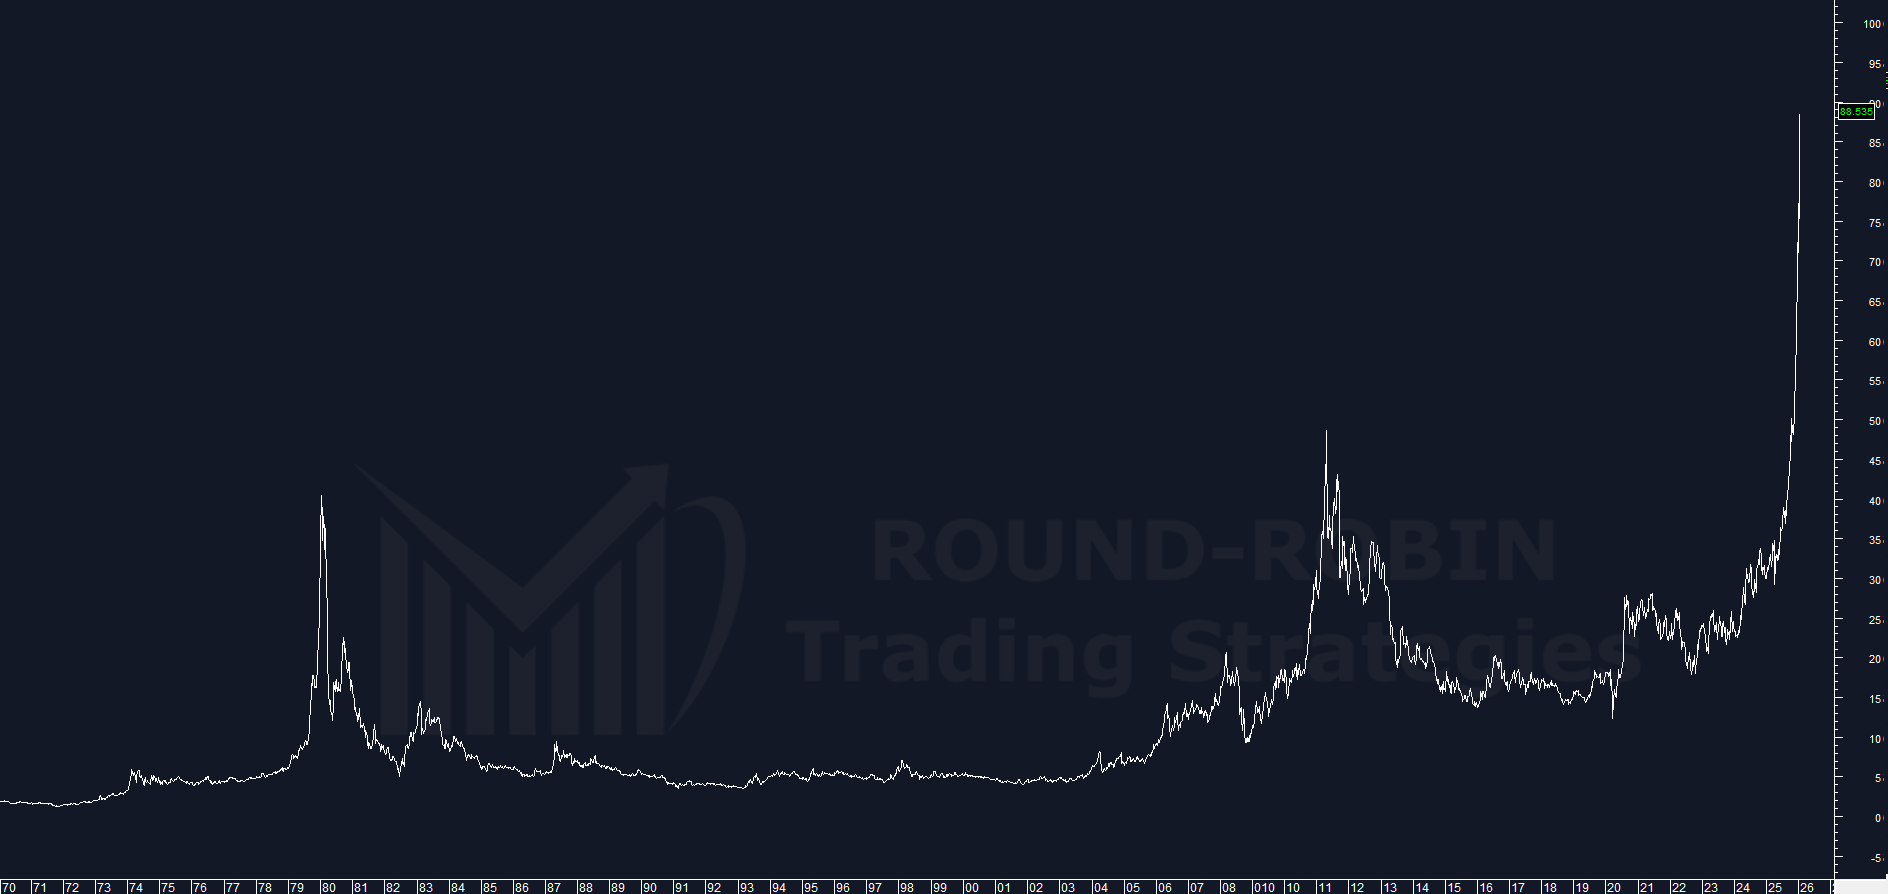
chart: Silver eod chart 1970-2026
This is the chart of weekly closes from 1970 to today… too far back?
Perhaps, but let me explain why. [...]
Read More →
Weekly tracking of Italy’s benchmark index. Why we do this? Check our strategy page.
My proprietary DBBT indicator identifies misalignments between current price and expected technical level across major indices. Each week, we put the FTSE MIB in our crosshairs.
The hunt is open. [...]
Read More →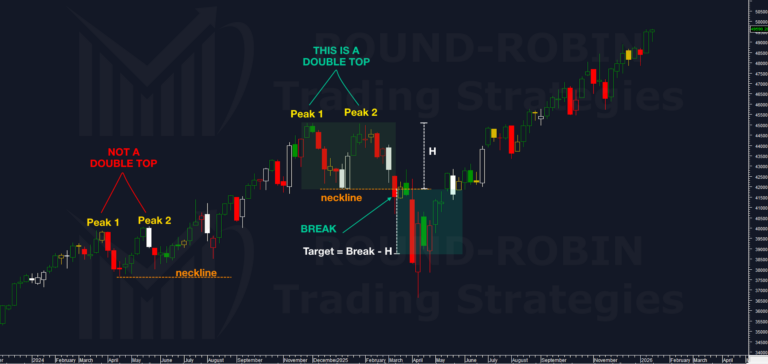
We’re using the Dow Jones Industrial weekly chart, which offers two perfect cases: a wannabe double top and a real double top. [...]
Read More →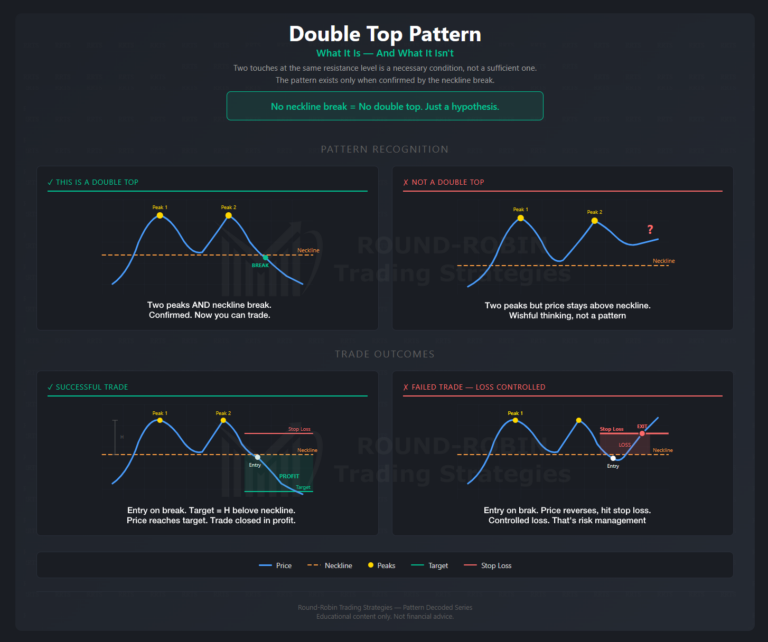
Pattern Decoded is our Monday format where we cover the most well-known patterns in technical analysis. This week we talk about the Double Top. [...]
Read More →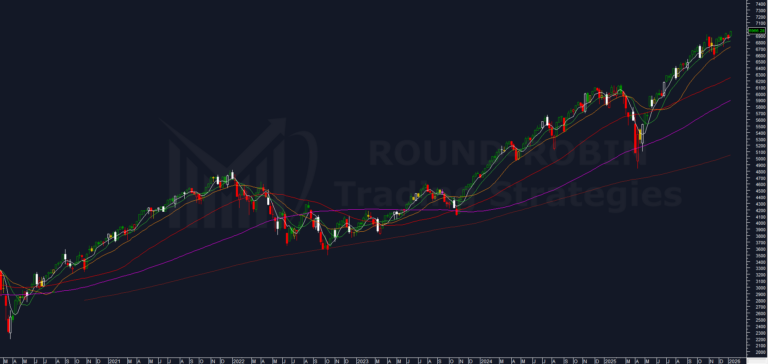
Weekly appointment with the world’s most watched chart.
The S&P 500 just set another all-time high. Another centimeter à la Duplantis — the bare minimum to make the history books. The permabull vs. permabear battle rages on: the bulls have been celebrating for five years (the selloffs didn’t even last long enough to worry about), while the bears keep repeating “yes, new high, but we’re still right there.”
Let’s establish the facts. [...]
Read More →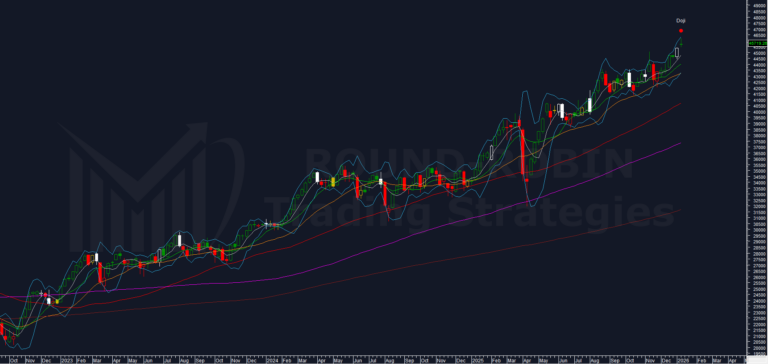
Weekly tracking of Italy’s benchmark index. Why we do this? Check our strategy page.
My proprietary DBBT indicator identifies misalignments between current price and expected technical level across major indices. Each week, we put the FTSE MIB in our crosshairs.
The hunt is open. [...]
Read More →The Transatlantic Rate Divergence
This is the table worth watching.
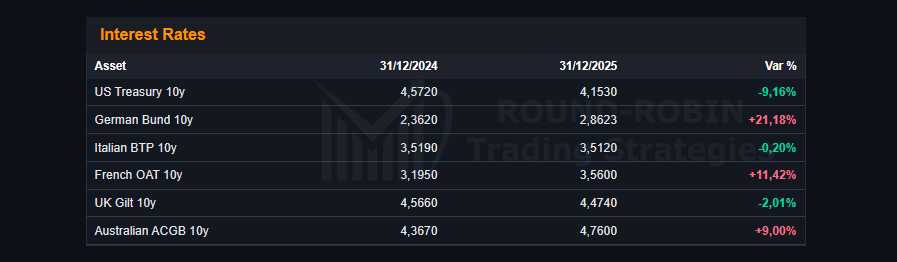
table: Interest Rates 2025
US 10-year Treasury down 42bps. German Bund up 50bps. French OAT up 36bps. Italian BTP flat.
Two central banks, two different paths. The Fed is cutting. The ECB is stuck — inflation stickier, fiscal concerns in France, Germany struggling but yields rising anyway. [...]
Read More →
US indices delivered solid returns — S&P 500 +16%, Nasdaq +20% — but the real surprise came from Europe. DAX +23%, FTSE MIB +31%, IBEX +49%. Performances you don’t often see from this side of the Atlantic.
Asia was mixed. Nikkei +26% and KOSPI +75%, driven by semiconductors and AI momentum. China underperformed with Shanghai Composite +18% — decent, but lagging the global rally. [...]
Read More →