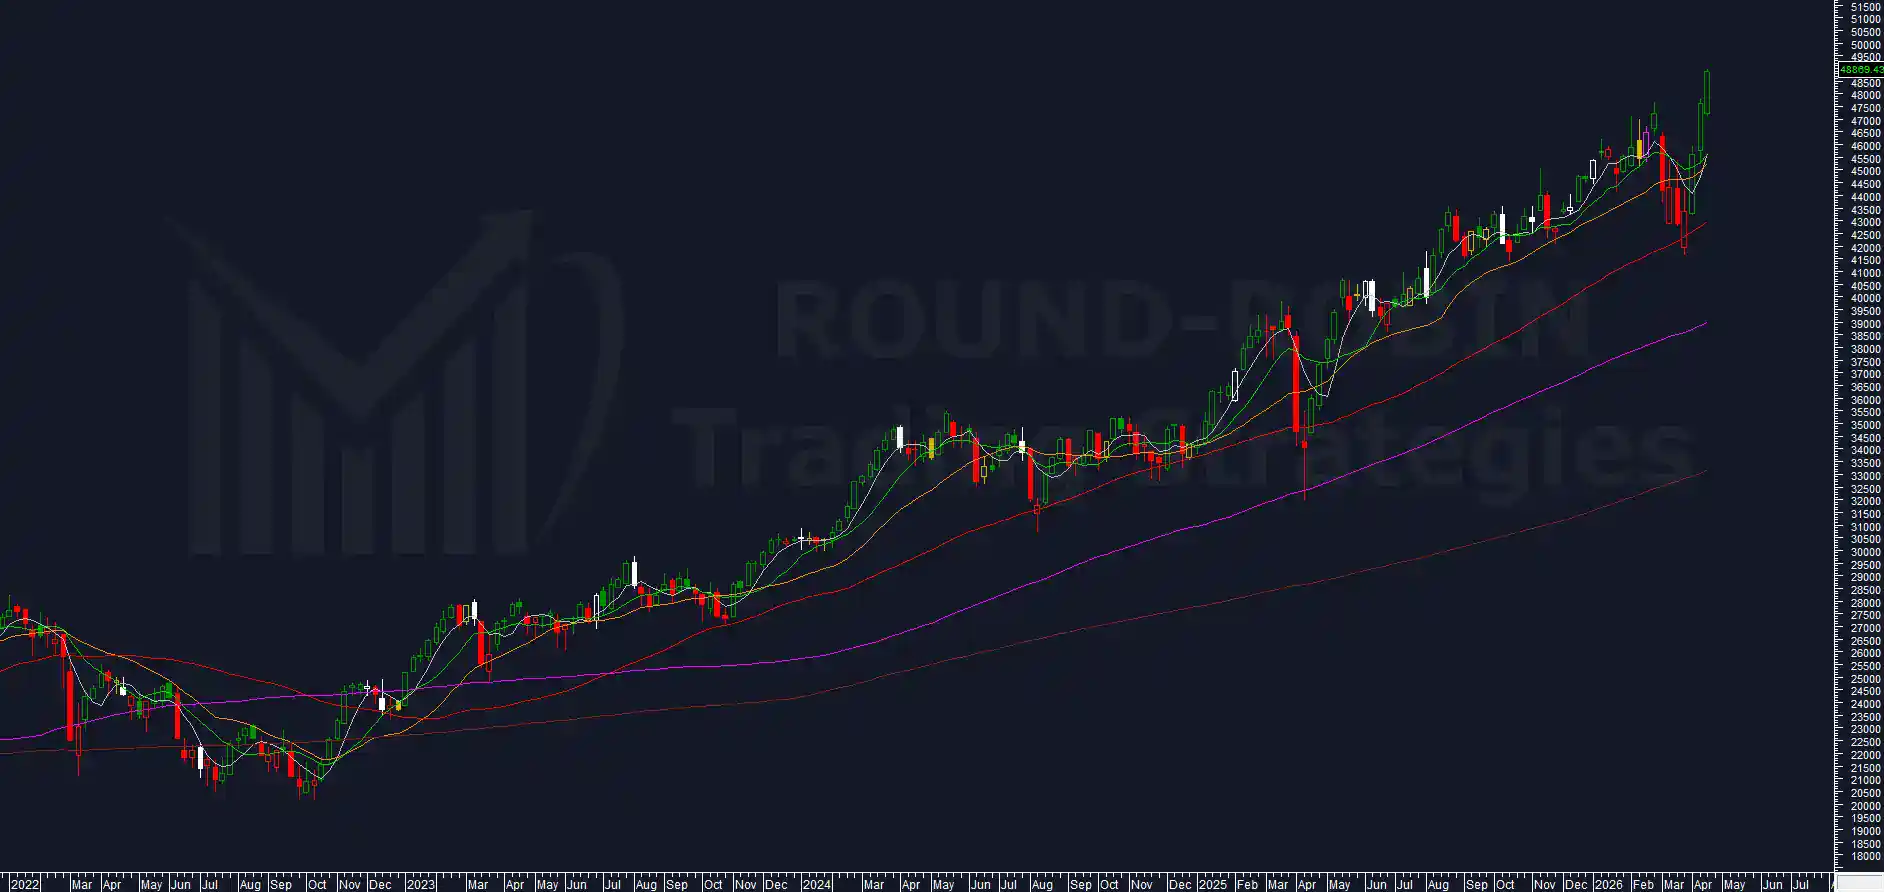
Weekly monitoring of the Italian benchmark index.
Why do we do it?
Check our strategy page.
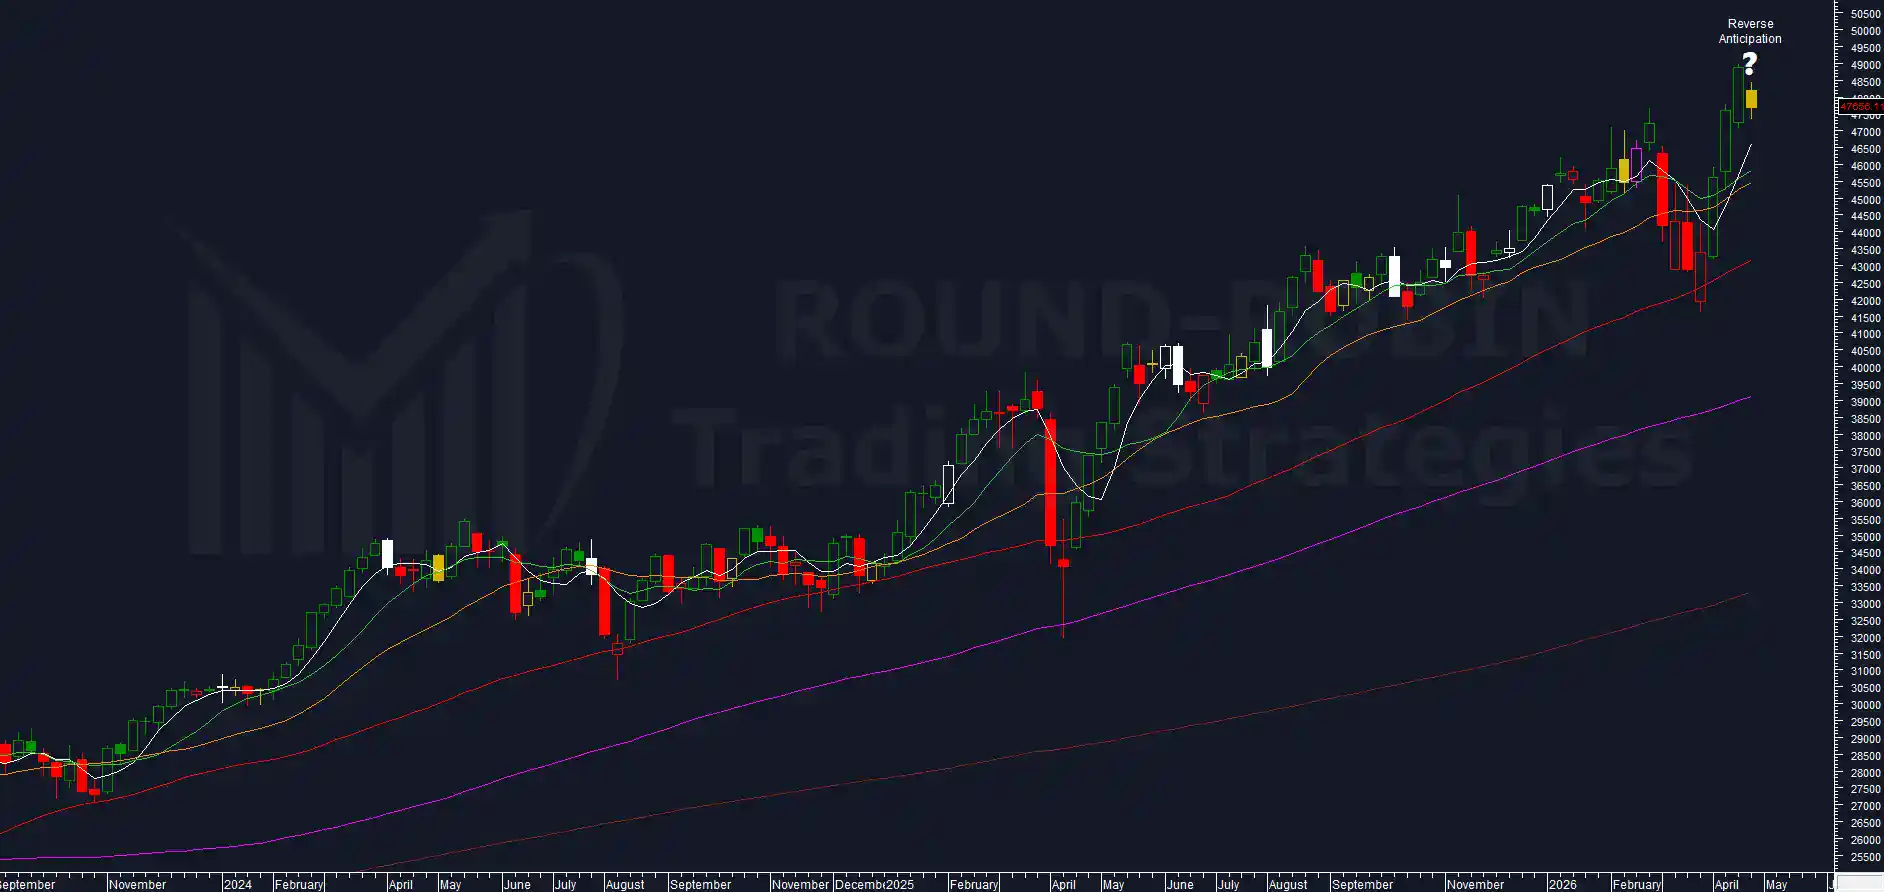
My proprietary DBBT indicator identifies misalignments between the current price and the expected technical level on the main indices.
Every week, the FTSE MIB is in our crosshairs.
The hunt is on.
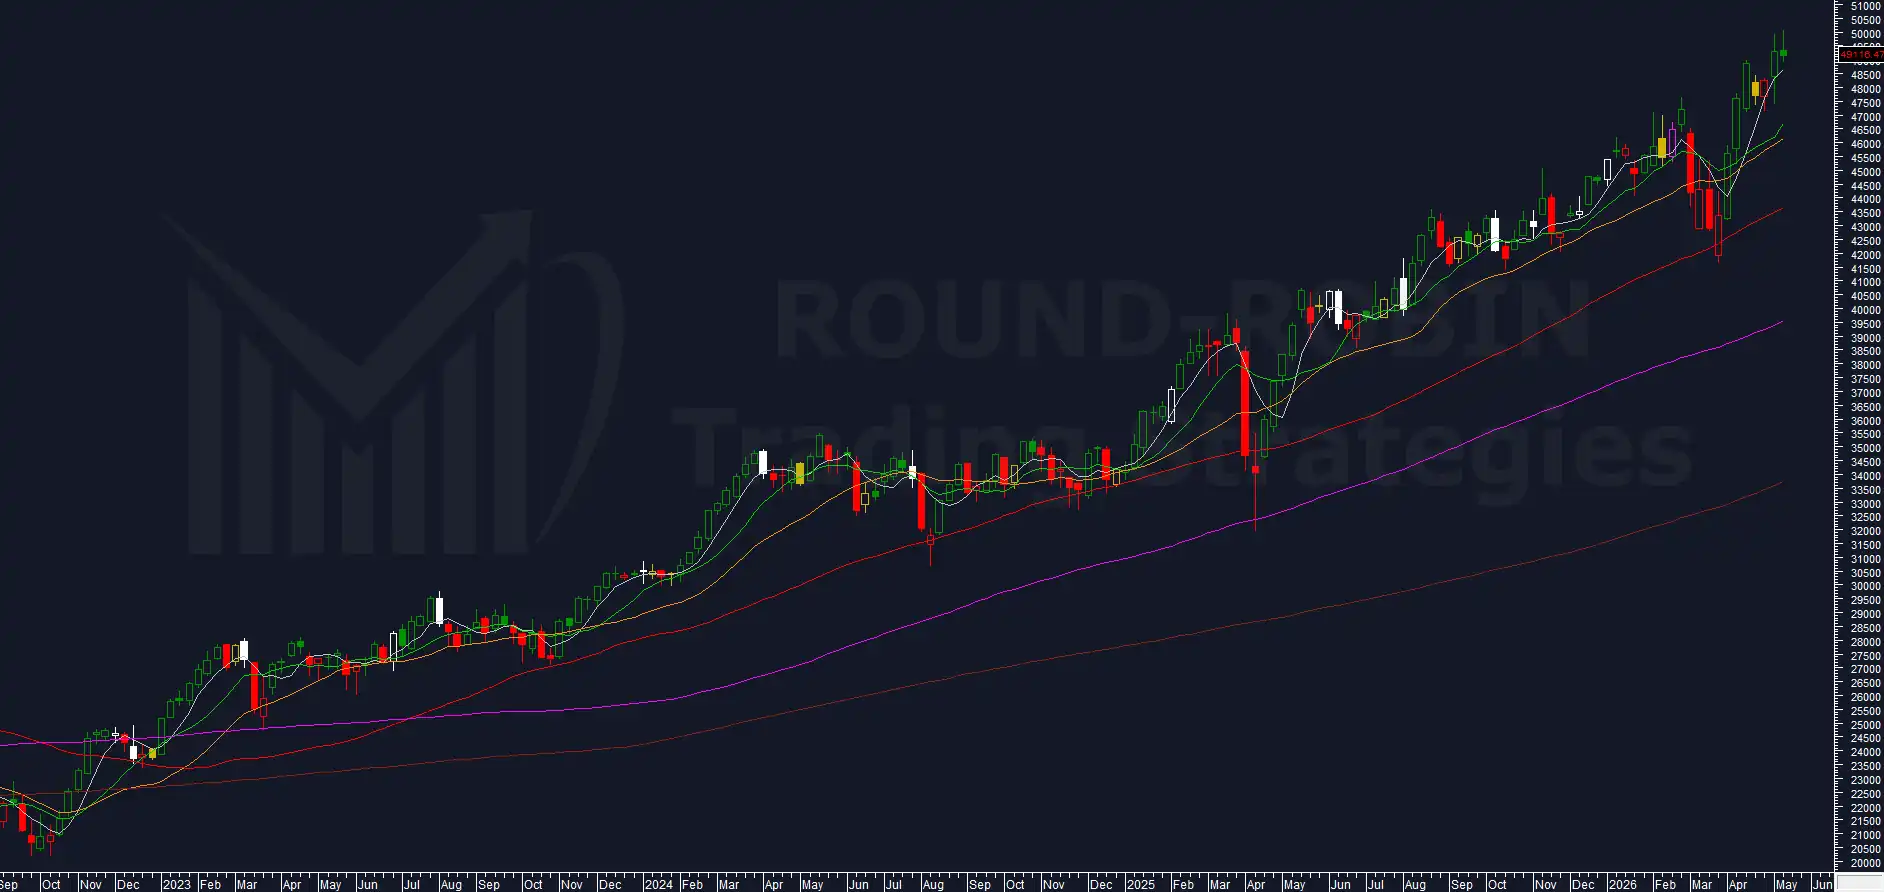
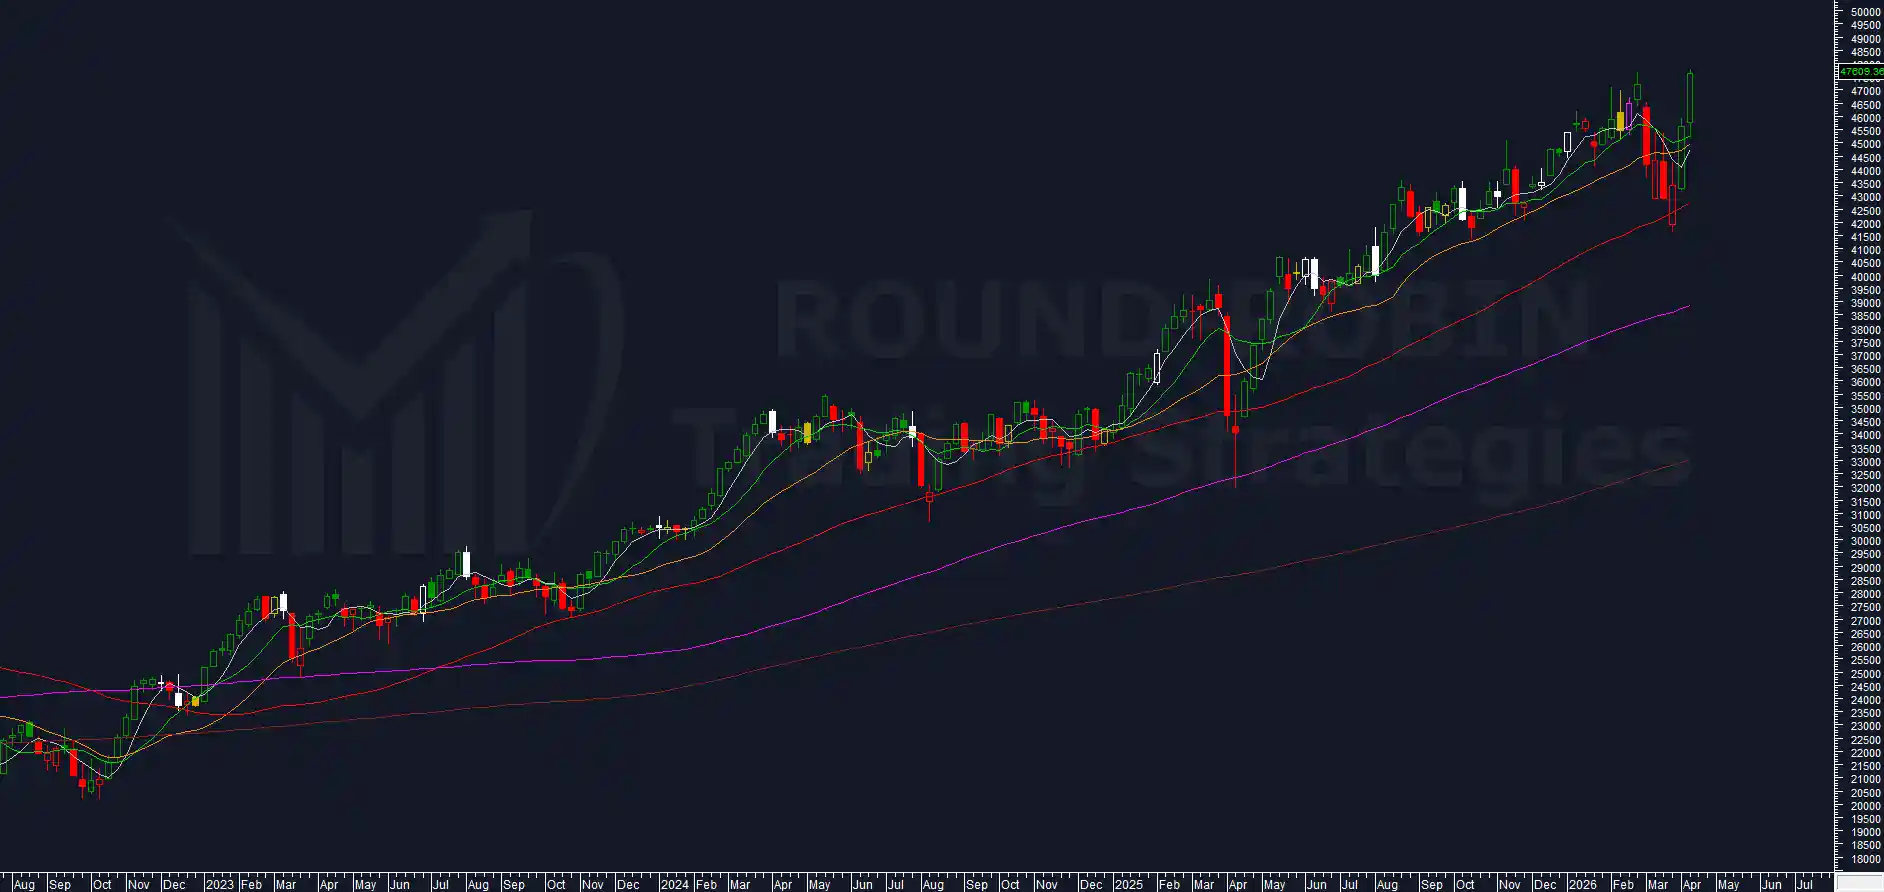
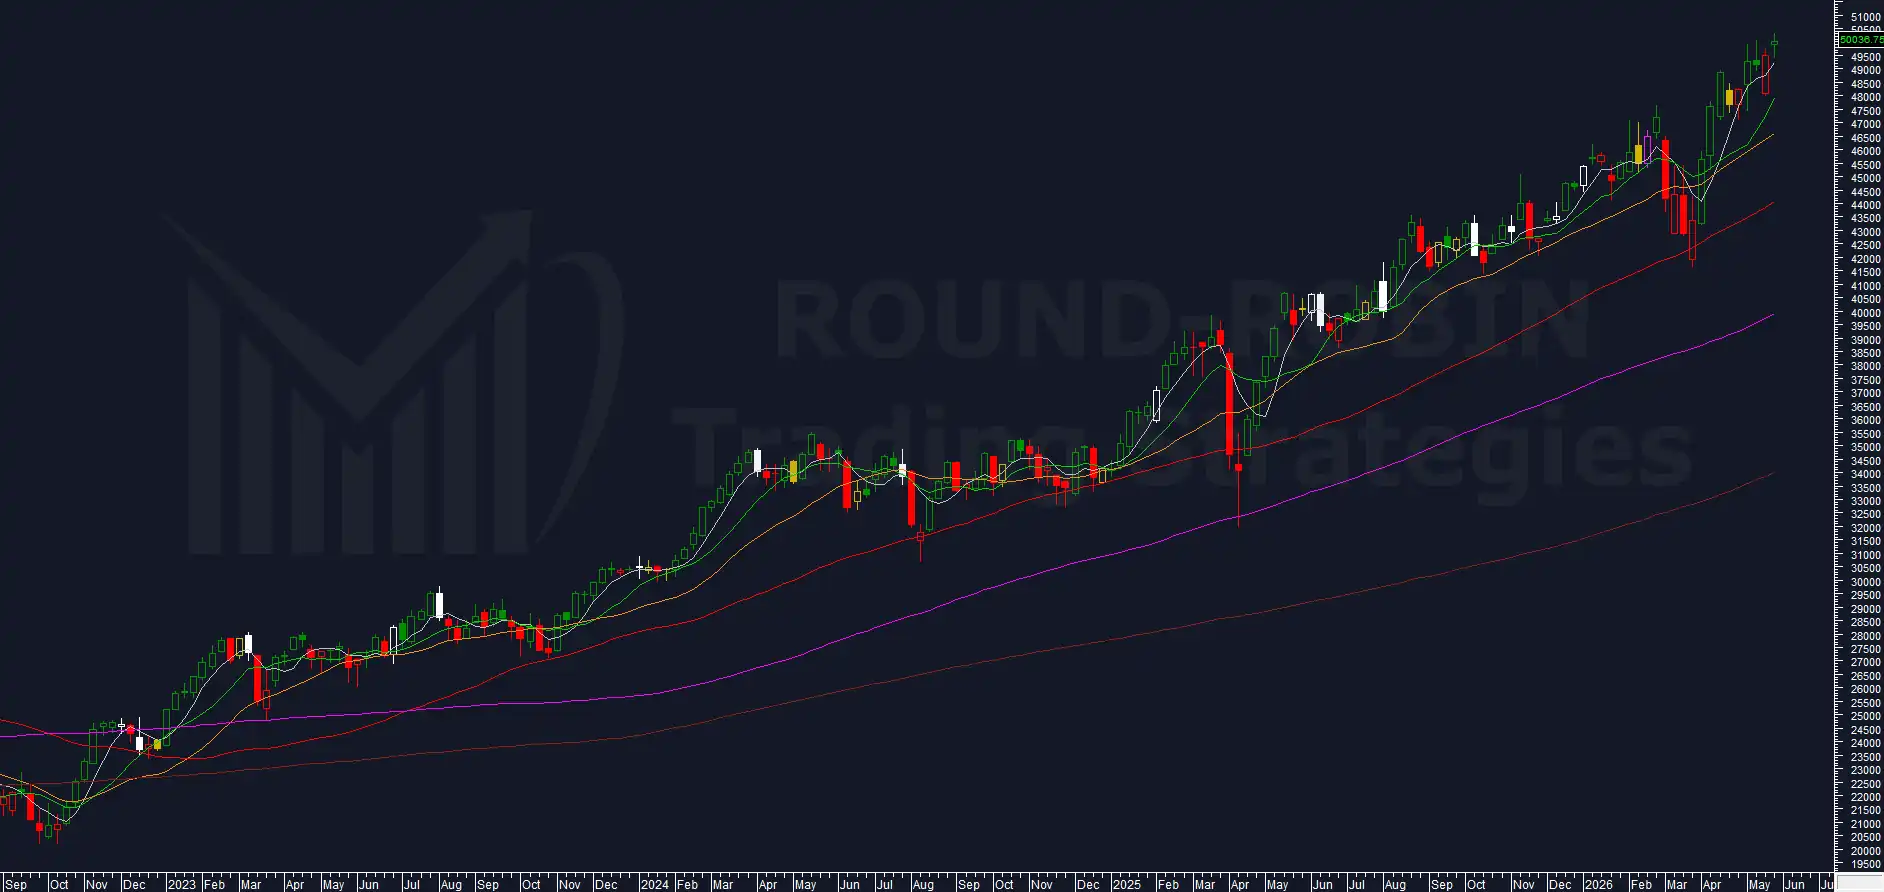
A positive week for the FTSE MIB, with a close at 50,036.75, 525.78 points (+1.06%) above the previous close.
The rise is a matter of fact. It occurred, however, within a compressed range: the weekly excursion of 927 points stands among the narrowest of 2026.
Dividends still weigh on the cash. The future, free from this effect, closes at 49,995, less than 100 points above the previous week’s close.
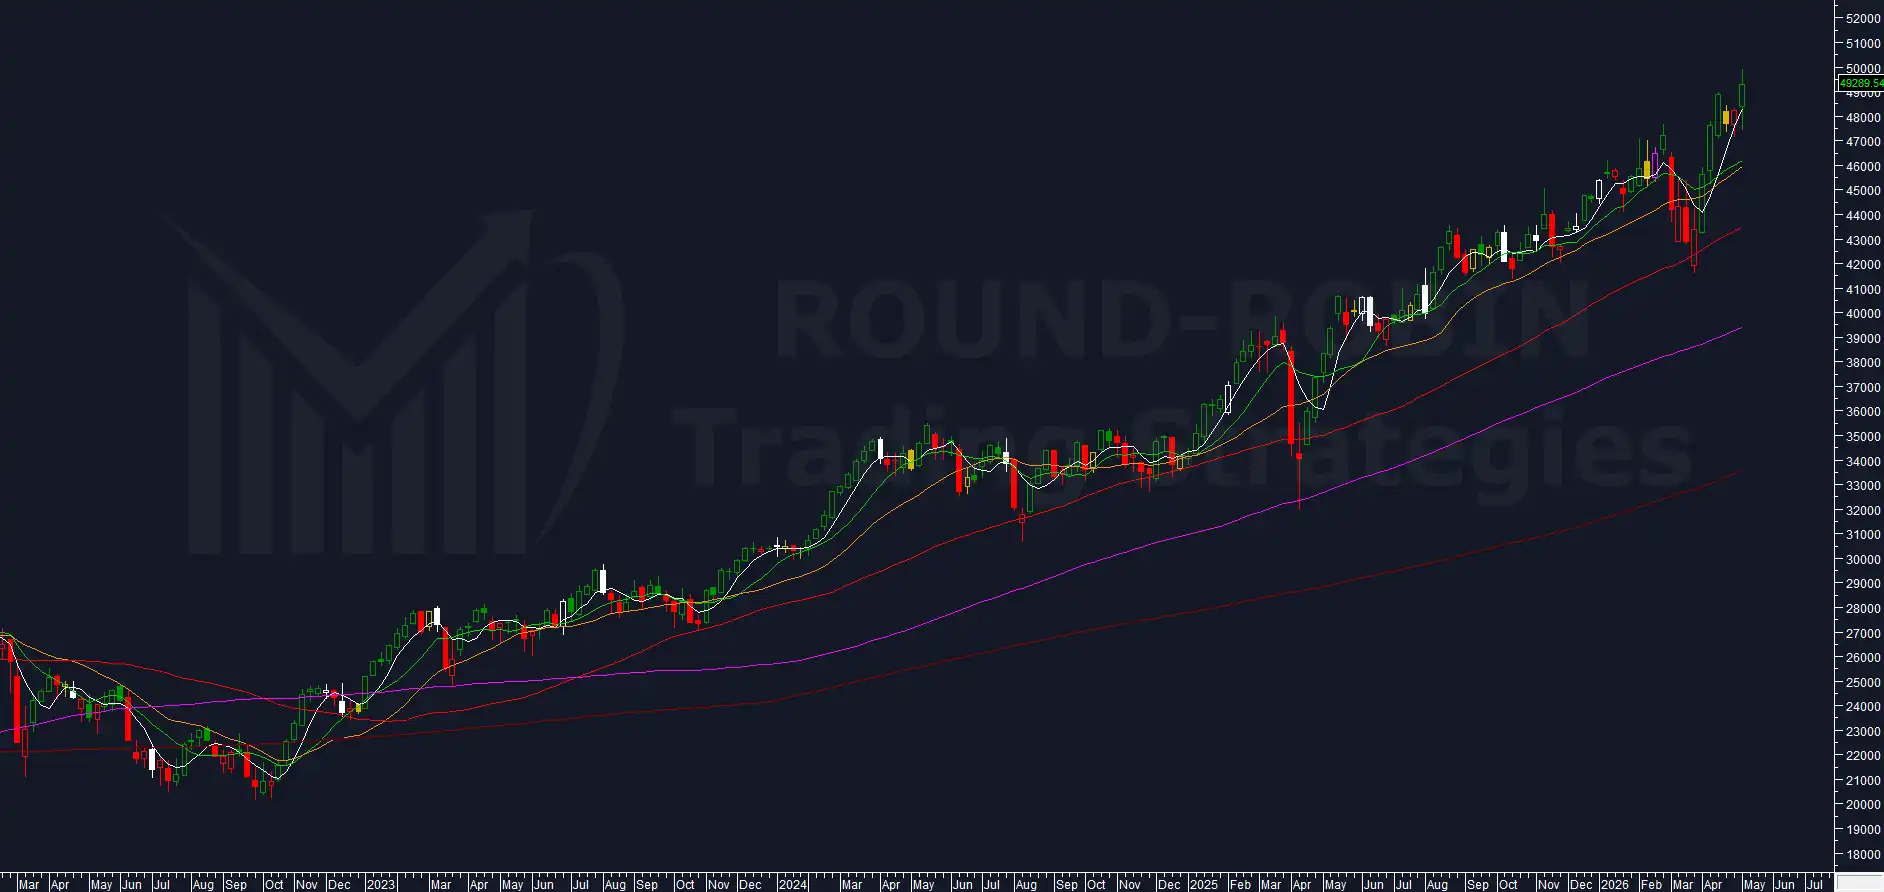
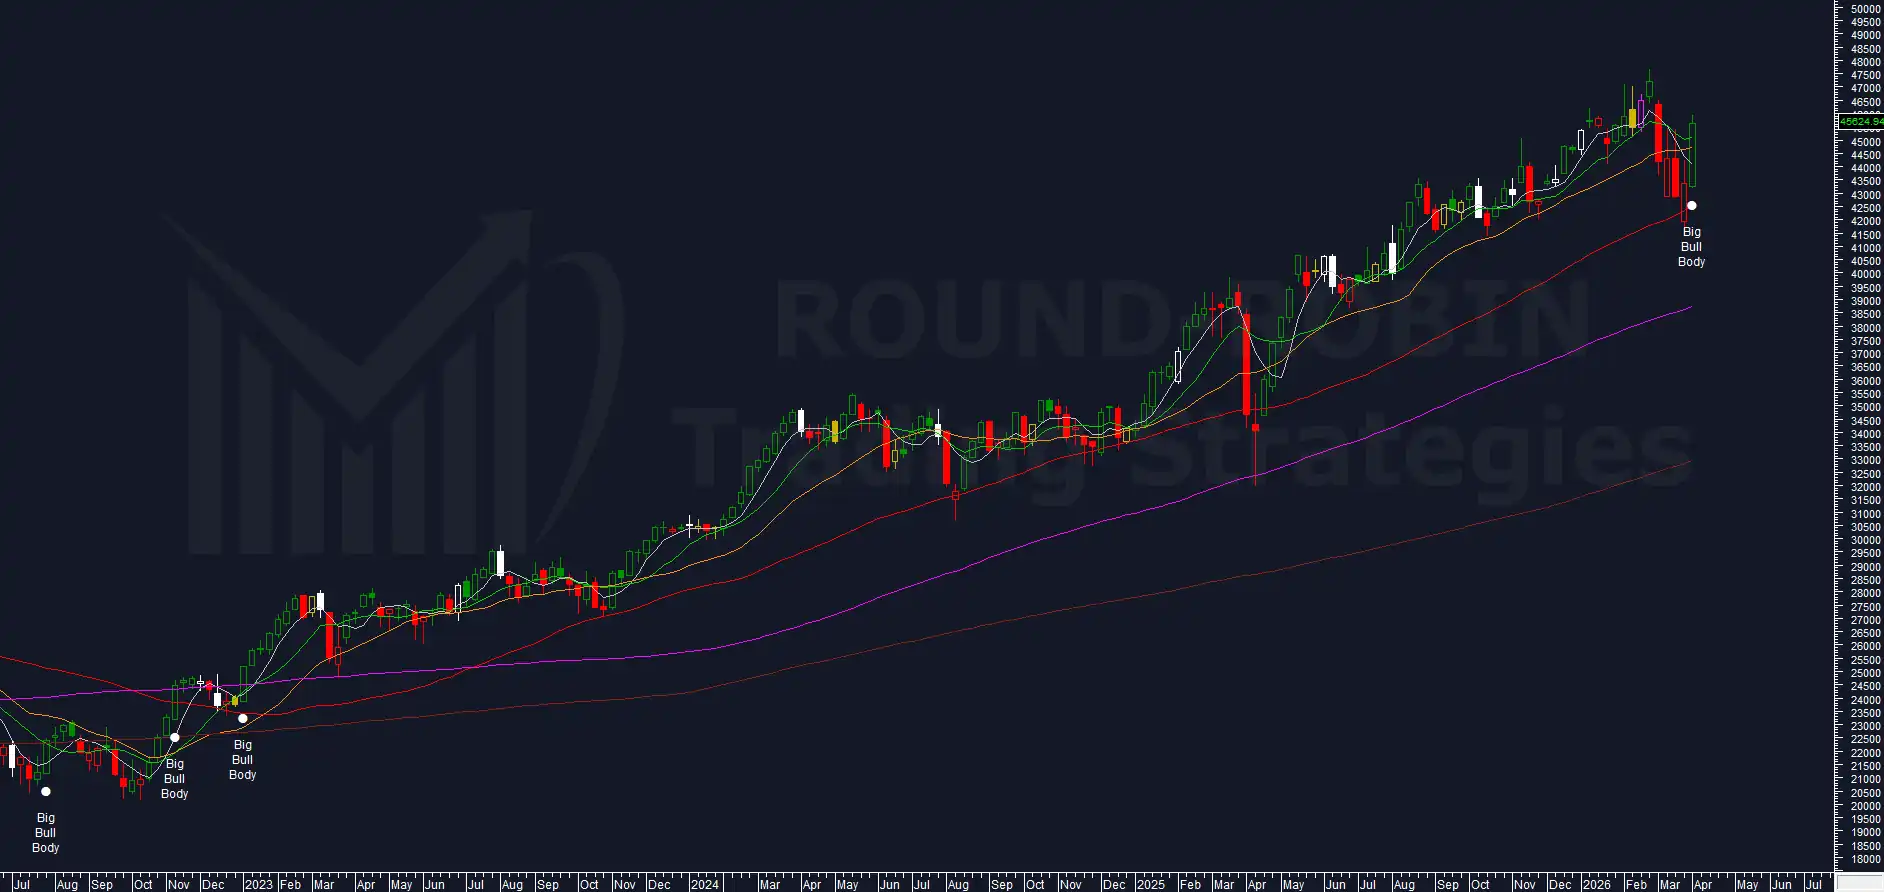
The break above 50,000 on the cash also needs to be put in context. The high recorded two weeks ago was already at 50,050. The formal breakout arrives on levels already touched recently, without a clean break.
The overall picture is one of a market maturing slowly. The bearish scenario still holds room, but week after week brings a small step forward on the opposite front.
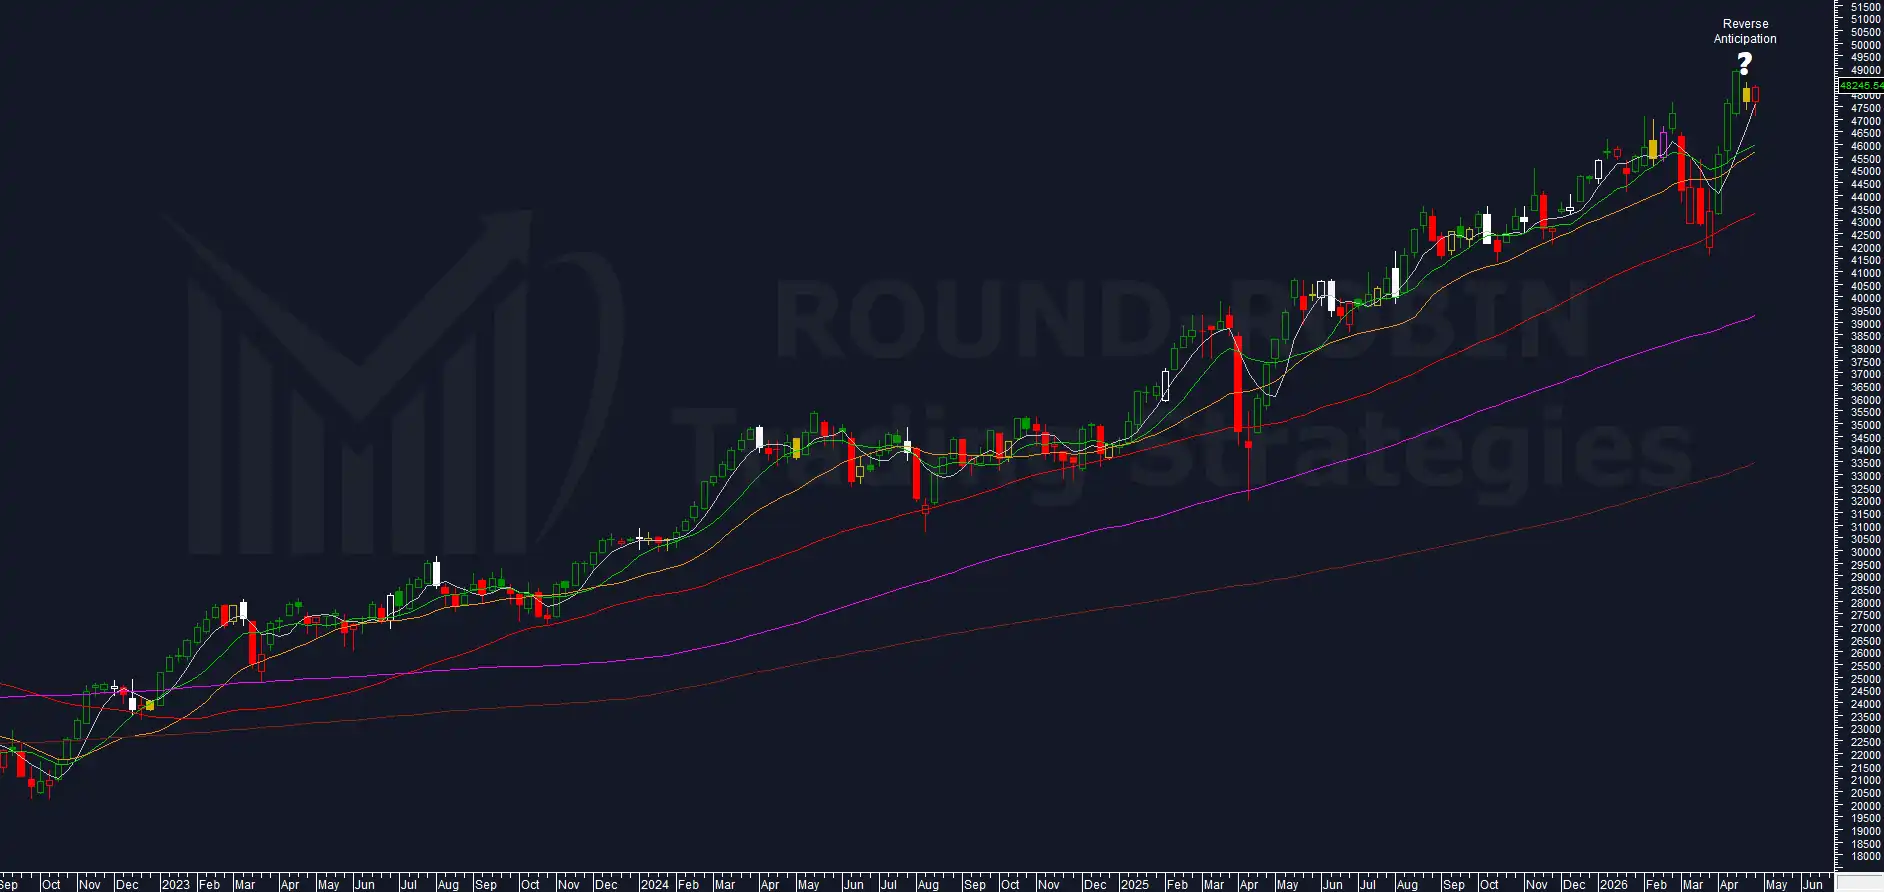
The scenario outlined last week did not materialize. The system remains short.
Let’s look in detail at what the indicators are telling us.