LOGIN SIGNUP
English Italiano
Markets
World Indices
Forex
Commodities
Crypto
EN
IT
×

CONTACT US

Round-Robin Logo

Chart of the week: S&P500 index

A short week for Memorial Day, but a week of records. And not only on price.

The S&P 500 closes at 7,580.06, a new all-time closing high. The weekly high at 7,599.38 also prints the new intraweek record, surpassing the 7,517.12 of two weeks ago.

On the bullish counts, the 25-year record is matched: consecutive weeks with a positive body rise to 9, a level reached only 4 times. Consecutive weeks with higher closes also rise to 9, a threshold reached only twice in the same period.

The push comes from a favorable macro context, particularly on the geopolitical front, with the week’s newsflow feeding an already euphoric market phase.

Let’s look at the details.

Read More →

Chart of the week: S&P500 index

New week, new all-time closing high for the S&P 500 at 7,473.47.

However, the record wasn’t accompanied by a fresh intraweek high above the 7,517.12 printed last week: weekly high capped at 7,506.32.

An unusual record, then, that breaks the 6-week streak of higher highs and higher lows.

Let’s look at the details.

Read More →

Chart of the week: S&P500 index

The S&P 500 returns as Chart of the Week for the third time in five weeks. In the COTW two weeks ago the market was at a crossroads with the Short system down roughly 65 points and the MA200W overextension at 34.94%. In last week’s Charts Flash the crossroads had resolved to the upside with the fifth consecutive week of higher highs and higher lows.

This week the S&P 500 is the only index to have posted a new all-time high on the weekly high (7,517.12) and to have also set a new closing high at 7,408.50, up 9.56 points. Let’s see what the indicators have to say.

Read More →

Chart of the week: Brent Crude Oil

Weekly appointment with the most watched charts in the world.


Over the past two editions the Chart of the Week had focused on the S&P 500, with the system entering short on quantitative excesses and waiting for a price signal coherent with the statistical setup.

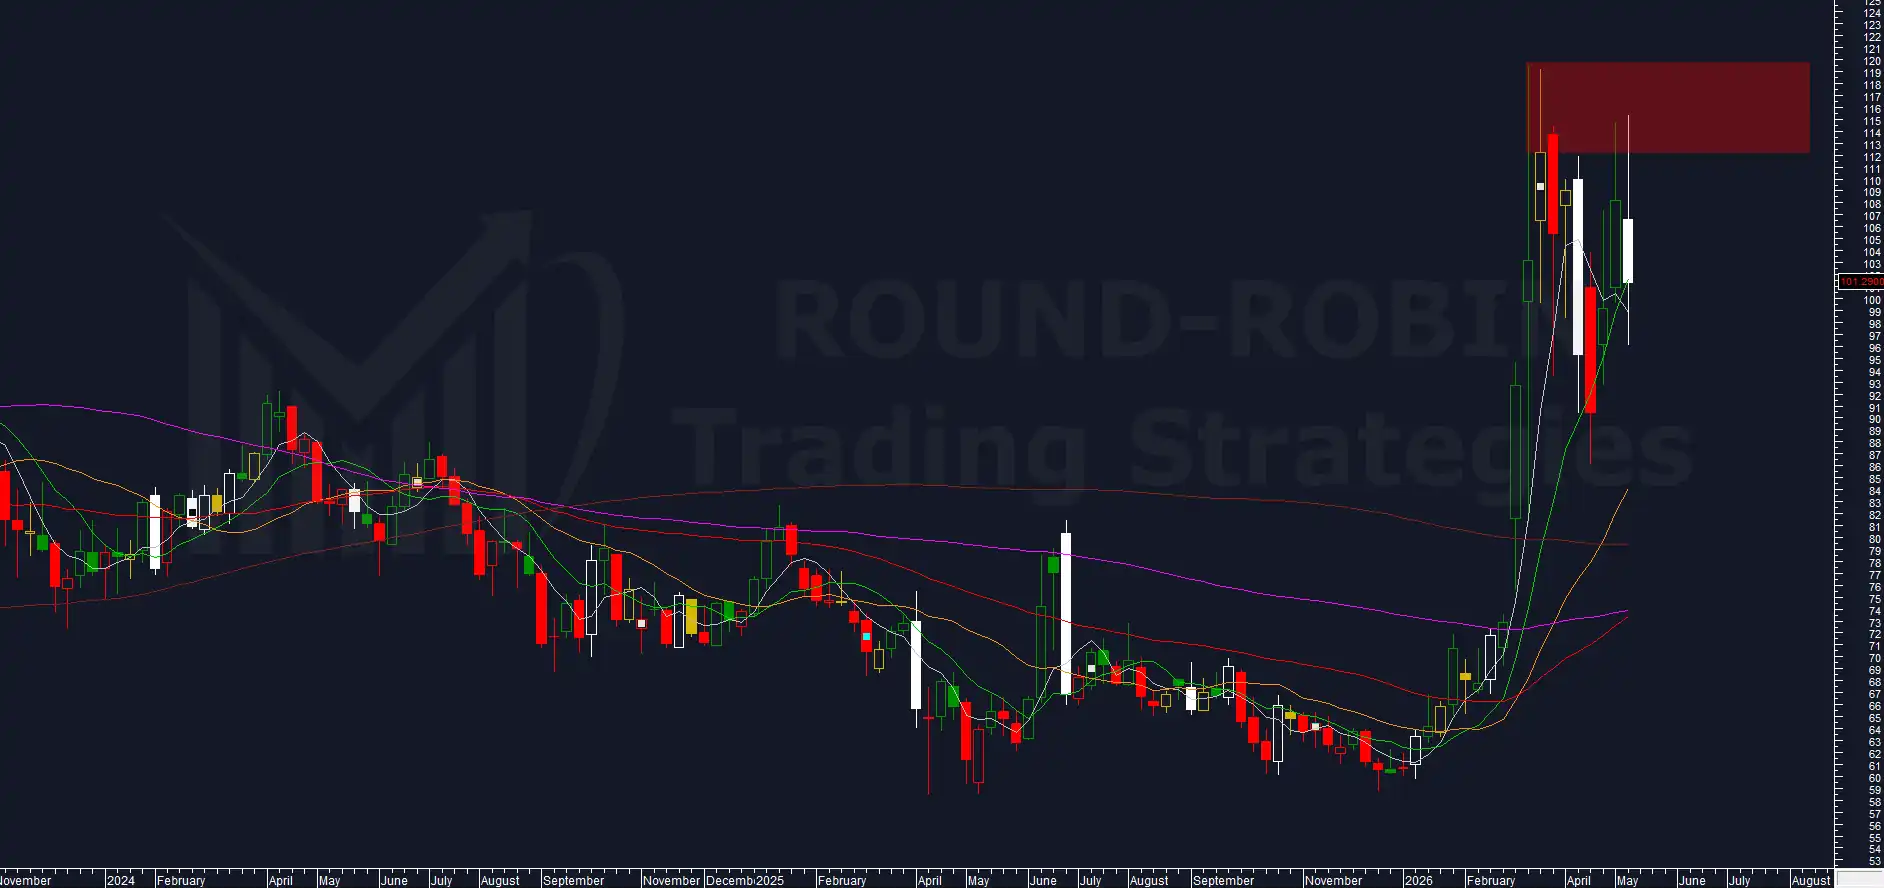
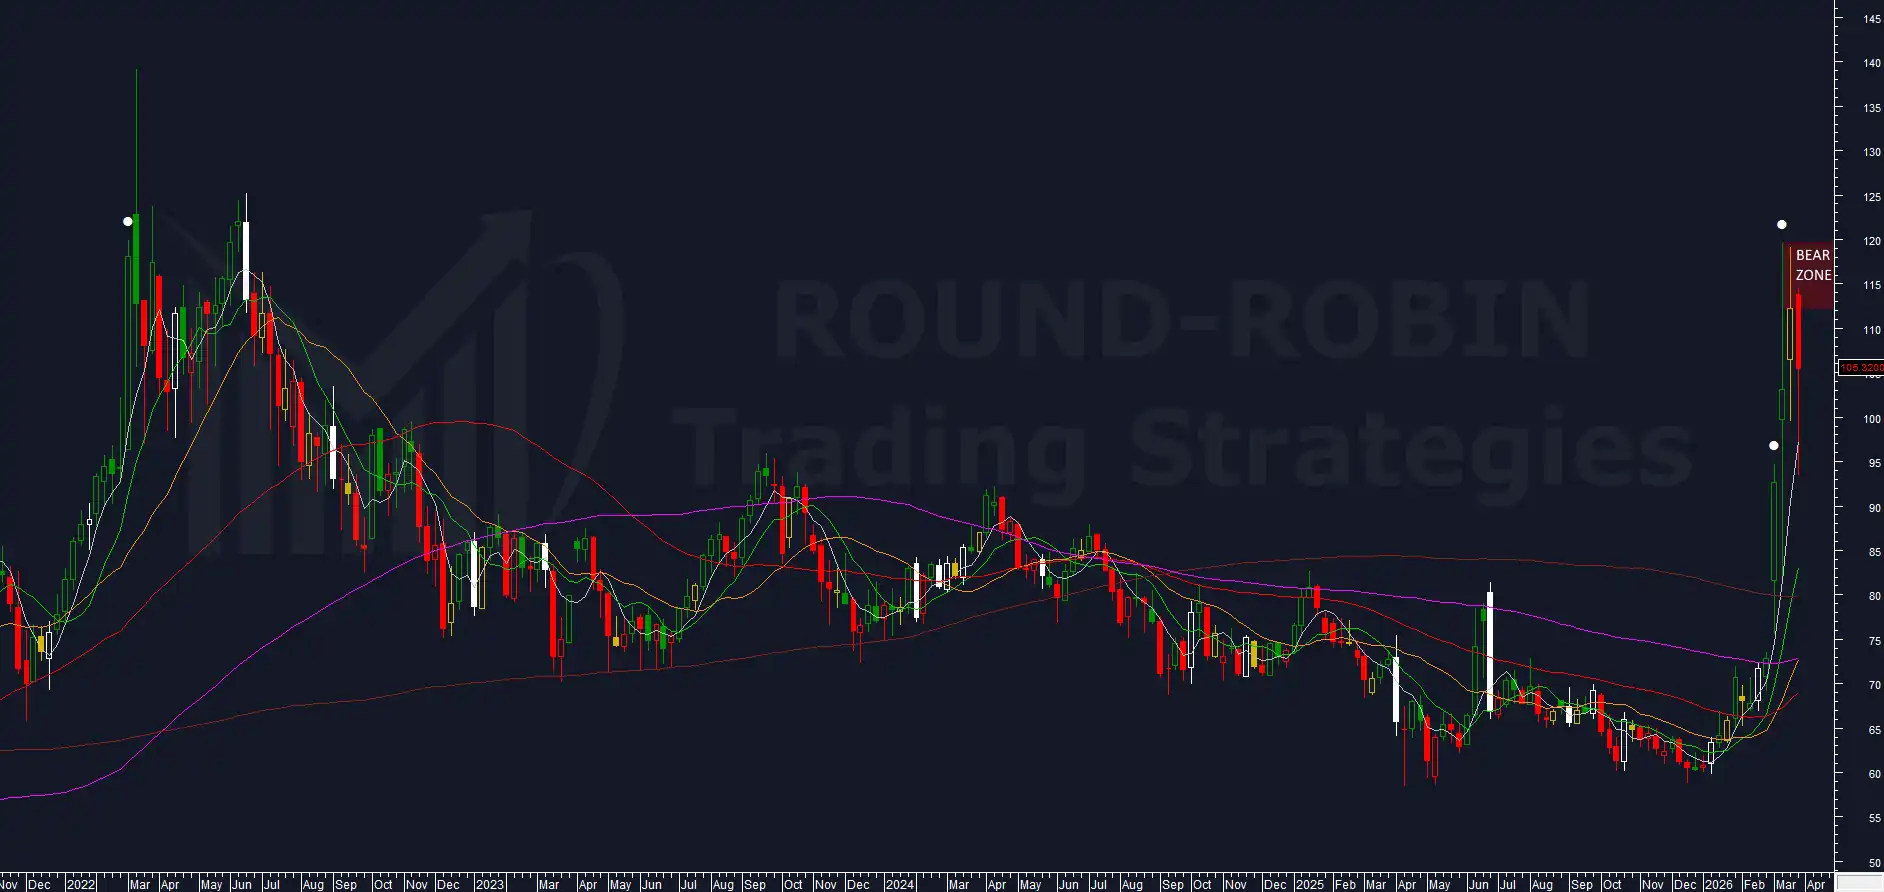
This week the focus shifts to Brent Crude Oil. Not because of a new operational signal, which still remains absent, but because oil now represents one of the most delicate points of the current inter-market picture.

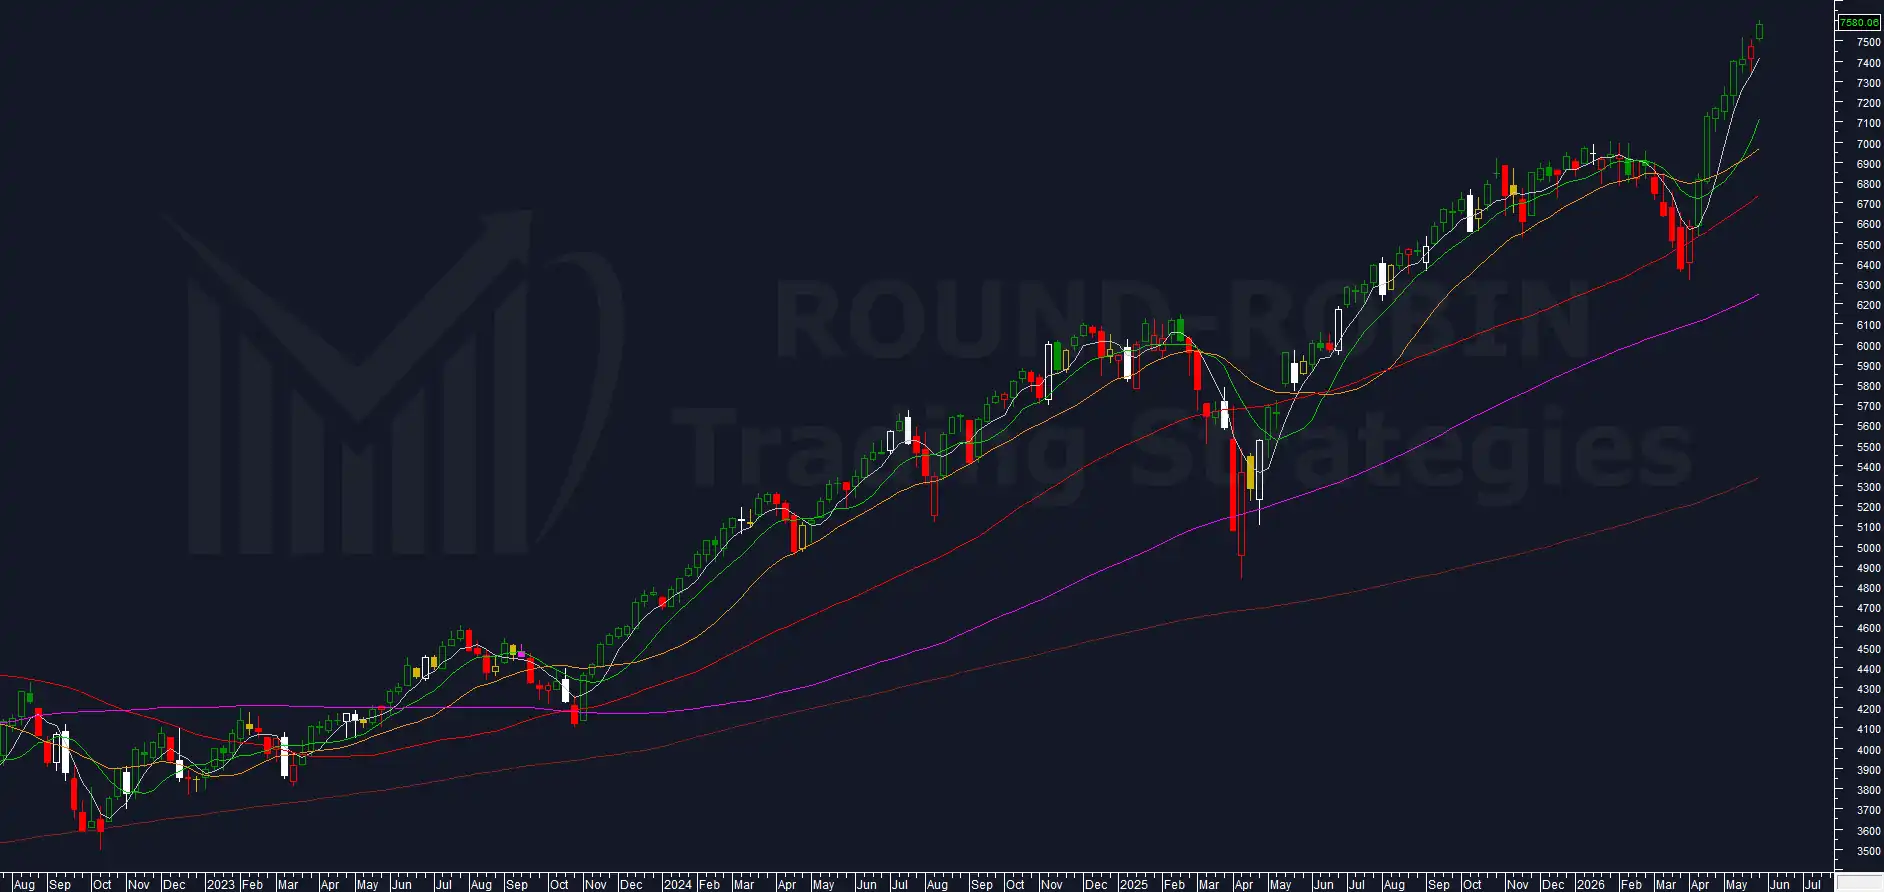
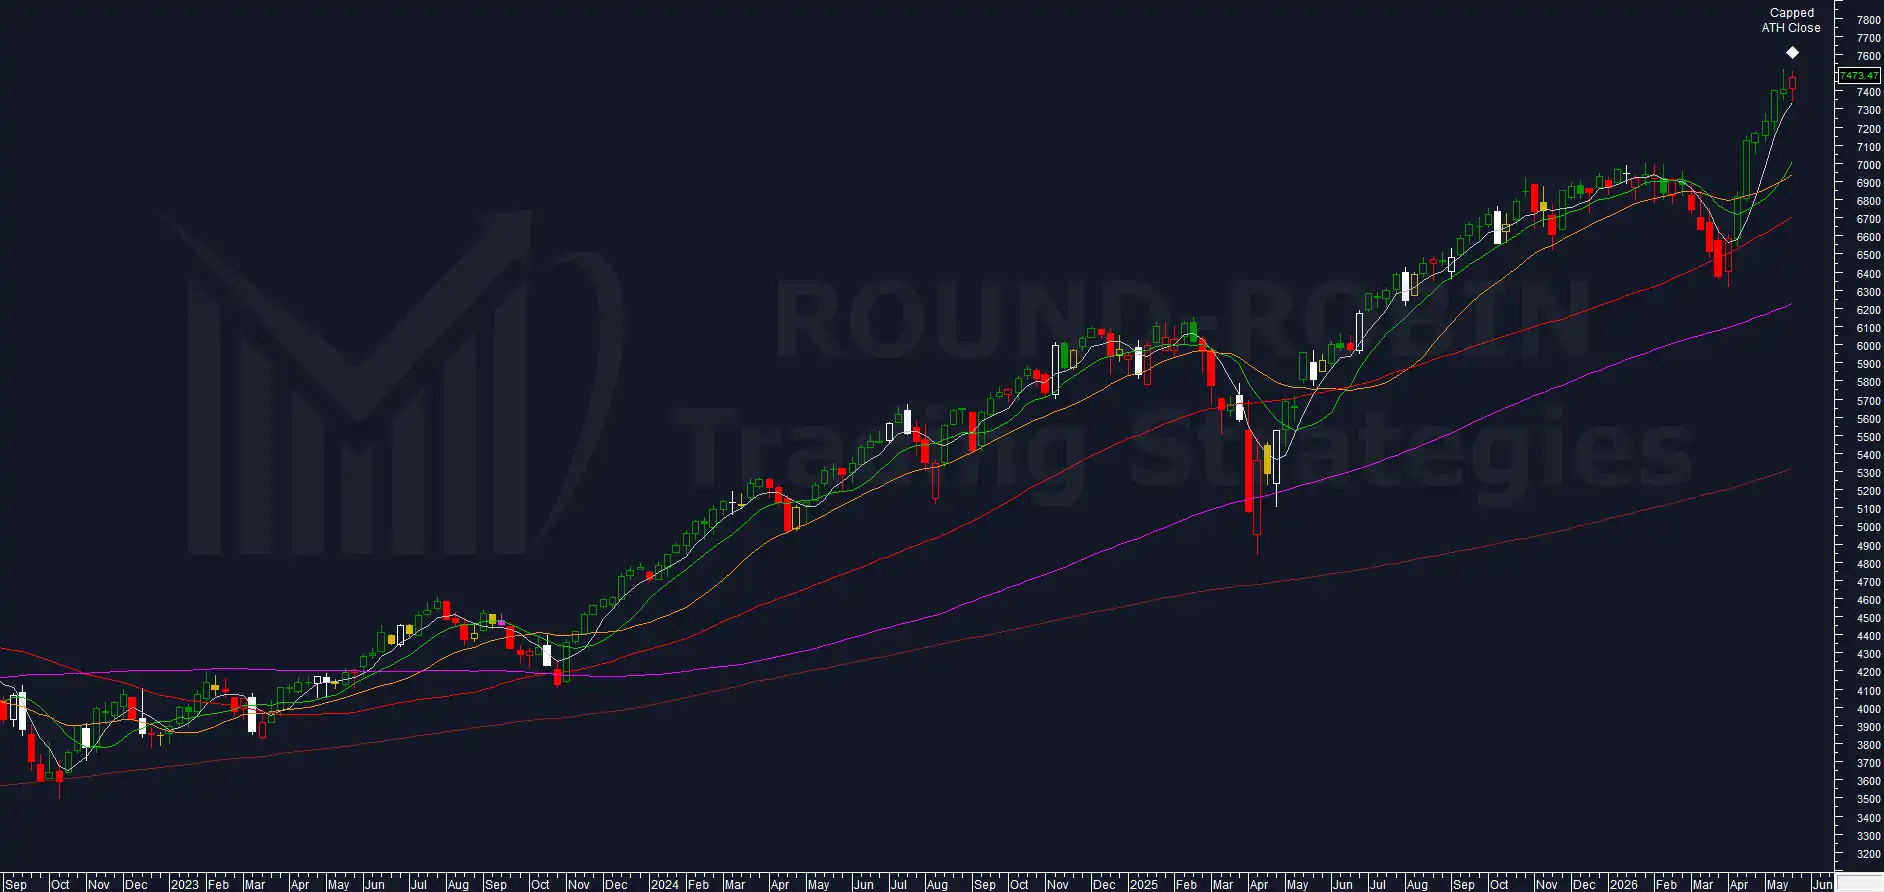
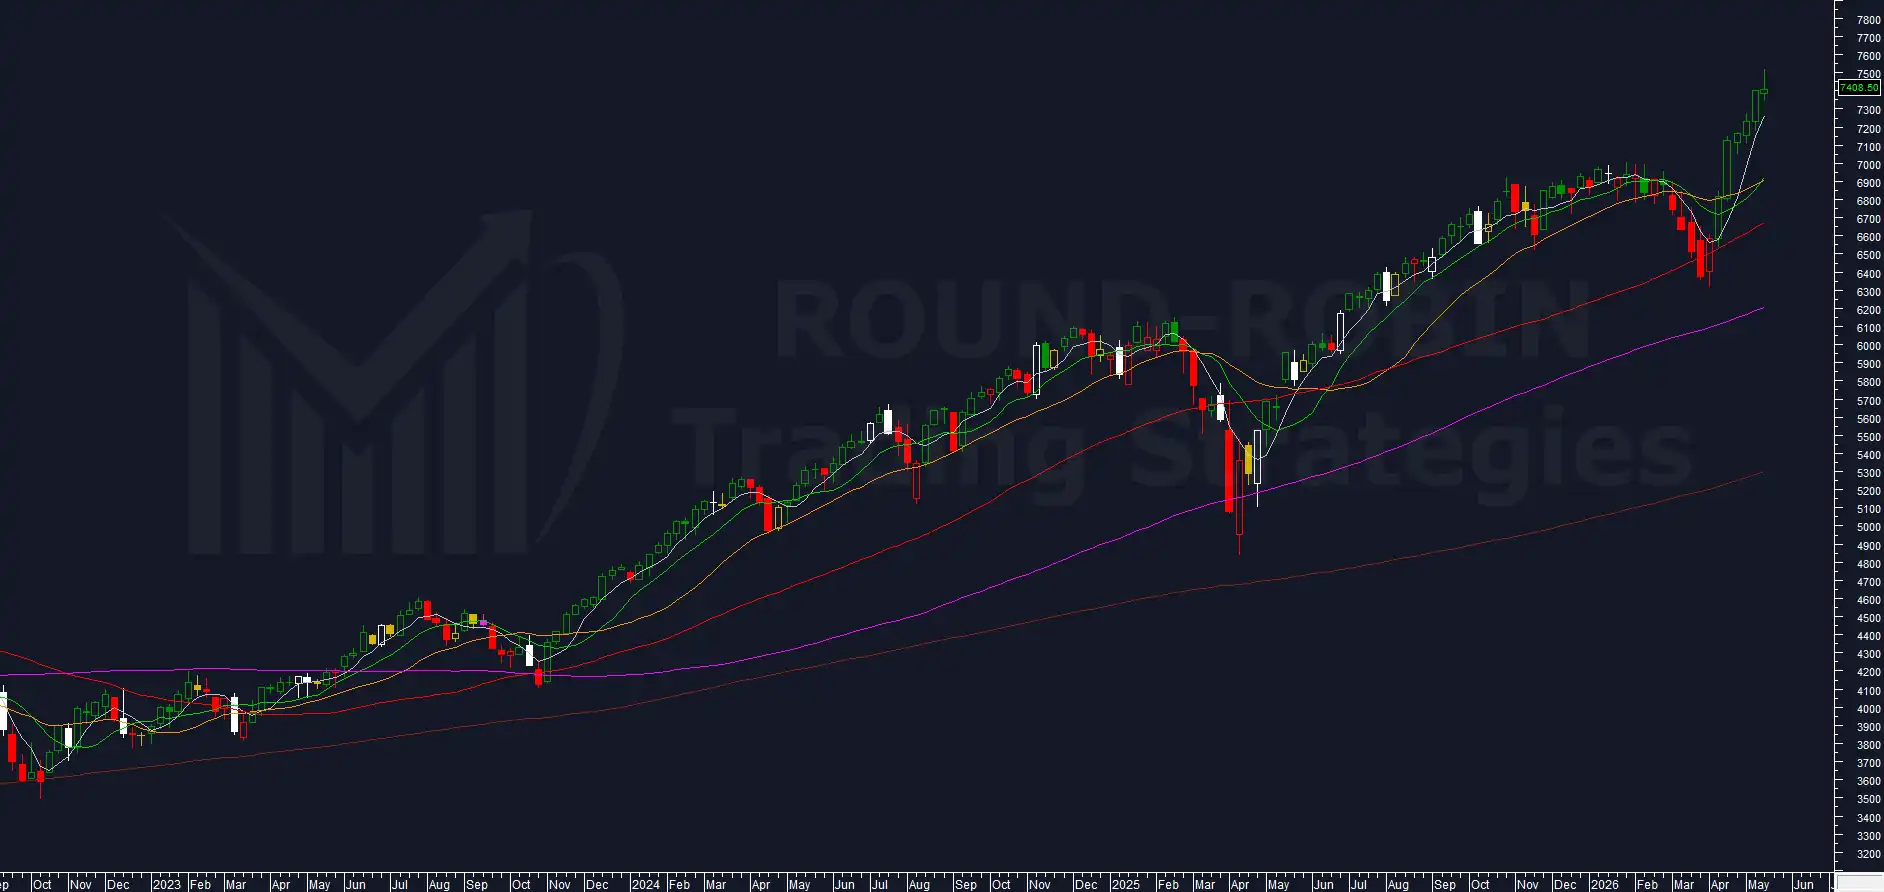
The main global indices continue to display bullish structures, but with profoundly different characteristics. In the United States and Japan the dominant theme remains overextension: S&P 500 and Nikkei 225 are sitting at extremely elevated distances from their respective MA200W, on statistically rare levels. In Europe the picture appears more articulated: DAX, Eurostoxx50 and FTSE MIB maintain bullish structures but are starting to show compression and distribution dynamics at the highs.

In this context Brent continues instead to lag behind. And it is precisely this lag that represents the most interesting data point of the week.

Should oil confirm its bullish setup, the inverse correlation that historically tends to re-emerge in phases of inter-market tension could turn into the catalyst for the correction expected on the indices. Conversely, a structural breakdown of Brent would leave room for a further continuation of the global risk-on move.

Oil, in other words, is not yet confirming anything. But this very lack of confirmation is itself becoming the main element to monitor.

Read More →

Chart of the week: S&P500 index

A weekly appointment with the most watched charts in the world.


Last week’s Chart of the Week was dedicated entirely to the S&P 500, with a bull high volatility reading not seen since March 2000 and a system entering short on historical excesses.

This week the market responded: a new ATH on both the high and the close.

Meanwhile the Fed held rates unchanged, confirming the wait-and-see stance already seen in the prior meeting.

No surprises on the macro front, no capitulation on the technical front.

The market keeps climbing.

Read More →

Chart of the Week: S&P500 index

Weekly appointment with the world’s most watched charts.


Last week in Charts Flash we called the S&P 500 the obvious pick for Chart of the Week, deferring to the Nikkei 225.

Another week of higher highs and higher lows, a new all-time closing high. But in a context of compressed moves and a market that is not pricing risk.

Our volatility indicator tells a different story. We are at levels that in a bull market context have been seen only once in the last 26 years. It was March 2000.

Read More →

Charts of the Week: Nikkei225

Weekly appointment with the world’s most watched charts.


The S&P 500 printed a new all-time high with a clean break confirmed by the weekly close as well. An exceptional bullish candle that under normal circumstances would have been the natural choice for Chart of the Week.

Yet the choice fell on the Nikkei 225.

The Nikkei also touched a new all-time high intraweek at 59,688.10 this week. But unlike the S&P 500, the weekly close at 58,475.90 did not confirm the record, remaining below the all-time closing high of 58,850.27 from the week of February 27.

The reason the Nikkei deserves the main focus is another one.

The overextension on the MA200W has returned above 50%. This week could mark the beginning of that final phase we outlined in our Chart of the Week Week 9.

Read More →

Chart of the Week: Eurostoxx50

Your weekly appointment with the world’s most followed charts.

This week we chose the Eurostoxx 50 as Chart of the Week not because it stood out particularly, but due to the lack of actionable setups from the other assets we follow. Gold and Silver stalling, DAX, FTSE MIB and S&P 500 flat.

The Eurostoxx 50 comes into play as it approaches a long signal, having shown more momentum than the DAX and stronger relative strength.

A configuration that, while not explosive, deserves a closer look.

Let’s see what the charts tell us.

Read More →

Chart of the Week: Nikkei225

Weekly appointment with the most followed charts in the world.

In early March we chose the Nikkei 225 as Chart of the Week to build a bearish case. The overextension on the MA200W had just set a new all-time record at 57.39%, and we wrote that the return below 50% was not a matter of “if” but “when”.

We also wrote something else: once the excesses are exhausted and the overextension falls back below 50%, the index has historically resumed its rise. We called it “the most important trading window”.

That window is opening now.

The Nikkei 225 closed this week at 53,123.49. From the record close at 58,850.27 the index has dropped 14.08% to its low at 50,558.91, completing the first leg of the correction we had anticipated.

Let’s see what the charts are telling us.

Read More →

Chart of the Week: Brent Crude Oil

Weekly appointment with the most followed charts in the world.

Last week we identified the setup and defined the two possible triggers: a bull trap above 119.13 or a direct rejection from the 112.19-119.50 area with a weekly close below 106.

The trigger has fired.

On Monday March 23, with Brent still above 114, Trump announced the suspension of attacks on Iranian energy infrastructure and the start of negotiations. The drop was immediate: within minutes the front month lost over 13%, pushing prices down to 93.45. Iran later denied the existence of any talks, and the market recovered part of the lost ground. All of this in a context already made chaotic by the contract rollover.

The selloff was followed by a recovery, but the recovery did not change the structure. At the weekly close Brent settled at 105.32: it bounced off the lows but failed to reclaim the supply area.

The short signal was generated at Friday’s close. Let’s see what the charts are telling us.

Read More →