


Pattern Decoded is our Monday format where we cover the most well-known patterns in technical analysis. This week we talk about Japanese candlesticks and the Long Upper Shadow.
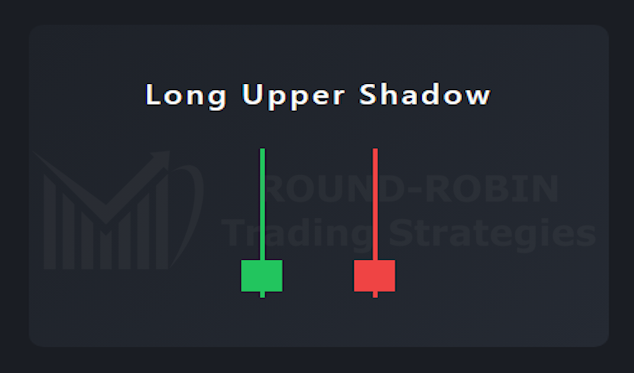
Long Upper Shadow
Pattern Recognition: Japanese Candelsticks – Long Upper Shadow
Let’s talk about Japanese candlesticks.
A charting technique developed in 18th century Japan for the rice market. Each candle represents price movement over a given timeframe. Body, open, close, high, low.
Body color indicates direction:
- Close > Open: bullish candle. Traditionally white, often green, or hollow body.
- Close < Open: bearish candle. Traditionally black, often red, or filled body.
The extensions above and below the body are called shadows or wicks.
Reversal vs Continuation
Candlestick patterns fall into two categories:
- Continuation: suggests the trend will persist.
- Reversal: suggests the trend is about to change direction.
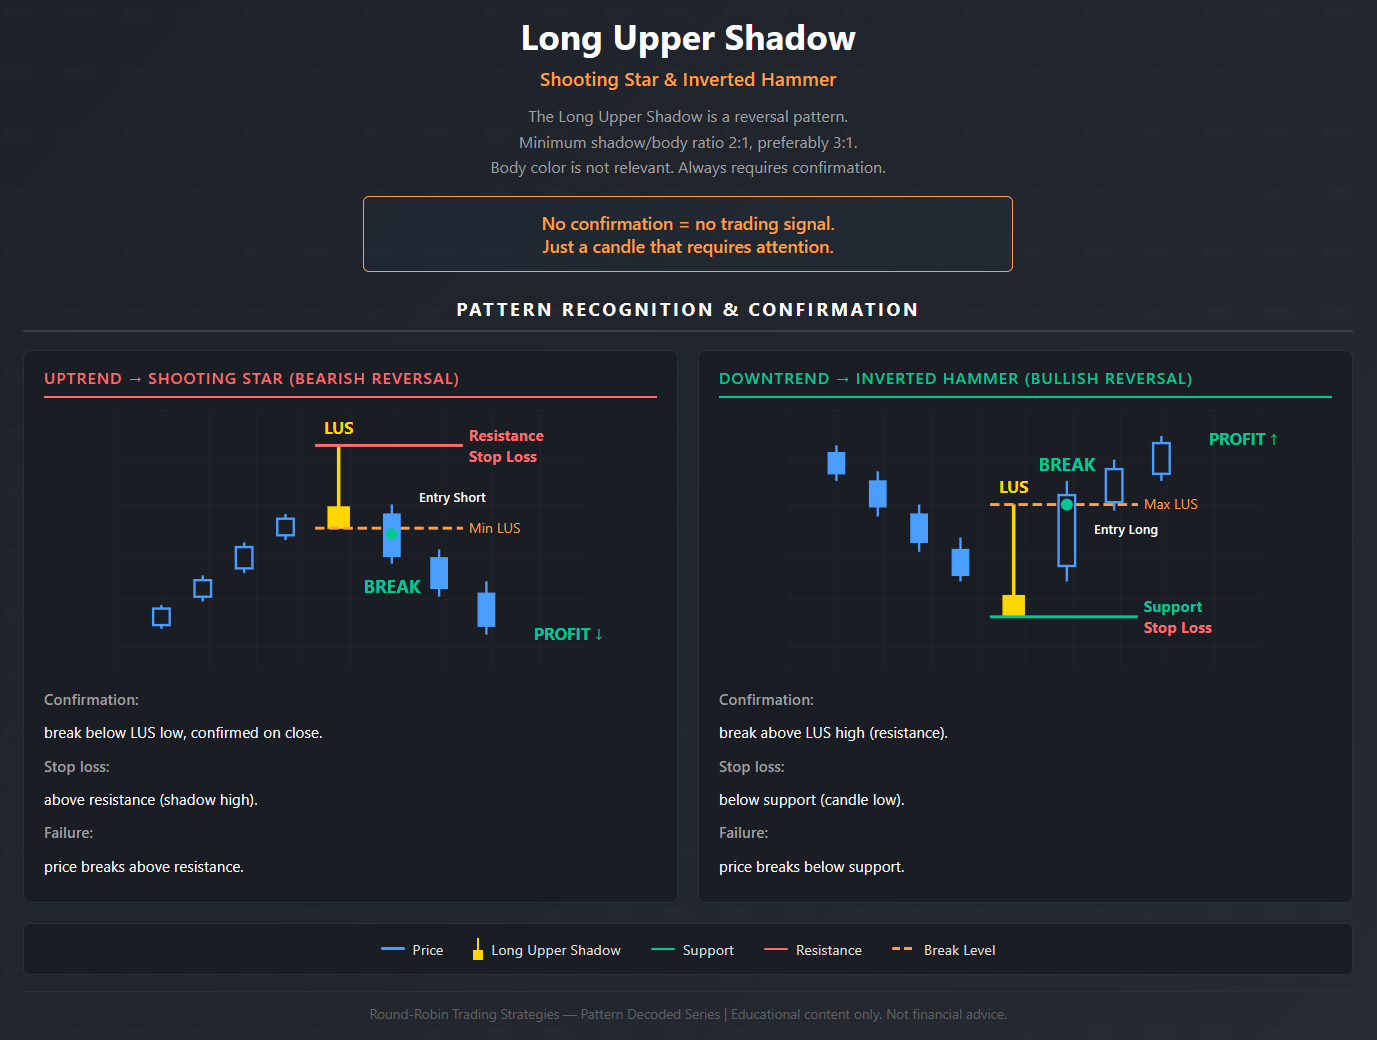
The Long Upper Shadow belongs to the second category. It’s a reversal pattern that requires confirmation.
Morphology
For a candle to qualify as a Long Upper Shadow, the ratio between upper shadow and body must be at least 2:1. Preferably 3:1. Some require 4:1.
For me, 2:1 is acceptable if accompanied by other technical evidence.
Body color — bullish or bearish — is not relevant for classification.
The Dynamics
Price rises from the open on buying pressure from the bulls. But before the close, the bears push prices back down, shrinking the candle body.
A resistance has formed at the highs. The candle’s retracement confirms it visually.
Trend and Terminology
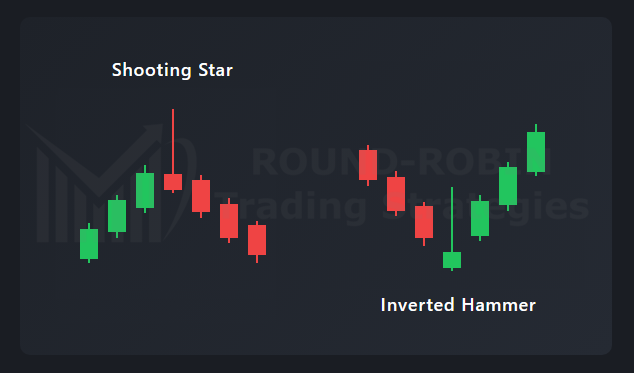
Patttern Recognition: Shooting Star – Inverted Hammer
The same shape takes different names depending on context:
- Uptrend → Shooting Star: buyers attempted a push higher, got rejected. The shadow identifies resistance. Potential bearish reversal.
- Downtrend → Inverted Hammer: buyers push hard to the upside but sellers regain control before the close. Potentially the last gasp of the bears: they limit the damage but realize that pushing lower requires much more effort. The candle identifies support at the low. The shadow identifies resistance — which, if broken, could trigger the reversal. Potential bullish reversal.
Confirmation
The Long Upper Shadow alone is not enough.
The necessary condition is a signal confirming the pattern. It can come from price — the following candle — or from other technical indicators.
The sufficient condition is the break of the LUS low (for Shooting Star) or LUS high (for Inverted Hammer), confirmed on close.
Other evidence that strengthens the signal: the LUS high coincides with a previous high, with a significant moving average, with another relevant technical level.
Trading Implications
Pattern Recognition: Long Upper Shadow
In uptrend (Shooting Star):
- The shadow identifies resistance. That level can be used for stop loss.
- Caution for those looking to go long: the market has shown selling pressure.
- Reversal possible, not certain. Wait for confirmation or require additional evidence alongside the LUS.
The pattern fails if price breaks above resistance.
In downtrend (Inverted Hammer):
- The candle identifies support at the low. The shadow identifies resistance.
- The buy signal comes on the break of resistance.
- Caution for those holding shorts: buyers have shown strength.
The pattern fails if price breaks below support.
Next time you see a Long Upper Shadow, ask yourself: is there confirmation?
Is there additional technical evidence?
If the answer is no, you don’t have a trading signal.
You have a candle that requires attention, not action.
Leave a Reply