


Pattern Spotted is our Wednesday format that showcases real-world applications of Monday’s Pattern Decoded. This week: Long Upper Shadow.
EUR/USD: The King of Shooting Stars
Let’s start immediately with the king of Shooting Stars: EUR/USD. From 2016, five out of six occurrences have been successful (one was not confirmed). Impressive.
Let’s focus on the period 2022-2026.
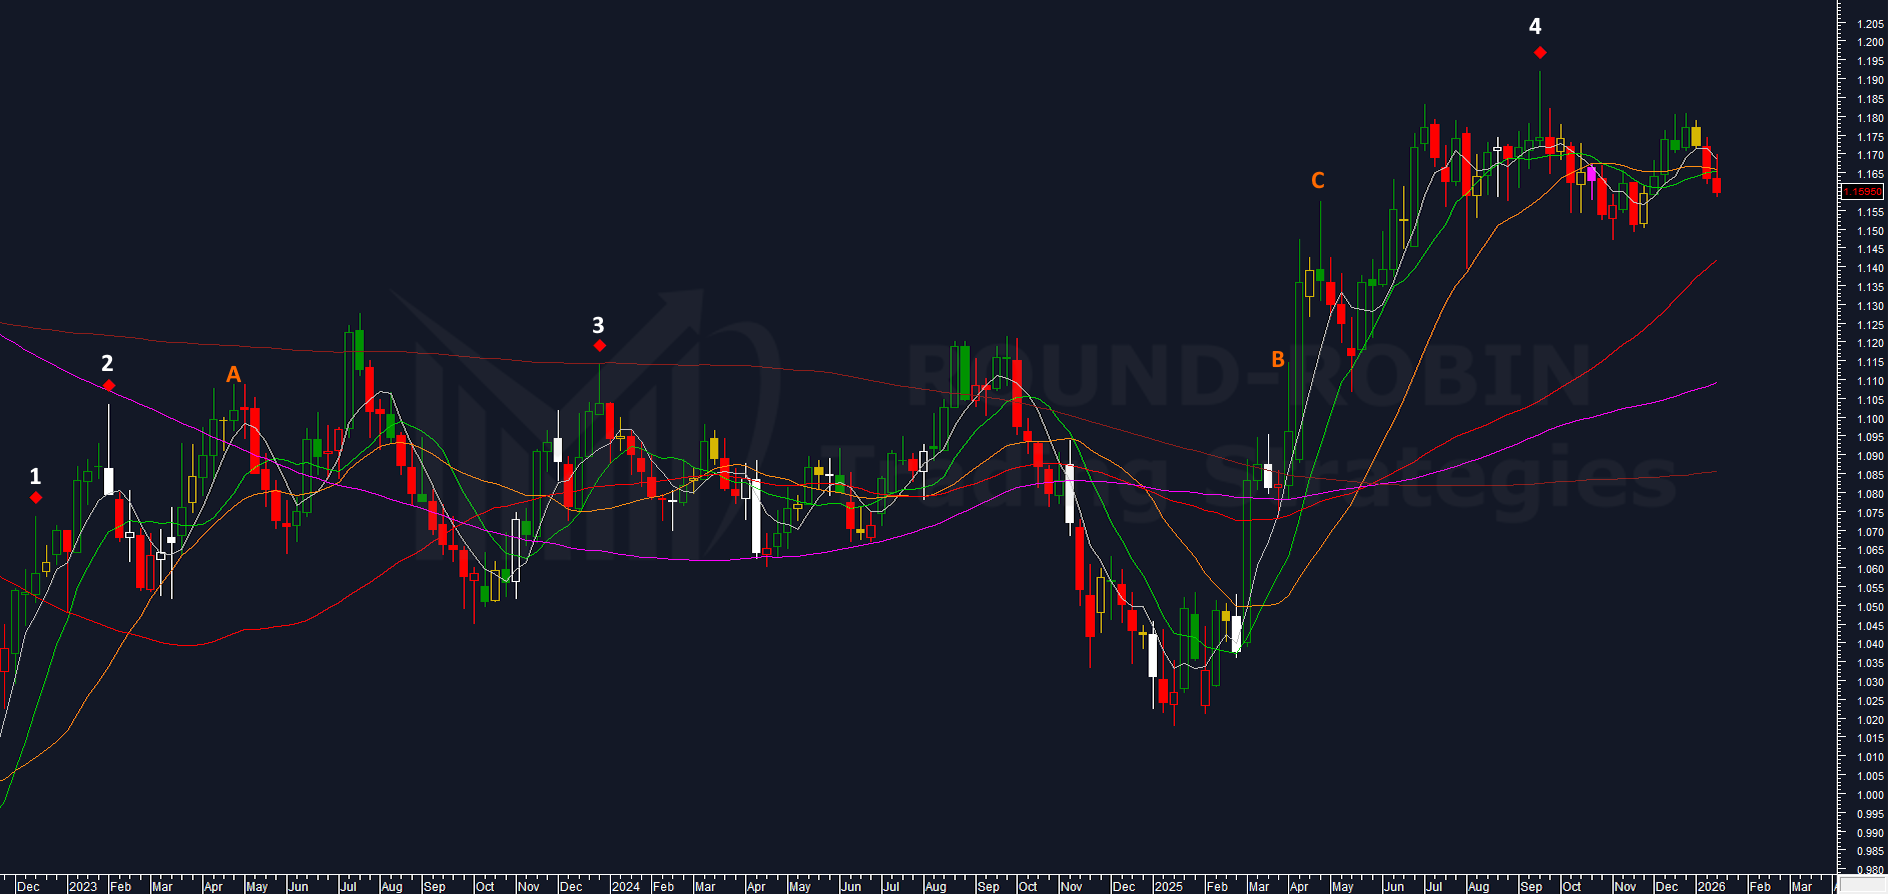
chart: EURUSD weekly – Shooting Stars
Case 1: December 2022 – Setup Not Confirmed
Analyzing carefully, we see that the Shooting Star appeared the same day EUR/USD broke above the MA50W (typically not a bearish confirmation).
The next week it was an inside bar.
As we know from Pattern Decoded, the pattern requires either a price or a technical confirmation. None was present.
Case 2: February 2023 – Setup Confirmed (Bearish Success)
A beautiful setup: not only the Shooting Star, but also a MA100W rejection AND an outside week candle (high extended the prior week’s high, low extended the prior week’s low) – we use white candles to show all outsides, hollow or filled.
In this case, you don’t need the break of the low in the following week, since the reversal is supported by other evidence (at least, this is my approach).
Of course, it would have been equally correct – by the manuals – to wait for the next week’s confirmation.
Case 3: December 2023 – Setup Confirmed (Bearish Success)
Also in this case, the Shooting Star was created by a moving average rejection (MA50W) – that’s a great validation.
Enough to place a trade without waiting for the next week’s close confirmation.
Case 4: September 2025 – Setup Confirmed (Bearish Success)
In this case, the moving averages didn’t help: the fastest MA5W to MA20W were too flat on prices. Therefore, a price confirmation was required.
The confirmation arrived with the close of the following week, which closed below the low.
How We Define a Shooting Star
Note about how we calculate the Shooting Star: it must be a 20-week market high, it must have an upper shadow AT LEAST 2x bigger than the body, AND a lower shadow less than 10% of the whole weekly range.
Zero arbitrariness. That’s why we didn’t consider the following cases:
A) April 2023: There’s no Shooting Star – the upper shadow to body ratio isn’t respected.
Devil’s Advocate: “Yeah, but it paid out!”
Yes, it did. But it’s not a Shooting Star, and in my opinion, the move was driven by the Long-Legged Doji of the following week, not the wannabe Shooting Star.
B) April 4, 2025: A sweet, deep long shadow, but again, the 2:1 shadow-to-body ratio isn’t met. I guess in this case there’s no devil’s advocate since it would have been a loss.
C) April 25, 2025: That’s really nice – a super long upper shadow and a very tiny body. BUT the lower shadow is not only present but bigger than the body. This is not a Shooting Star, even though the market reversed.
What Should You Have Learned From This?
First, how to spot a Shooting Star on a chart.
Second, to be consistent. If you required once that the Shooting Star is a 20-week market top, you can’t accept next time a beautiful Shooting Star that’s only a 10-week high. If you married the 3:1 ratio, you can’t switch to 2:1 – you know, breaking a marriage can cost a lot. And if you waited for the next week’s close confirmation, keep doing it even if in hindsight you found out you could have anticipated.
Bonus: It works on all markets and on all timeframes (with different orders of magnitude, of course).
Does It Always Work?
No, as with all statistical tools.

chart: Brent Oil weekly – Failed Shooting Star
In this example on Oil (Brent), a terrible, painful failure.
March 2024: a crystal-clear Shooting Star.
Everything was saying it was a perfect reversal signal.
The long-term trend was bearish, short-term bullish, and the Shooting Star hit the MA100W. The high was lower than the prior high (September 2022)… the perfect storm.
Instead, two weeks later: a violent breakout to the upside… that turned out to be a bullish trap.
This is one of the worst losses a trader can face from a psychological point of view: the right idea, stop loss gets hit, and then you watch prices almost immediately go in what was the right direction. But again, consistency… the next time, a good trader will have the same approach.
The Inverted Hammer: A Legend?
It’s very rare to see a long upper shadow at the lows of a bear market. Why?
Here’s an example: if our setup requires a 20-candle low (any timeframe), and bulls come in strong, it’s likely that bears will start taking profits, so the candle often tends to close at the highs.
Conversely, when prices have already been rising for 20 candles (any timeframe), bulls are more exposed both to profit-taking and to bears looking for a resistance point.
The first scenario – asking for a reaction in a candle that started badly for those already in profit – is much less probable.
The Inverted Hammer is not only less likely to appear, but even less likely to provide a buy signal. Often (on major assets: indices, commodities, currencies), contrary to theory, the trend continues – maybe not for long, but the decline tends to persist.
For this reason, several technical analysts use workarounds (often ex-post) to explain how it actually works well. The two most common:
1. It doesn’t need to be exactly at a low… just close to one.
2. The price signal doesn’t need to be the very next candle (some accept 3-candle setups, some 5… some even more).
I don’t favor tricks designed to make the numbers work.
The first criterion is, in my view, aberrant.
The second depends on how deep the subsequent move went and for how long.
If the answer is “not much” for both, using the Inverted Hammer’s high as a bullish entry point makes sense – after all, it’s a resistance level.
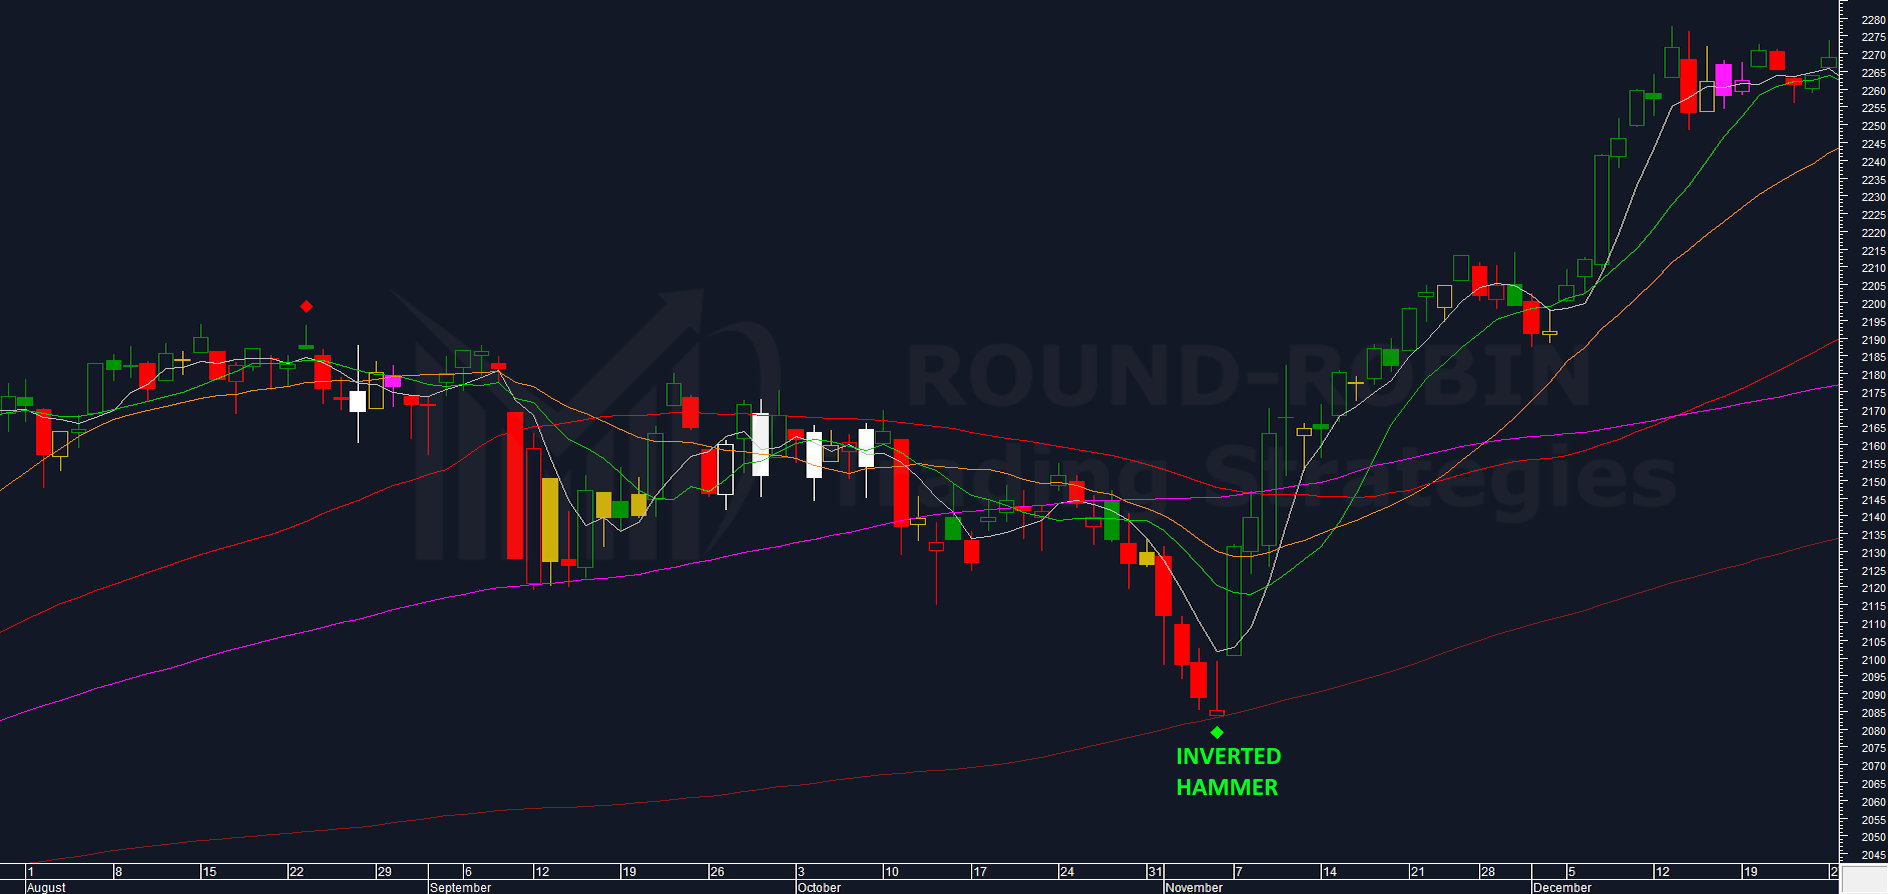
chart: S&P500 daily – Inverted Hammer
I’ll close with an example on S&P 500 daily (November 4, 2017) of what I consider a true Inverted Hammer:
- a 20-candle low (in this example, 20 daily)
- the shadow-to-body ratio of at least 2:1 respected
- accompanied by at least one technical signal (MA200 holding)
- followed by price confirmation immediately at the close of the next candle
Conclusion
This time, very personal conclusions – but statistically unassailable on daily and weekly charts:
Shooting Stars are excellent, yet can fail: They are perfectly identifiable and rarely fail to confirm the setup.
Inverted Hammers are not as reliable: They are even rarer than Shooting Stars. With a rigid algorithmic approach, they very often fail to confirm the setup (they often don’t break above the Long Upper Shadow’s high). Provocatively, I would say they actually qualify as perfect continuation patterns… albeit often for only a limited number of candles.
Leave a Reply