


Pattern Spotted is our Wednesday format that shows real-world application of Monday’s Pattern Decoded.
Two Case Studies on Dow Jones Weekly
We’re using the Dow Jones Industrial weekly chart, which offers two perfect cases: a wannabe double top and a real double top.
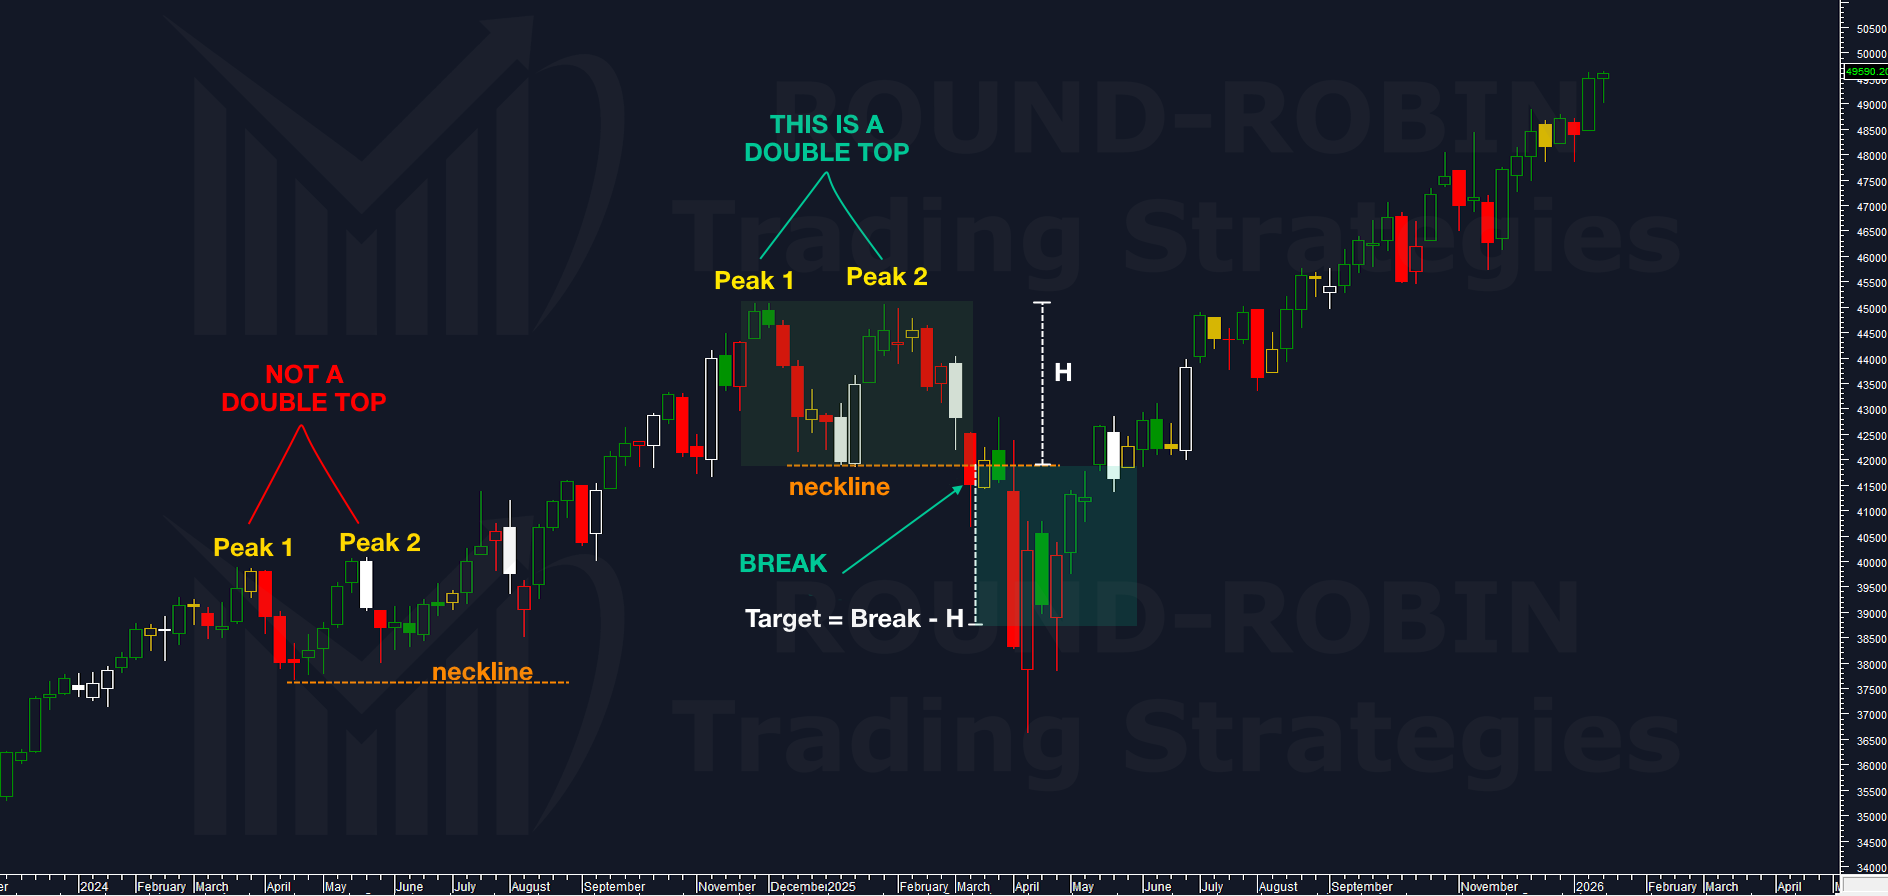
chart: Dow Jones Industrial
The False Double Top (March-May 2024)
Let’s start with what is NOT a double top.
The week of March 22, 2024, the Dow Jones hits a peak (Peak 1) at 39,889.05 that cannot be surpassed in subsequent weeks. A decline follows to a relative low of 37,611.56 (neckline) in the week of April 19, 2024.
The subsequent rally brings the Dow Jones back to a top of 40,077.40 (Peak 2) – note that it’s not exactly the same price, but the distance is reasonable. Moreover, the negative weekly close on May 24 confirms there was resistance.
But what happens next?
Price drops toward the neckline but never breaks it to the downside, and the American index starts a rally that lasts for months. Zero bearish signals. No double top, no sequence of lower highs and lower lows: the uptrend remains intact.
The Real Double Top (December 2024 – January 2025)
The rally stops in the week of December 5, 2024, where we identify another peak (Peak 1) at 45,073.63. Prices fail to go higher and retrace to 41,884.89 (week of January 17, 2025), which becomes the neckline.
A rally follows up to 45,045.36 in the week of January 31, 2025 (Peak 2, practically perfect at the same level as Peak 1). Prices get rejected and break the neckline to the downside.
At the weekly close below the neckline, we finally have a confirmed double top.
Critical attention: timeframe is everything. You don’t call a double top on the weekly chart if price closes below the neckline on Monday… you need to wait for Friday’s close.
Target Calculation
The minimum target of the double top is calculated as follows:
H (pattern height) = Peak – Neckline H = 45,073.63 – 41,884.89 = 3,188.74 points
Minimum target = Neckline break point – H Target = 41,884.89 – 3,188.74 = 38,696.15
This is the pattern’s minimum target. Price can drop well beyond this level.
Pay Attention to How the Signal Developed
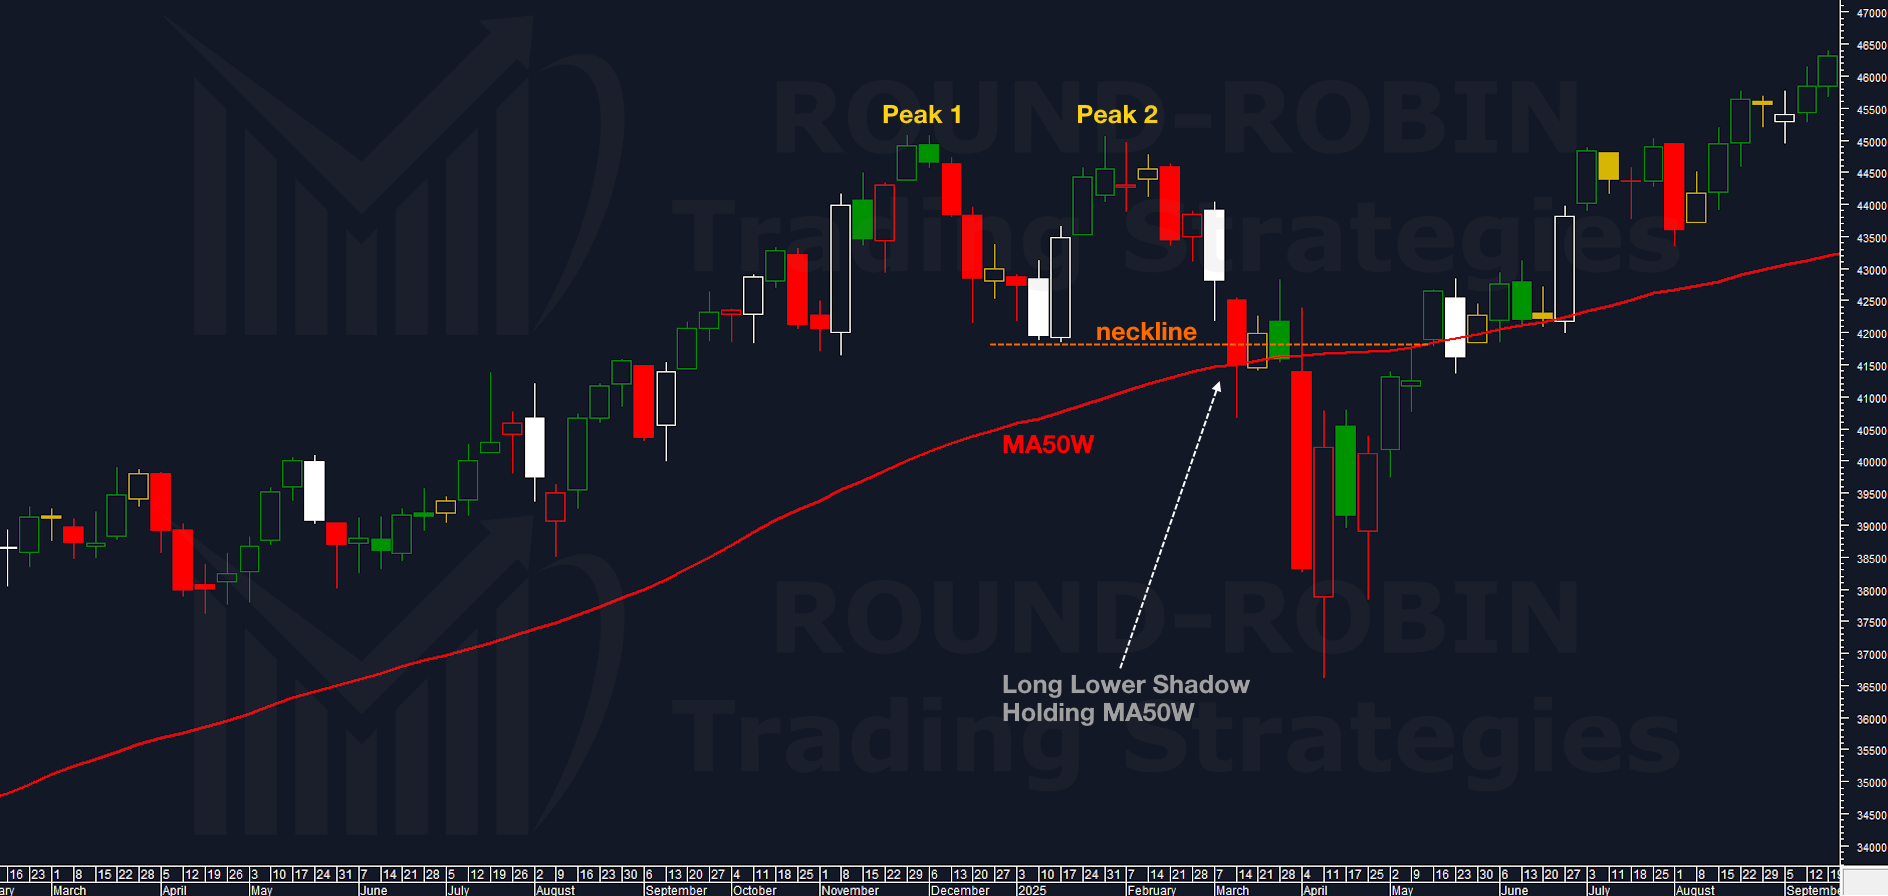
chart:: Dow Jones Double Top and MA50W
In the two weeks following the breakdown, prices consolidated around the neckline instead of dropping directly. There was a substantial technical reason: the breakout candle had a substantial lower shadow, signaling buying at the lows, and price leaned on the 50-period weekly moving average (MA50W) for two consecutive weeks before the final violent breakdown.
This chart teaches us how important it is to focus on what the main signal is: the double top or the MA50 holding?
In these cases, I always prefer trading the formation of lower lows (neckline break, confirmed fact) rather than a hypothetical MA50W hold. If we hadn’t entered at the neckline break and had waited for the MA50W break, we would have missed the trade.
But it wouldn’t have been wrong either to skip trading the double top: first for failing to break MA50, and then for having already reached the target once the MA50W was actually broken.
On Which Charts Does the Double Top Work?
All of them. The psychological principle behind it is the same: indices, forex, commodities, and even cryptocurrencies.
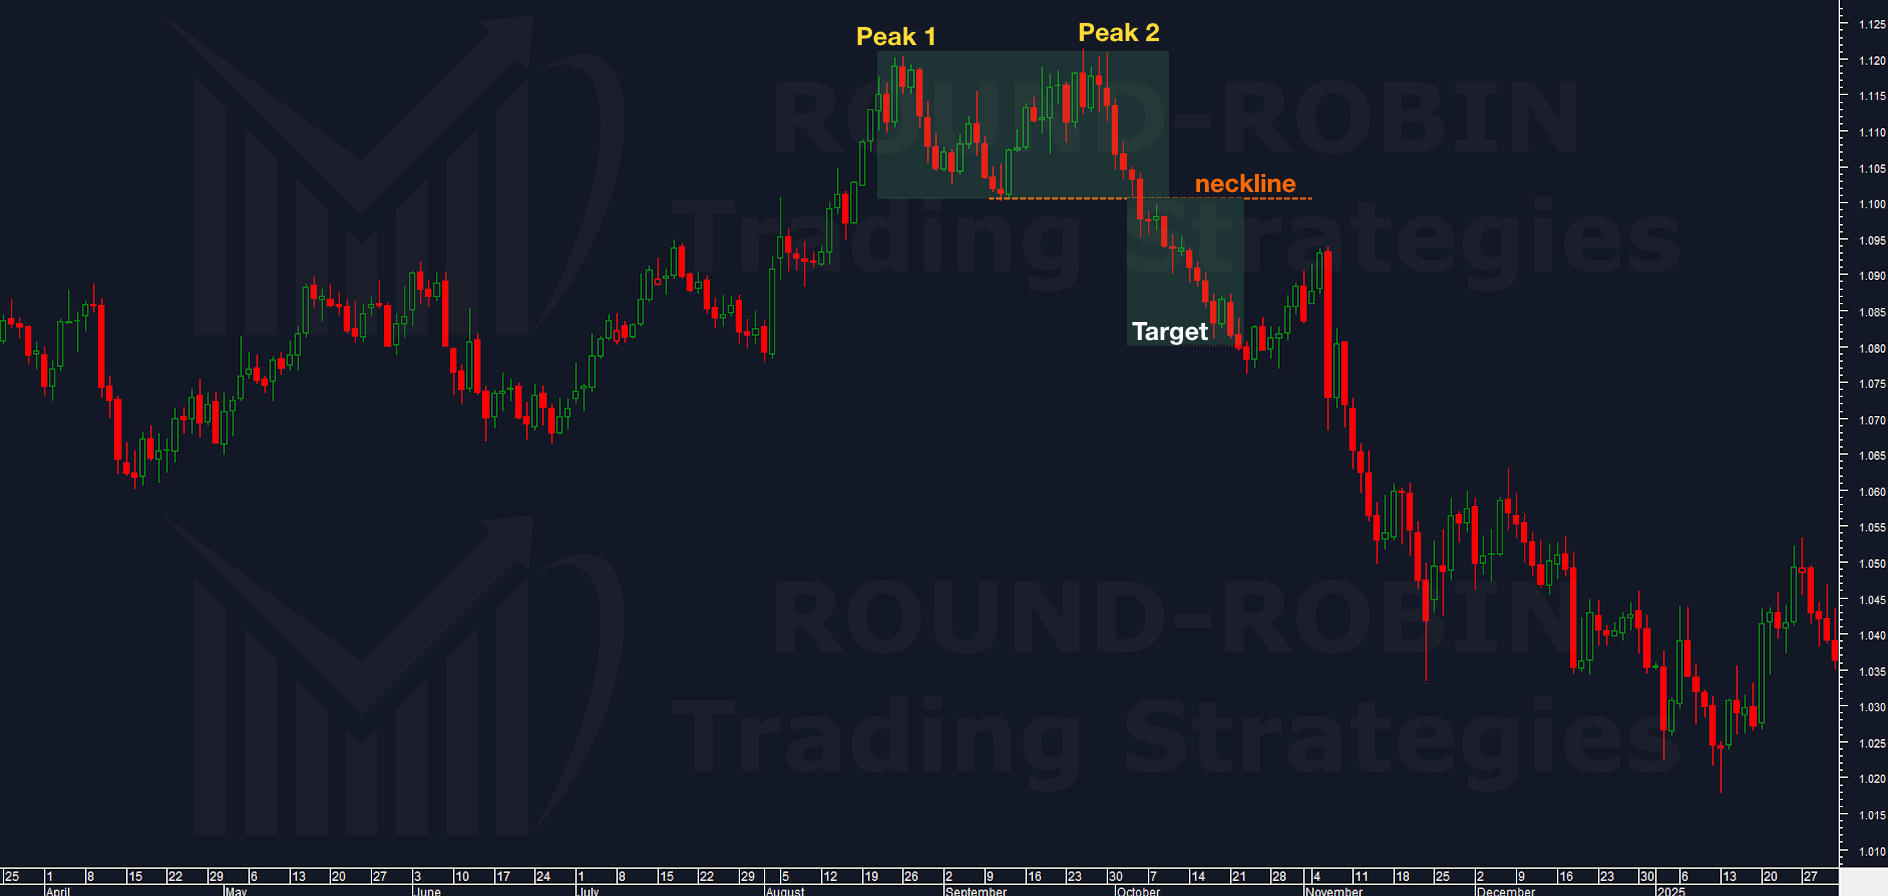
chart: EUR/USD Double Top spotted<
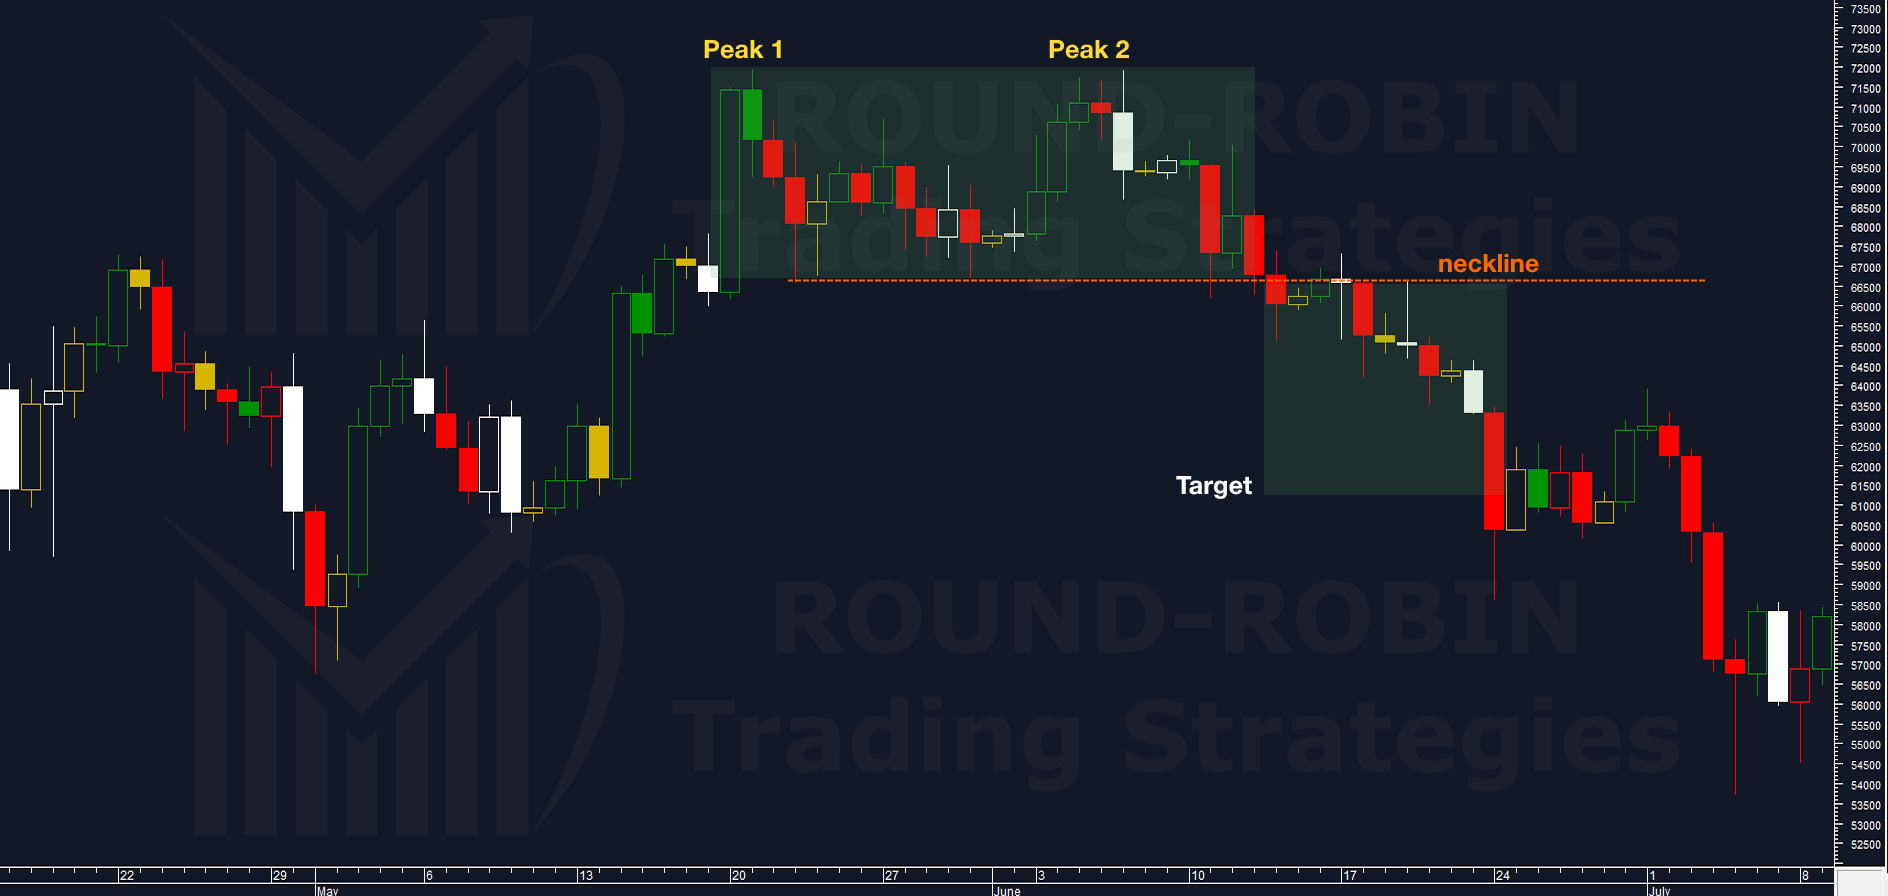
chart: Bitcoin (BTC/USD) Double Top Spotted
On Which Timeframes?
All of them, but you must not make the mistake of confusing and mixing timeframes.
Practical example: I have a short-term bearish bias, I see a double top on the 15-minute that reaches target. I stay in because it’s validating my short-term view, and a few hours later it’s back at break-even or worse, in loss. The 15-minute has almost zero probability of supporting a bias that extends beyond the trading session.
And When Doesn’t It Work?
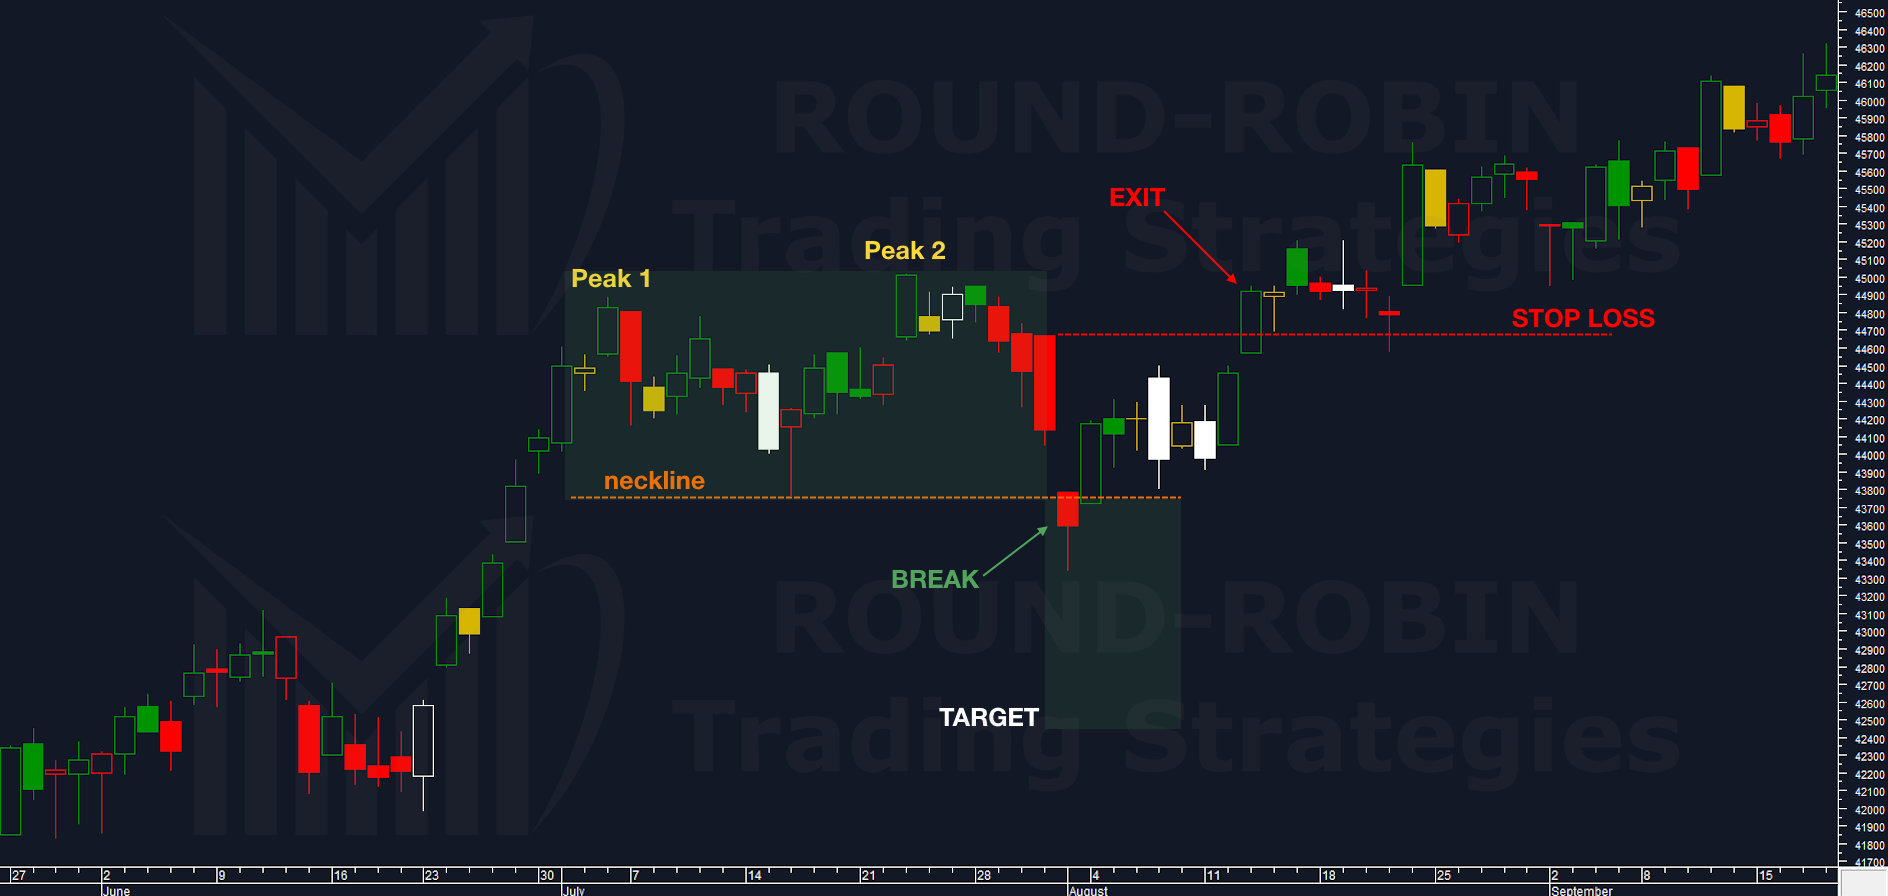
chart: Dow Jones – Double Top Failure
Obviously, there are also cases where it doesn’t work, like this one on the Dow Jones daily. In these cases, money management makes the difference between a losing trade and a disastrous position. The stop loss prevented the worst.
The Real Statistics
If you read somewhere that this pattern has a 70% probability of success, it’s either wrong or deliberately falsified data.
Success rates – meaning target achievement when operating with a rigid setup (close below neckline and predetermined percentage stop loss) on major indices daily charts – settle around 55%.
Conclusion
A 55% win rate on major daily indices means one simple thing: by itself, it’s not enough. You need context, you need discipline, you need money management. And above all, you need to know when what looks like a double top is actually just market noise preceding a new rally.
The double top is not a magic formula, but a market reading framework that works when correctly identified on the right timeframe, confirmed by neckline breakout, and managed with a rigorous stop loss.
Leave a Reply