


Weekly tracking of Italy’s benchmark index. Why we do this? Check our strategy page.
My proprietary DBBT indicator identifies misalignments between current price and expected technical level across major indices. Each week, we put the FTSE MIB in our crosshairs.
The hunt is open.
The Big Picture
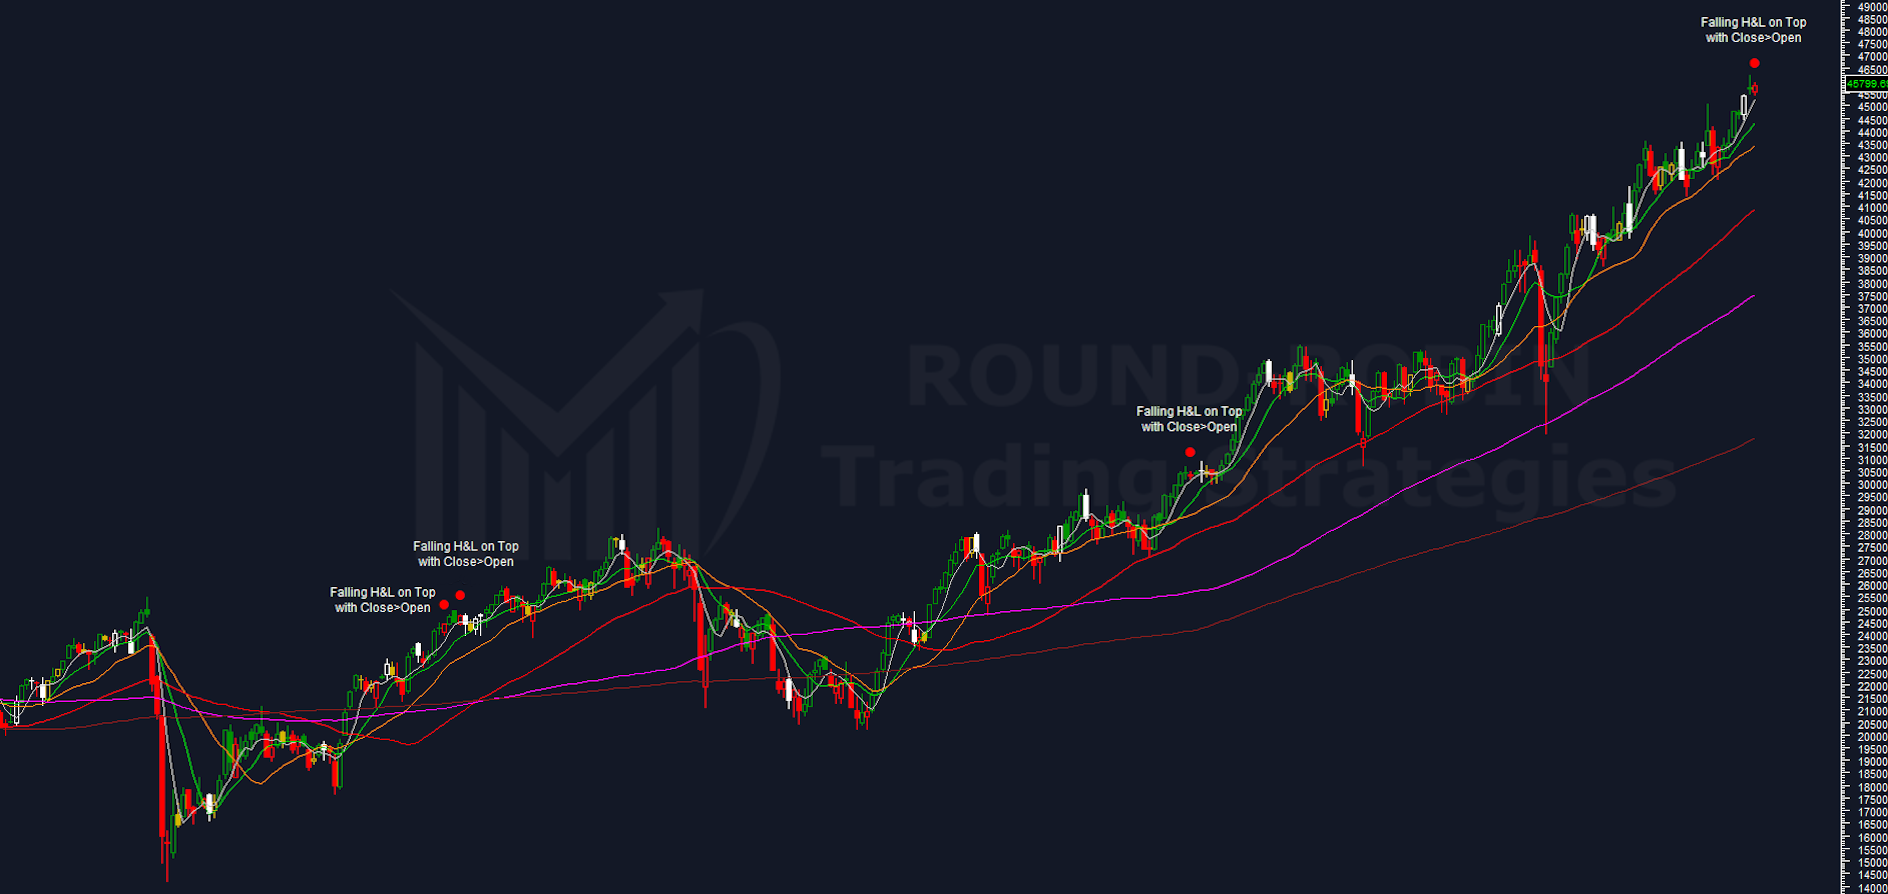
A quiet week for the FTSE MIB, which technically sits at the same level as the previous week.
The doji we highlighted in the previous episode caused nothing, in line with my analysis. Intraweek, prices dipped below the 45,400 level we flagged — the weekly low was 45,378.08 — but Friday’s close did not confirm the breakdown.
All moving averages remain rising and perfectly aligned by the textbook:
price sits above MA5W (white) > MA10W (green) > MA20W (orange) > MA50W (red) > MA100W (purple) > MA200W (amaranth).
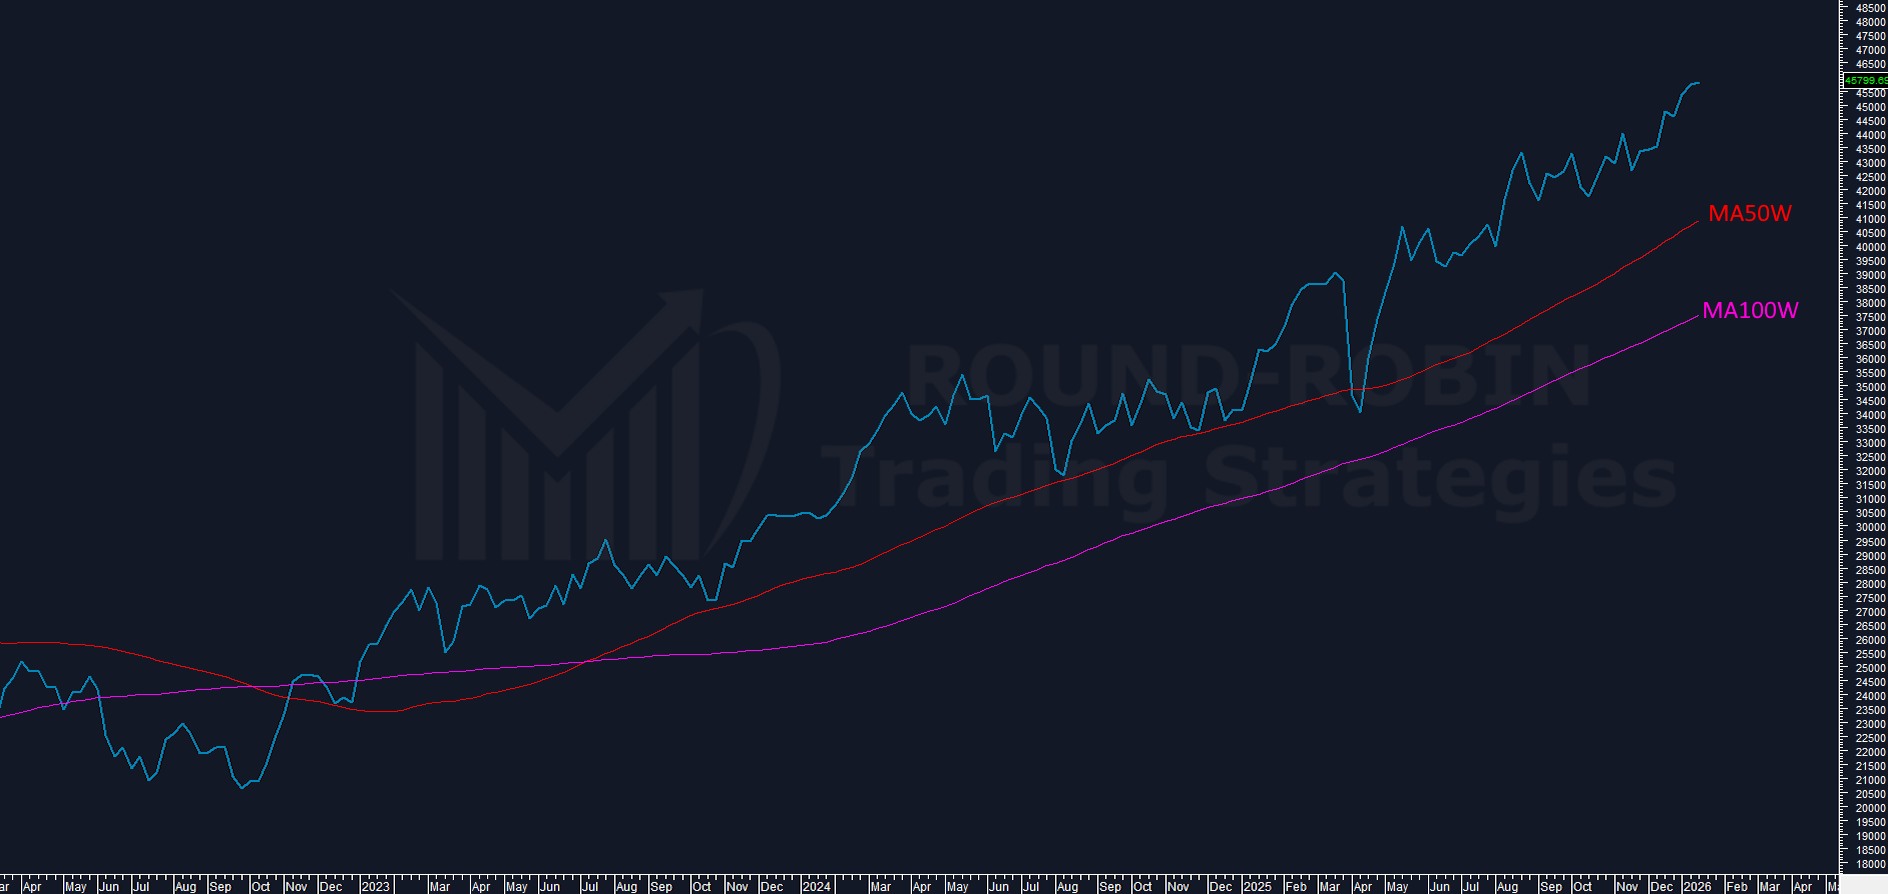
The only moving averages that seem relevant right now are the MA50W and MA100W, but they sit at a vast distance. All the others, since 2023, have never given clear reversal signals at their crossings.
The sole negative element, from a strictly mathematical standpoint: the formation of lower highs and lower lows. This week’s high (45,926.36) is below the previous one (46,193.75), as is the low (45,378.08 vs 45,419.75). In a low-volatility context, this doesn’t carry much weight — but it exists.
This minor negativity is technically cancelled by the hollow candle body: the close at 45,799.69 is above the open at 45,547.05.
Is that really enough to erase a hint of negativity?
Yes, statistically speaking. In recent years, every time the market printed a medium-to-long-term high and the following week produced lower highs and lower lows but with a close above the open, no reversal occurred. It doesn’t mean it can’t happen. It means betting that this time will be different is not statistically sound.
Bullish Overextensions
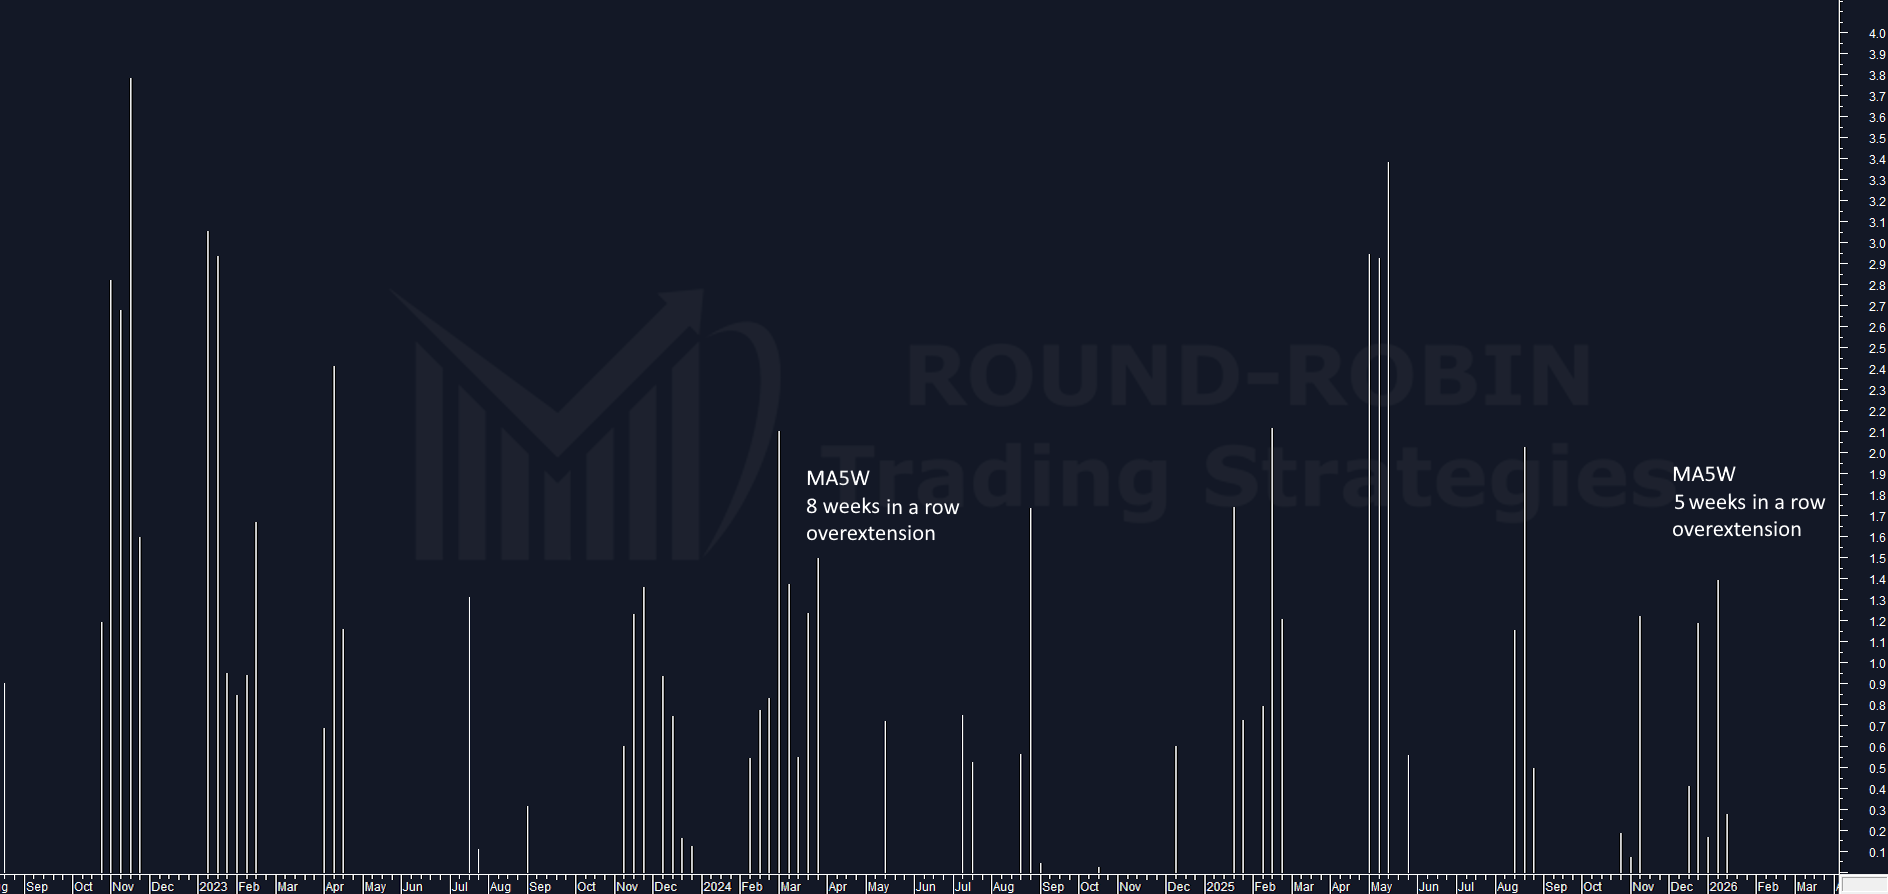
This is the fifth consecutive week with prices completely detached from the MA5W. Not by much — +1.40% last week, only +0.28% this week. But it’s still five weeks. The last time a streak lasted longer was March 2024, when it ended after eight weeks.
A simple simulation suggests that price stability in the coming week could be enough for the moving average to reach its floor, absorbing the extension without prices moving away from the highs.
For now, it’s highly unlikely we can extract a signal from this.
Weekly Range %
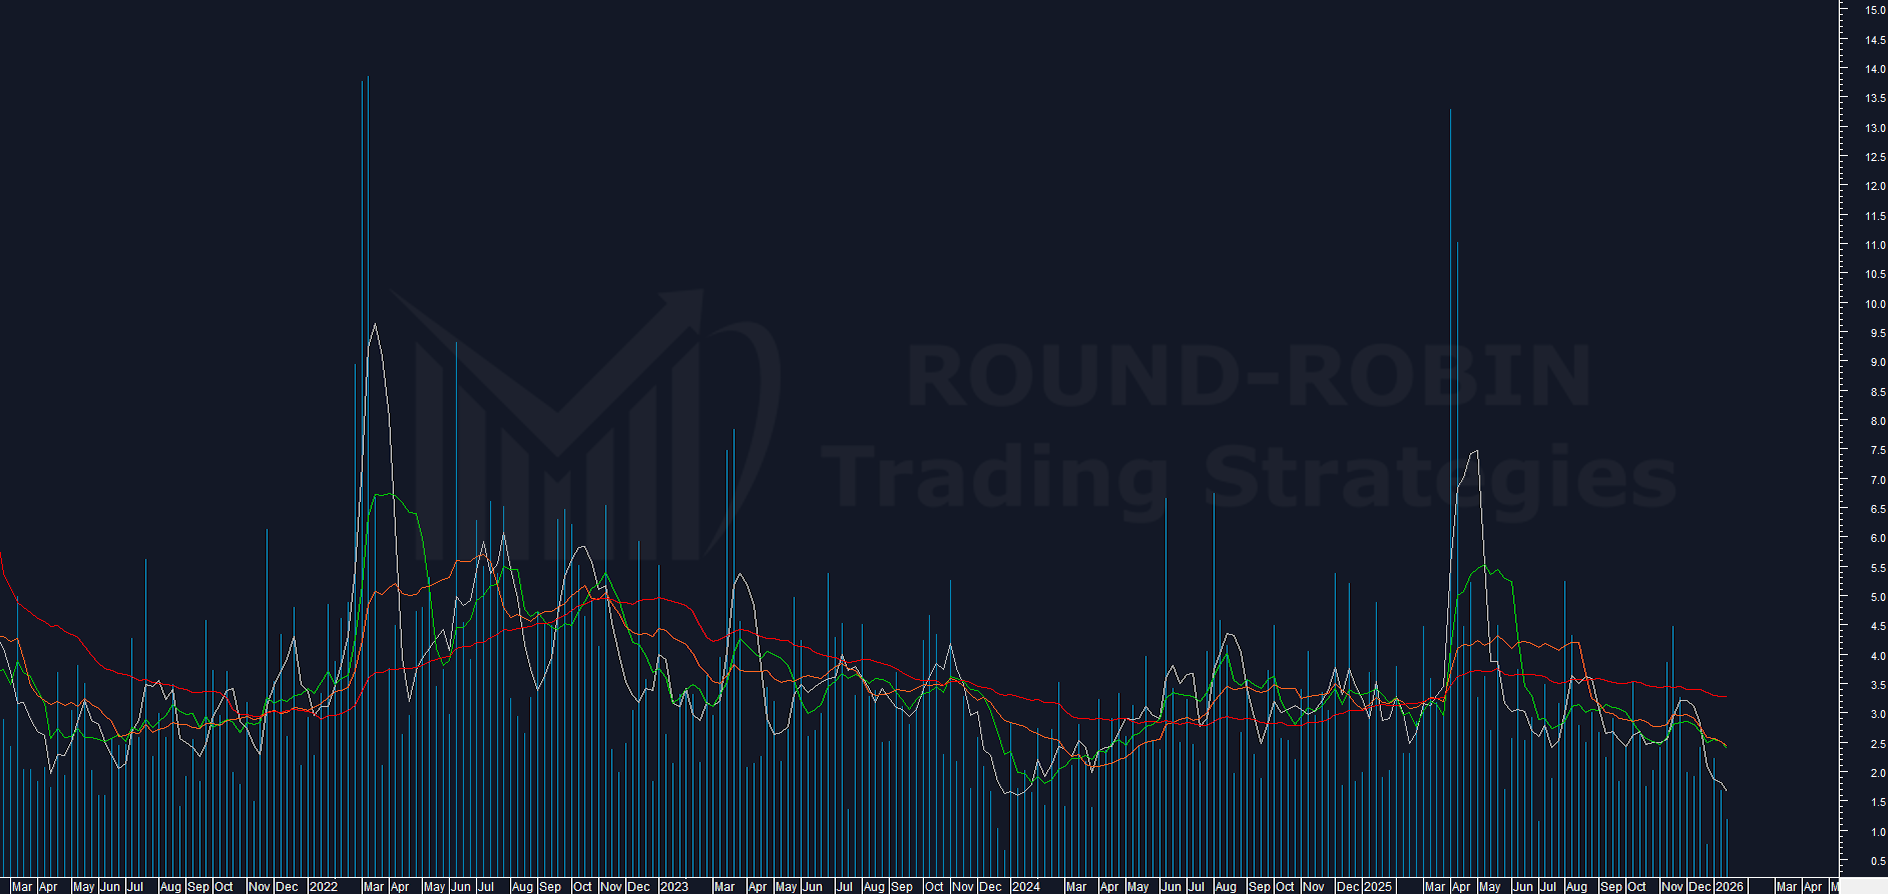
The weekly range keeps shrinking: this week it came in at 1.21%, the lowest since the week of July 4, 2025 (excluding the short Christmas week). To find values this low, you have to go back to December 2023, when the accumulation phase that kicked off the multi-year rally came to an end.
Could a distribution phase with the same characteristics be underway? Yes, but the volatility element is missing. Typically, at the end of distribution, a first meaningful correction occurs, followed by a substantial bounce — which can even exceed the previous high — before opening the door to the real bear move.
All theory for now. The numbers say to watch the compression; the trend will likely be identified in the coming weeks.
The 5-week moving average calculated on the indicator is now at a floor level that is about to demand a bounce — meaning a significant increase in the weekly range.
Converging elements?
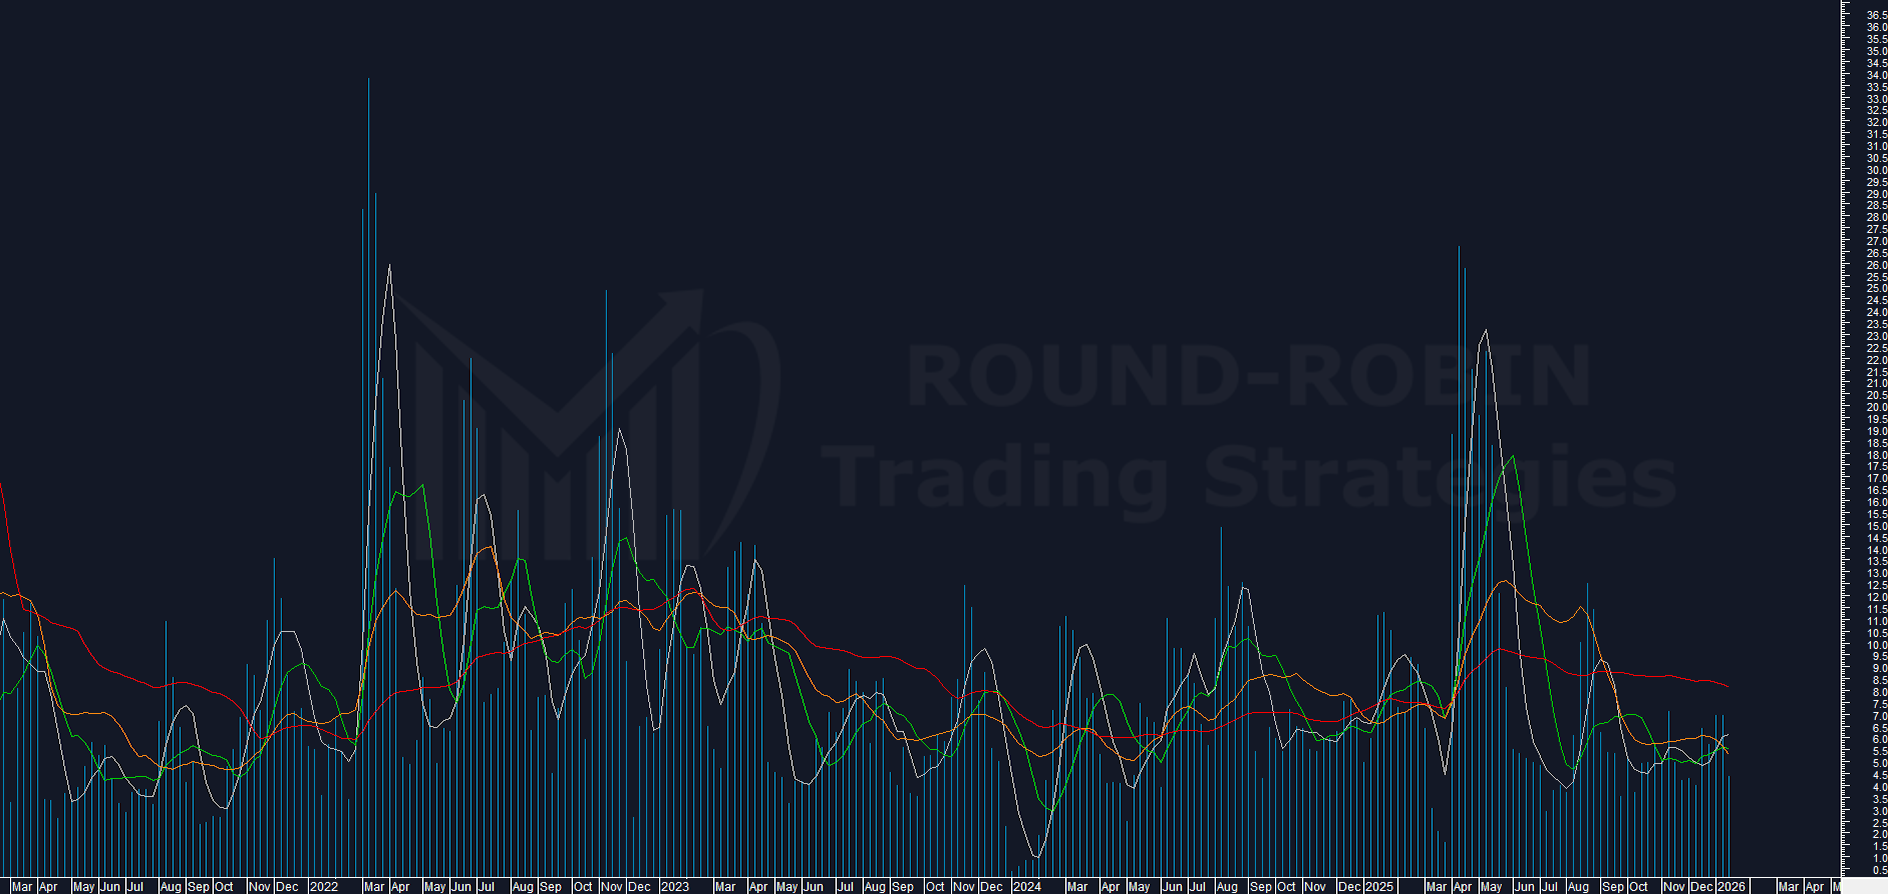
There’s something. Volatility is declining, as my proprietary indicator shows: price oscillation for the week stands at 4.41%, an interesting level.
However, it’s not yet supported by a drop into the sensitive zone of the moving averages calculated on the indicator itself.
We don’t have elements that can give us clear information on the trend. But we have a clue: the volatility compression we’re witnessing could trigger a move of meaningful size, proportional to the compression itself — the more it compresses from here, the larger the move.
The timeline shouldn’t extend beyond 3-4 weeks, ahead of the technical expiration on February 20.
From a strategic standpoint
It’s time to start considering options strategies that buy volatility: long straddle, long strangle, long iron condor, depending on your money management and risk appetite. Staggered entries are worth considering, because entering too early means losing theta — the time value that options lose with each passing day — reducing the odds of success.
Leave a Reply