


This week, Silver deserves our attention and that of half the planet.
To talk about Silver, I believe the right approach is to step back from the chart to admire it from a distance, a long distance.
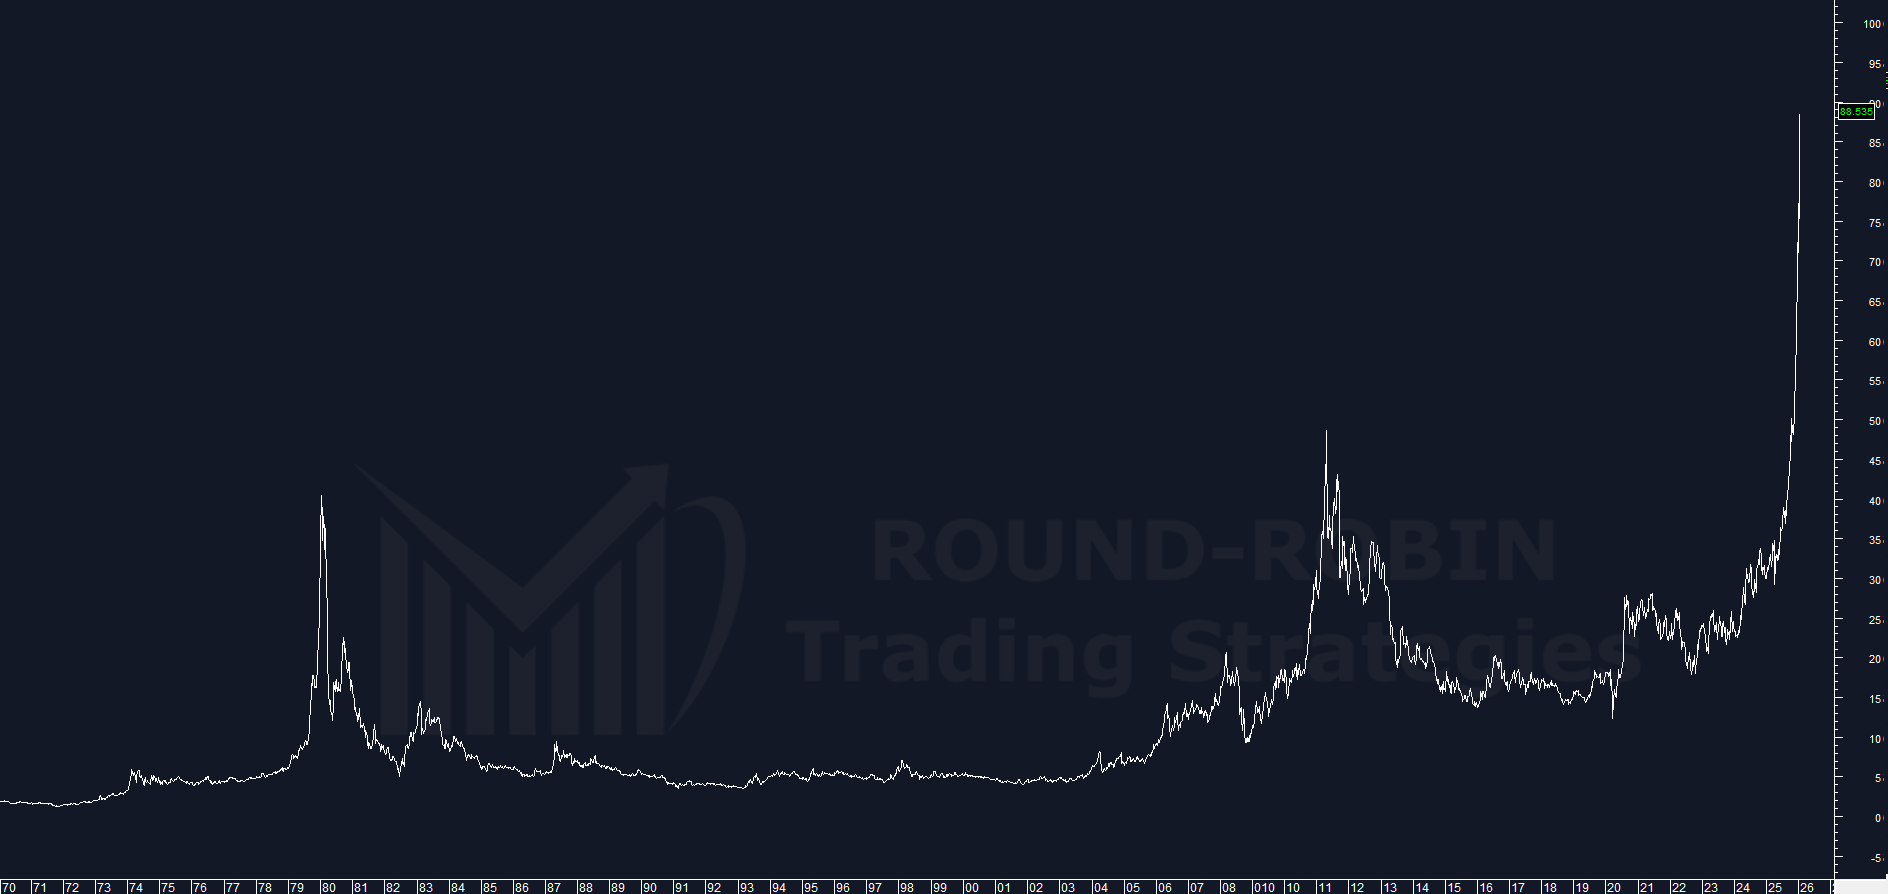
chart: Silver eod chart 1970-2026
This is the chart of weekly closes from 1970 to today… too far back?
Perhaps, but let me explain why.
When I see something extraordinary (and Silver’s exponential rally is exactly that) I ask myself:
- Has this happened before?
- And if so, what happened next?
Three Epic Rallies
Rounding the numbers (since we only need an order of magnitude):
January 1979 – January 1980: from $6 (area) to $40 (area) = 6-7x in 12 months
December 2008 – April 2011: from $9 (area) to $49 (area) = 5x in 28 months
October 2022 – January 2026 (ongoing): from $20 (area) to $89 (area) = 4x in 36 months
Note: there are many other 2x-3x cases but for this analysis the tail events of the distribution are sufficient, namely those movements that lie beyond 2-3 standard deviations from the mean.
The Duration Anomaly
What can we deduce? The magnitude of the move is still quite far from the 6x achieved in 1980 (which would mean reaching at least $120 for the current move), but the duration is a record.
We have the clue we needed: the duration is an anomaly.
Moving Average Extensions
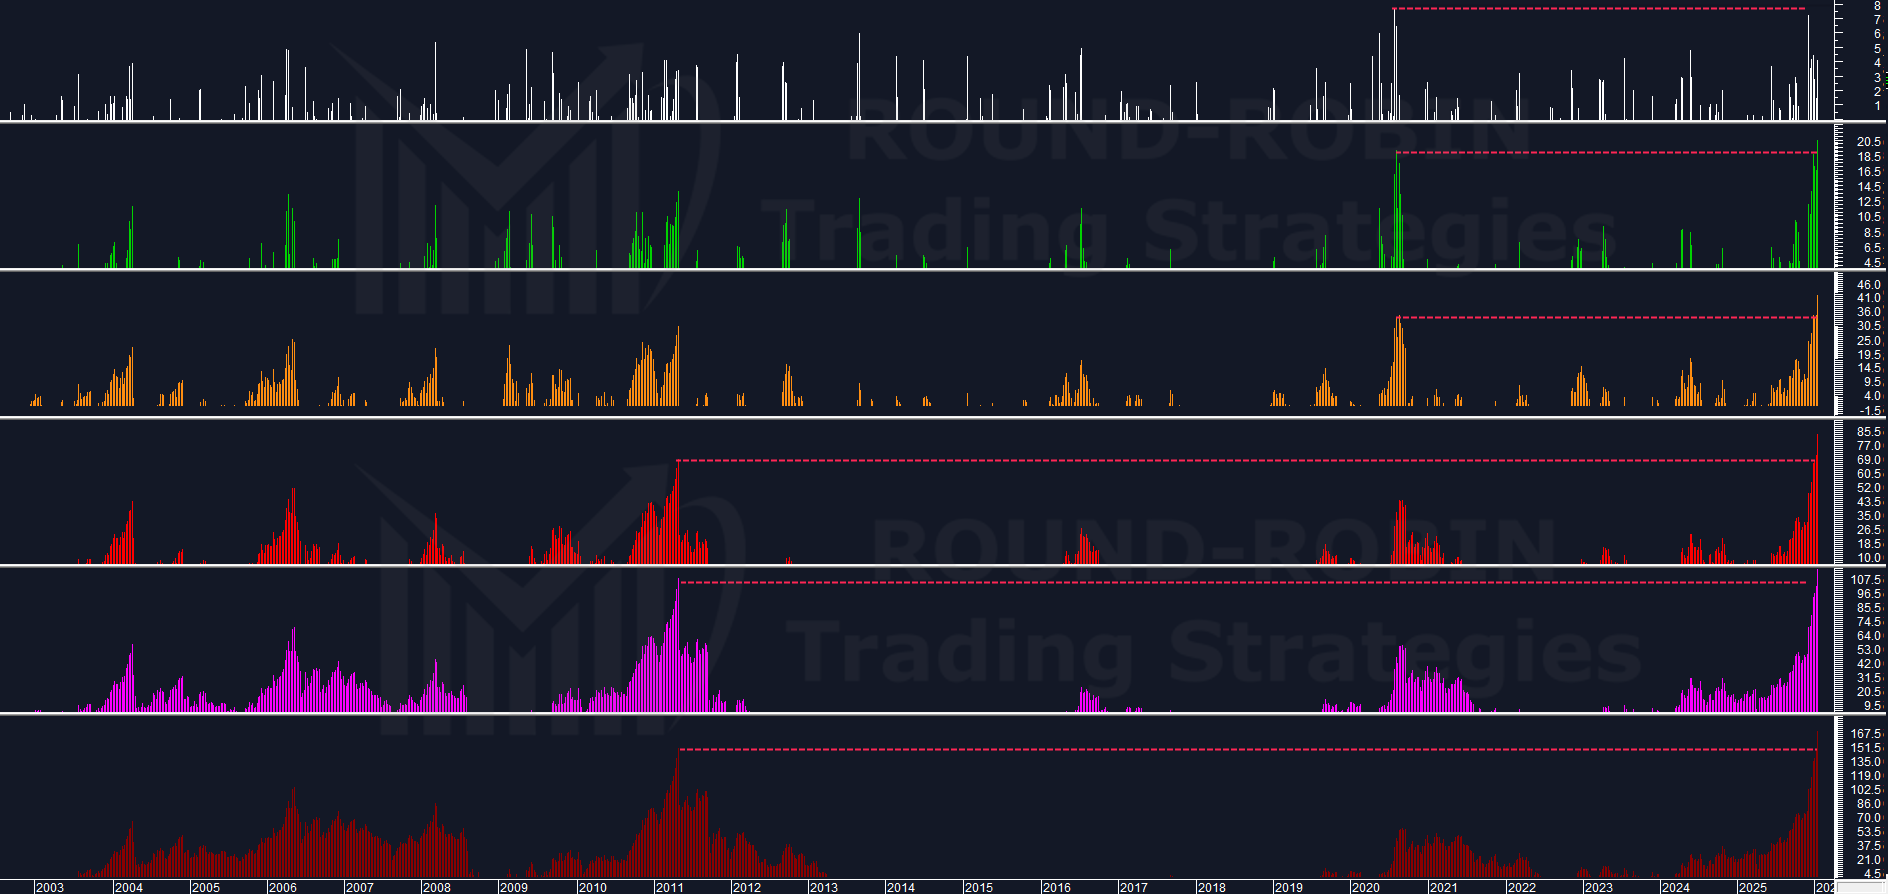
chart: Silver Moving Averages Weekly Overextensions
The simplest way to measure the anomaly is to check the positioning of prices relative to moving averages. Have prices overextended excessively compared to the past?
If we compare them to 1979-80, only infinity is the limit, but if we do more targeted work we see that:
Fast moving averages (MA5W, MA10W, MA20W): extensions have exceeded the max of the COVID rally. This means the move has been not only extended but very rapid… too rapid.
Slow moving averages (MA50W, MA100W, MA200W): have reached and exceeded those recorded in 2011.
What Happened in the Past?
To understand if these levels represent a limit, we need to look at history.
2020
When the fast moving averages reached these levels, the MA5W was reached with consolidation, but the MA20W was reached with a descent featuring lower highs and lower lows, which then foreshadowed deeper declines until reaching the slower moving averages and canceling out the bullish move.
2011
For extensions on the slow moving averages, there was a sudden vertical selloff that only reached the MA20W — this was sufficient to end the bullish phase. The subsequent bounce led to a lower relative high. From there came the deeper correction that virtually wiped out the entire rally.
1979-80
That one was also completely reabsorbed. It was much more extended, yes, with more significant excesses, yes… but everything was given back.
Will this time be different?
We should think NO, without the presumption of being 100% certain.
Additional Confirmations: The ADX
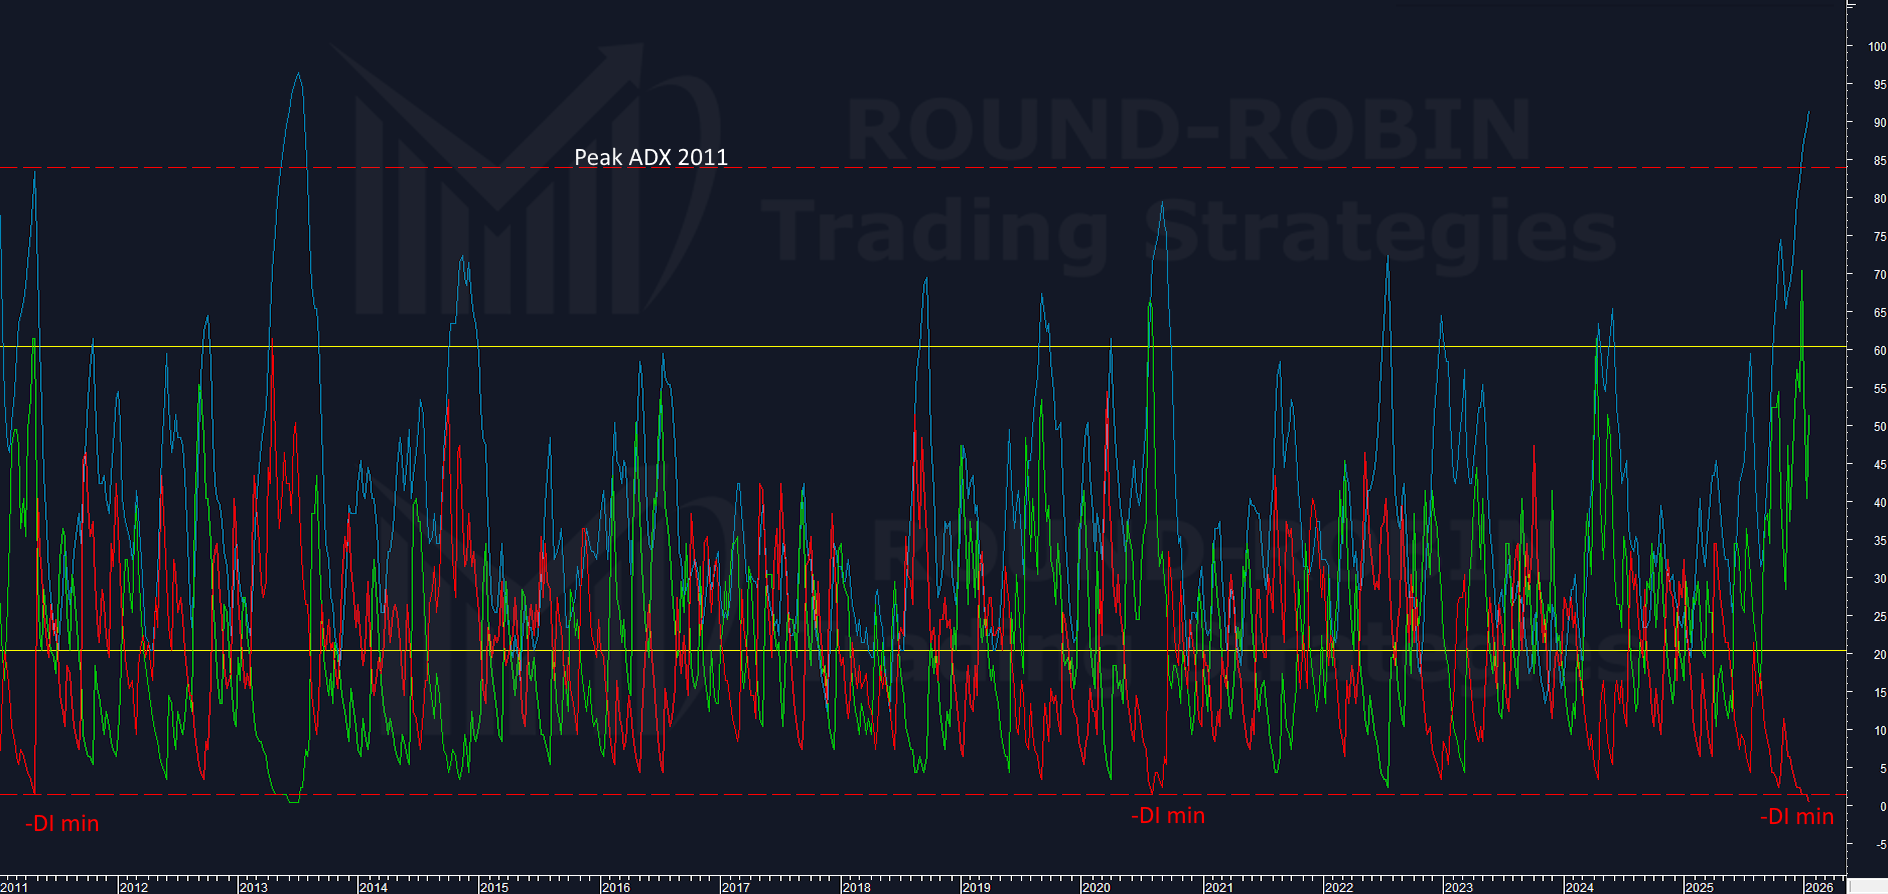
chart: Silver ADX weekly
Are there other elements? Yes, but there’s no need to dig deep: we’re facing a blatant excess.
My proprietary indicators are aligned and in agreement that a correction is imminent, but let’s look at something more traditional.
The ADX clearly shows us that the -DI is at its minimum just like in 2011 and in 2020. The ADX is not only above the attention level of 60 but has practically extended to limits that the bull market has never touched, not even in 1979-80.
What These Numbers Tell Us
Is everything about to crash? No.
Is it about to correct? Very probably YES and it should be imminent.
But statistically the first correction won’t be the one that eats up the entire bullish move. The one that will reclaim the entire rally should be the correction that starts after the first lower relative high.
Trading Strategies
Risk appetite and individual aggressiveness determine the strategy. On paper, this is the ideal situation for short call OTM, but in markets in full bubble mode it’s never my preferred solution because it exposes to uncontrolled losses from the start.
Long Put at the money could be a rewarding approach with a controlled loss.
Timing
At the moment there are no signals on the weekly, we “only” have excesses that this week have reached sensitive levels that justify a bearish intervention.
Two possible approaches:
Anticipate: open positions with reduced exposure, accepting the risk of premature timing.
Wait: wait for what has always triggered the correction — a weekly candle with lower highs and lower lows.
The weekly reversal candle has often been large in size and waiting for it could mean missing a considerable chunk of the first correction. If this were the case, I see no advantage in entering when the event occurs: I would rather wait for the next relative high to take medium/long-term bear positions, when the risk/reward becomes favorable again.
Conclusion
Fifty years of data.
Three epic rallies.
Historical excesses reached.
This is what we know — the rest is risk management.
The analyses published have educational purposes and method sharing. They do not constitute financial advice nor investment solicitation.
Leave a Reply