


Pattern Decoded is our Monday format where we cover the most well-known patterns in technical analysis. This week we talk about Gaps—the unfilled intervals on a price chart where no trading occurs.
Let’s talk about gaps.
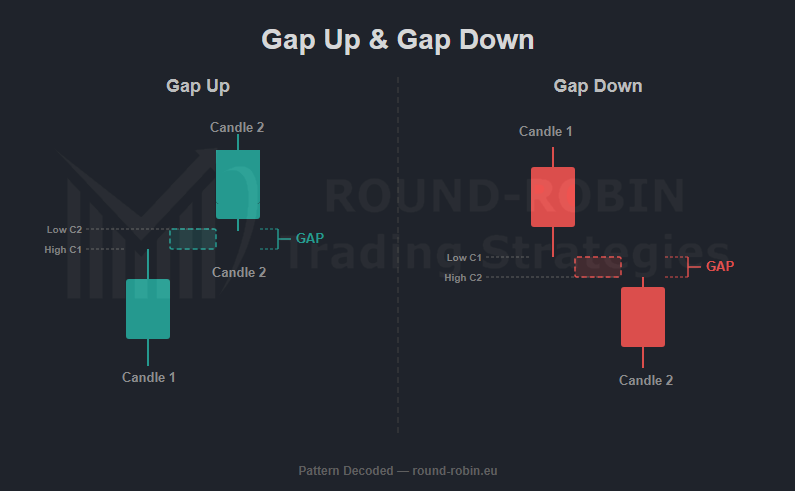
chart: Gaps
A gap is an unfilled interval on a price chart where no trading occurs. On a Japanese candlestick chart, this is interpreted as a window. It represents a moment where supply and demand became so imbalanced that price skipped an entire range.
An up gap forms when the low of the current session is higher than the high of the previous session. A down gap forms when the high of the current session is lower than the low of the previous session. The direction of the gap is independent of the trend—gaps can occur in uptrends, downtrends, or sideways markets.
Gaps result from extraordinary buying or selling interest, often developing while the market is closed. An earnings surprise, a macro event, a shift in sentiment overnight—these create an imbalance that the opening price must resolve.
Timeframe
Gaps can form on daily, weekly, or monthly charts. They are considered significant when accompanied by above-average volume.
Daily charts produce gaps most frequently—every session is an opportunity. Weekly gaps require the move to happen between Friday’s close and Monday’s open. Monthly gaps, between the last day of one month and the first of the next. These are rare, and when they appear, they carry weight.
A chart with gaps appearing almost daily is typical for thinly-traded securities. Avoid reading too much into those. Similarly, intraday gaps that fill before the close are noise, not signal.
The Four Types
Not all gaps are equal. There are four categories, each with different implications for what comes next.
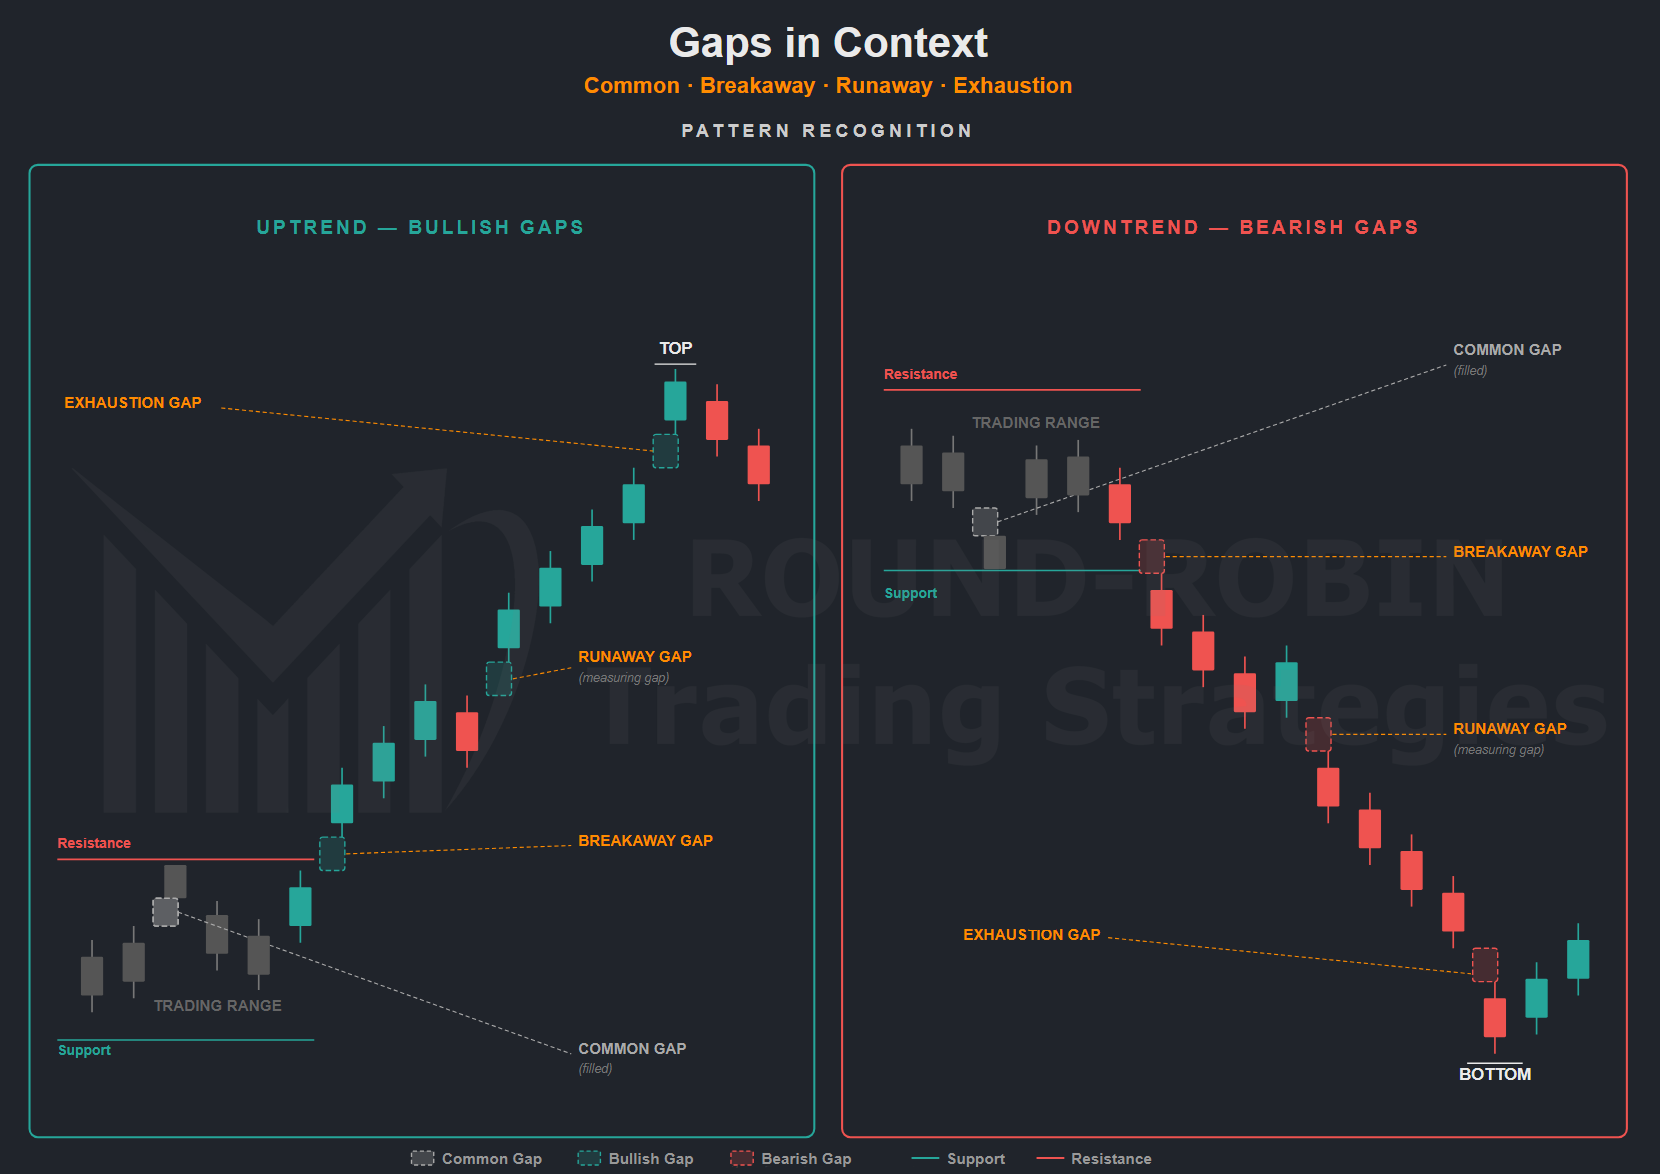
Pattern Recognition: Types of Gaps
1. Common Gap
Also known as an area gap or pattern gap. These appear during sideways trading, inside congestion areas, between support and resistance levels. They are uneventful.
Common gaps are often caused by low volume conditions—a stock going ex-dividend, a quiet session, nothing structural. They usually get filled fairly quickly. “Filled” means price retraces back into the gap area within days or weeks, closing the blank space on the chart.
Being aware of common gaps is good. Expecting trading opportunities from them is optimistic.
2. Breakaway Gap
This is where it gets interesting.
A breakaway gap occurs when prices break out from a congestion area—a trading range, a triangle, a consolidation pattern—with a gap. It signals a strong shift in sentiment and the potential for a powerful directional move.
Heavy volume after the gap suggests the gap may not be filled. The breakout point becomes the new support (upside breakout) or resistance (downside breakout). This is the market telling you: the balance has broken.
If the breakout occurs on low volume, there’s a chance the gap fills before the trend resumes. Context matters.
Breakaway gaps associated with classic chart patterns tend to be stronger. An ascending triangle with a breakaway gap to the upside is a much better setup than a gap without structure behind it.
Do not fall into the trap of expecting a breakaway gap to fill quickly. It might take a very long time. Trade the new trend, not the old range.
3. Measuring Gap (Runaway Gap)
Also called a runaway gap. This gap typically occurs midway through a rapid advance or decline, away from any congestion area. It is caused by increased interest in the stock—traders who missed the initial move and decided the retracement they were waiting for would never come.
Buying interest surges suddenly. Price gaps above the previous close. Volume increases significantly during and after the gap. This represents a near-panic state: fear of missing out on the long side, fear of holding on the short side.
In downtrends, runaway gaps represent liquidation. Holders panic and sell—but to whom? Price must continue dropping and gapping down to find buyers.
The term “measuring” comes from the theory that this gap occurs roughly halfway through the move. It can serve to estimate how much further the trend may extend. Not precise, but useful as a reference.
4. Exhaustion Gap
This gap signals the end of a rapid move. It appears near the top of an uptrend or the bottom of a downtrend and is often the first warning that the move is over.
Identified by heavy volume and a large price difference between the previous close and the new open. It can easily be mistaken for a runaway gap if you overlook the exceptionally high volume and the extended nature of the prior trend.
During a bull move, euphoria drives prices up with huge volume. Then profit-taking hits. Demand dries up. Prices drop, and a significant change in trend occurs.
During a long decline, pessimism peaks. Holders liquidate in near-panic. The exhaustion gap marks the capitulation—and is quickly filled as prices reverse.
A reversal is likely when an exhaustion gap forms at the extreme of a move. But likely is not certain.
Confirmation and Context
A gap alone is not a trading signal. It is a structural event that requires interpretation.
Additional evidence that strengthens a gap’s message:
- Volume. Above-average volume validates the gap. Low volume undermines it.
- Location. A gap at a key support, resistance, or moving average carries more weight than one in the middle of nowhere.
- Chart pattern. A gap that completes or confirms a recognizable pattern (triangle, flag, head and shoulders) is stronger than an isolated gap.
- Trend context. Where in the trend does the gap appear? Early (breakaway), middle (runaway), or late (exhaustion)?
Without context, a gap is just a blank space on a chart.
The Fill Myth
The adage that all gaps eventually get filled is dangerous if applied blindly.
Common gaps? Yes, they tend to fill. Exhaustion gaps? Often filled quickly as the trend reverses.
Breakaway and runaway gaps? Waiting for these to fill can devastate a portfolio. Waiting for prices to close a gap before joining a trend might mean missing the entire move.
Focus on the message the gap conveys about market dynamics, not on when it will fill.
Trading Implications
Gaps serve to:
- identify shifts in sentiment and momentum
- define support and resistance levels created by the gap boundaries
- measure the potential extent of a trend (measuring gap)
- signal potential trend exhaustion and reversal
Recognising the type of gap before acting is everything. A breakaway gap demands trend-following. An exhaustion gap demands caution. A common gap demands patience. A runaway gap demands respect for momentum.
Next time you see a gap on a chart, ask yourself: what type is it?
Is there volume behind it?
Where does it sit in the trend?
If you can’t answer those questions, you don’t have a trading signal.
You have a blank space that requires attention, not action.
Leave a Reply