


This week’s deep dive is dedicated to the S&P 500.
We’ve been tracking this setup since W02 — and the framework still holds.
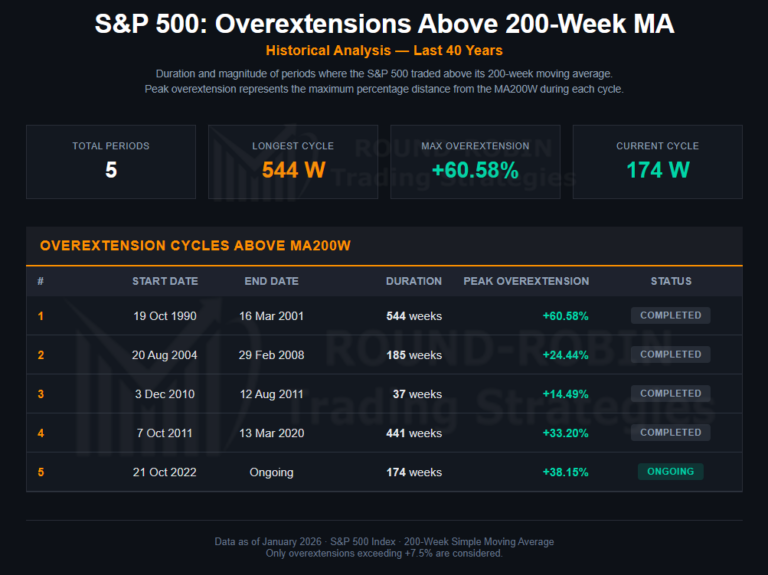
An analysis of the key technical indicators and historical patterns that guide our market reading.

This week’s deep dive is dedicated to the S&P 500.
We’ve been tracking this setup since W02 — and the framework still holds.
An analysis of the key technical indicators and historical patterns that guide our market reading.
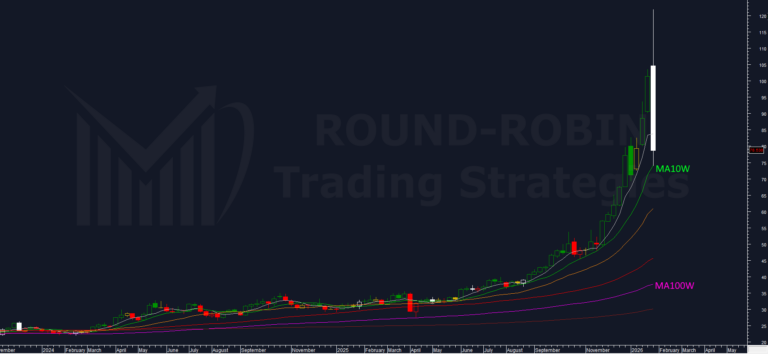
It doesn’t happen very often — a -31% day on an asset as well known as Silver. Not over a week. Not over several sessions. One day. A few hours.
This article retraces what we identified, what we proposed, and what actually happened. Not to celebrate being right. To understand the mechanics of what just occurred — and what comes next.
Chart of the Week — Week 3 2026
If you need to know what to do right now, skip to the Conclusion.
Short version: don’t touch Silver. In any direction. The rest of this article is the explanation.