


Weekly monitoring of the Italian benchmark index.
Why do we do it?
Check our strategy page.
My proprietary DBBT indicator identifies misalignments between the current price and the expected technical level on the main indices.
Every week, the FTSE MIB is in our crosshairs.
The hunt is on.
A positive week for the FTSE MIB, with a close at 50,036.75, 525.78 points (+1.06%) above the previous close.
The rise is a matter of fact. It occurred, however, within a compressed range: the weekly excursion of 927 points stands among the narrowest of 2026.
Dividends still weigh on the cash. The future, free from this effect, closes at 49,995, less than 100 points above the previous week’s close.
The break above 50,000 on the cash also needs to be put in context. The high recorded two weeks ago was already at 50,050. The formal breakout arrives on levels already touched recently, without a clean break.
The overall picture is one of a market maturing slowly. The bearish scenario still holds room, but week after week brings a small step forward on the opposite front.
The scenario outlined last week did not materialize. The system remains short.
Let’s look in detail at what the indicators are telling us.
Bulls vs Bears
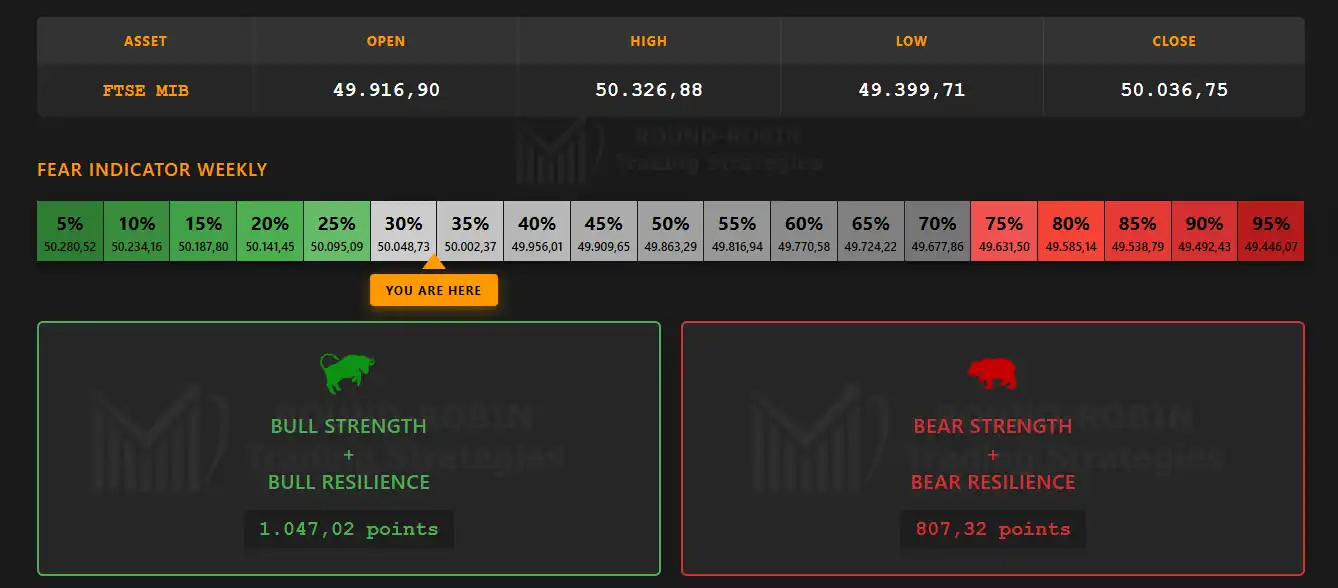
infographic: FTSE MIB weekly – Bulls vs Bears
The bulls/bears ratio stands at 1.30: the bullish component retains control of the technical picture, without expressing the marked imbalance that characterizes phases of maximum bull extension.
The Fear Indicator sits in the upper part of the green zone, close to the boundary with the neutral area. Risk hedging begins to reappear at the margins, even within a context of still-dominant complacency.
The Big Picture
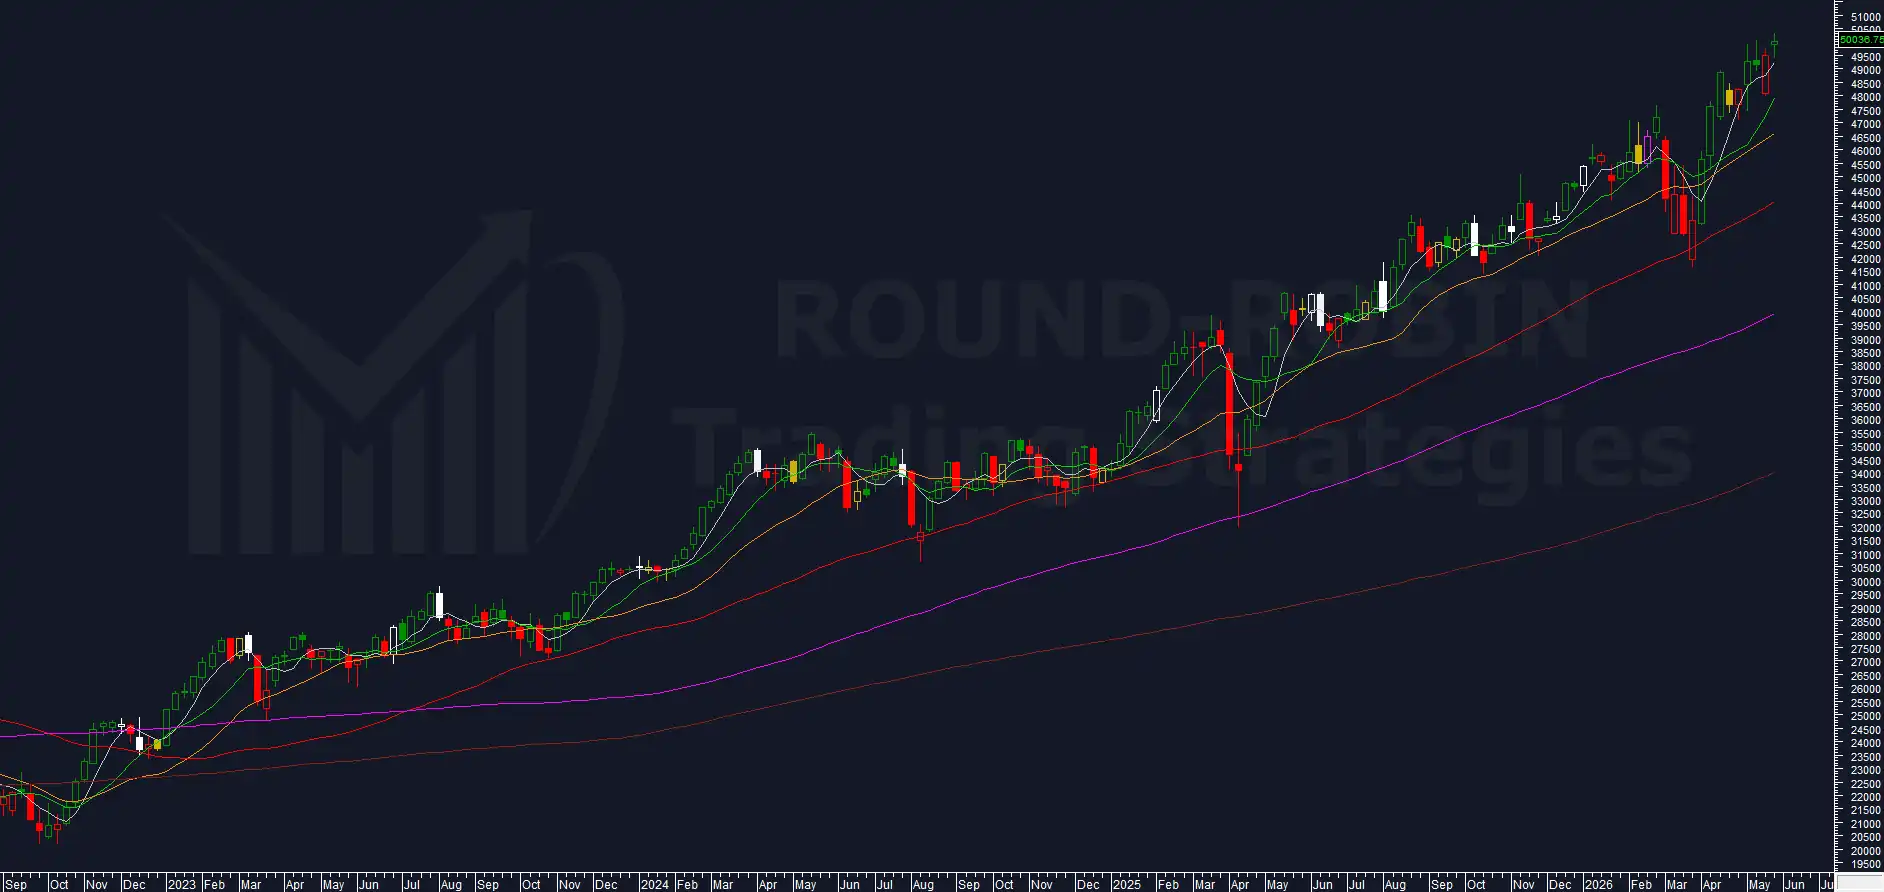
chart: FTSE MIB weekly
The FTSE MIB opened on a gap up and traced a week with higher highs and higher lows relative to the previous one. The close at 50,036.75 settled just 119.85 points away from the open at 49,916.90.
This is a technical configuration that, even within this multi-year uptrend, has historically been followed by at least two weeks of retracement.
The narrow range and the close practically in line with the open clarify nothing about the move underway. What little has been done is nevertheless enough to push prices into overextension on the MA5W.
The moving averages alignment remains confirmed. The fast ones, MA5W and MA10W, keep rising with slopes that begin to be hard to sustain.
The system remains short.
Volatility Indicator
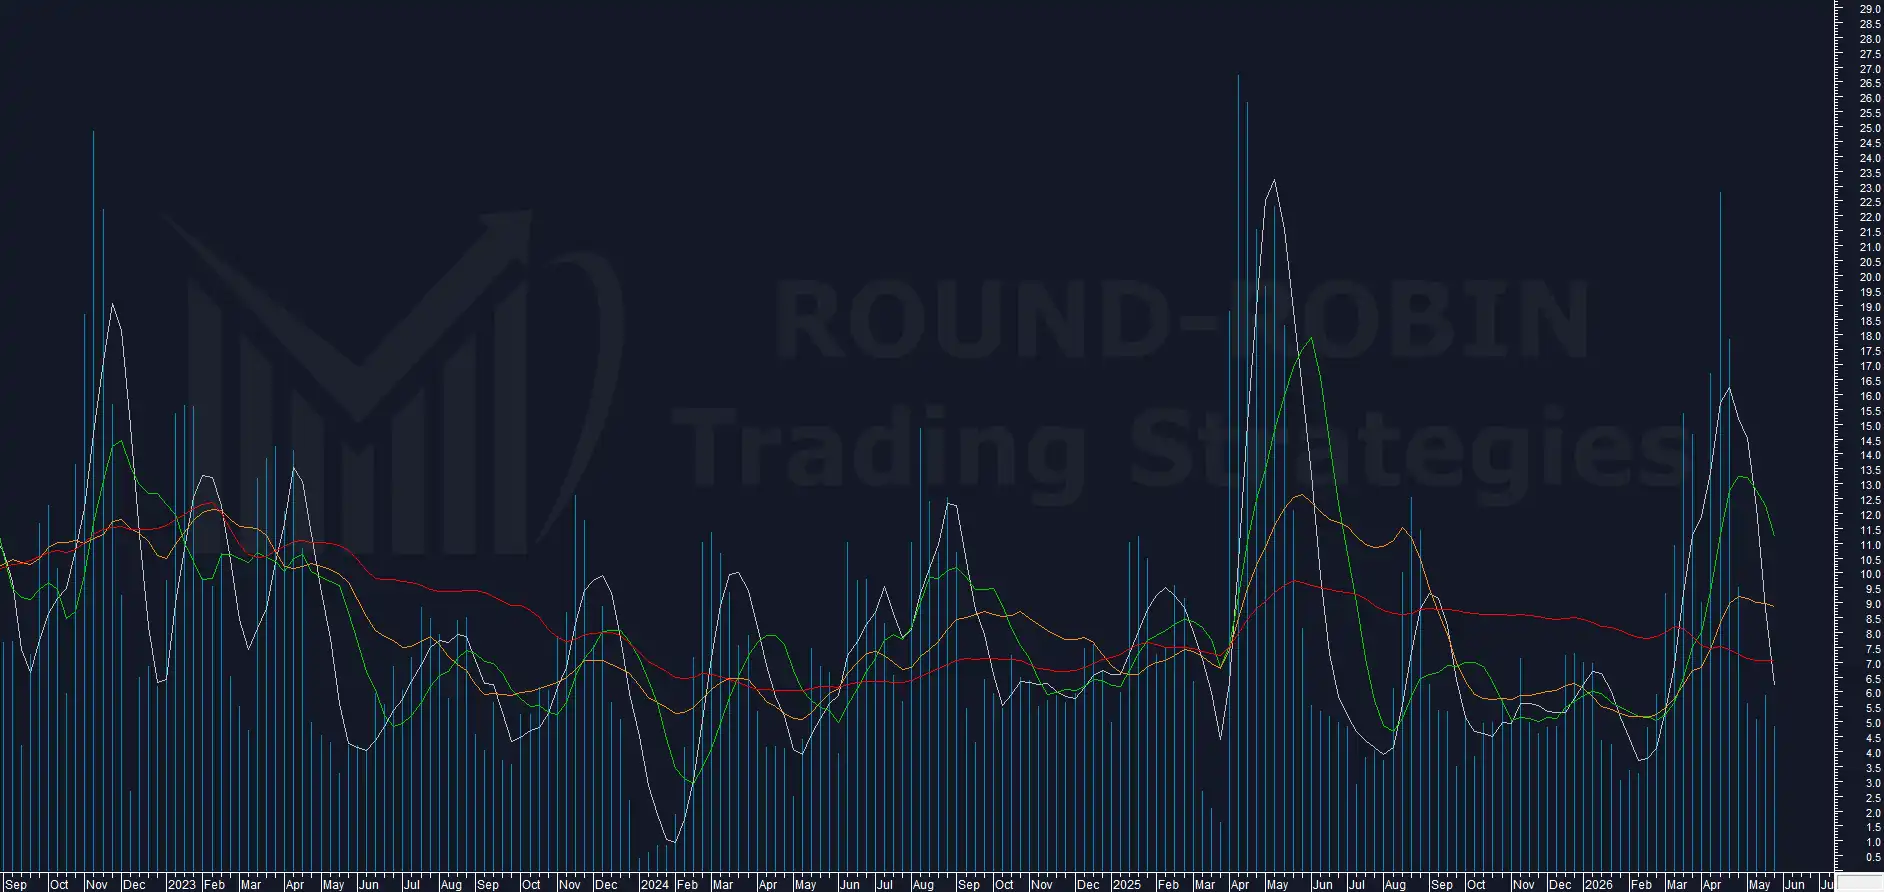
chart: FTSE MIB – proprietary Volatility Indicator
The volatility indicator moves to 4.87%. The MA5W calculated on the indicator records a vertical collapse.
The configuration mirrors a technical scenario very similar to the one observed in June 2025. In that case too the indicator’s picture converged on two weeks of retracement or pause in the uptrend.
Range Weekly %
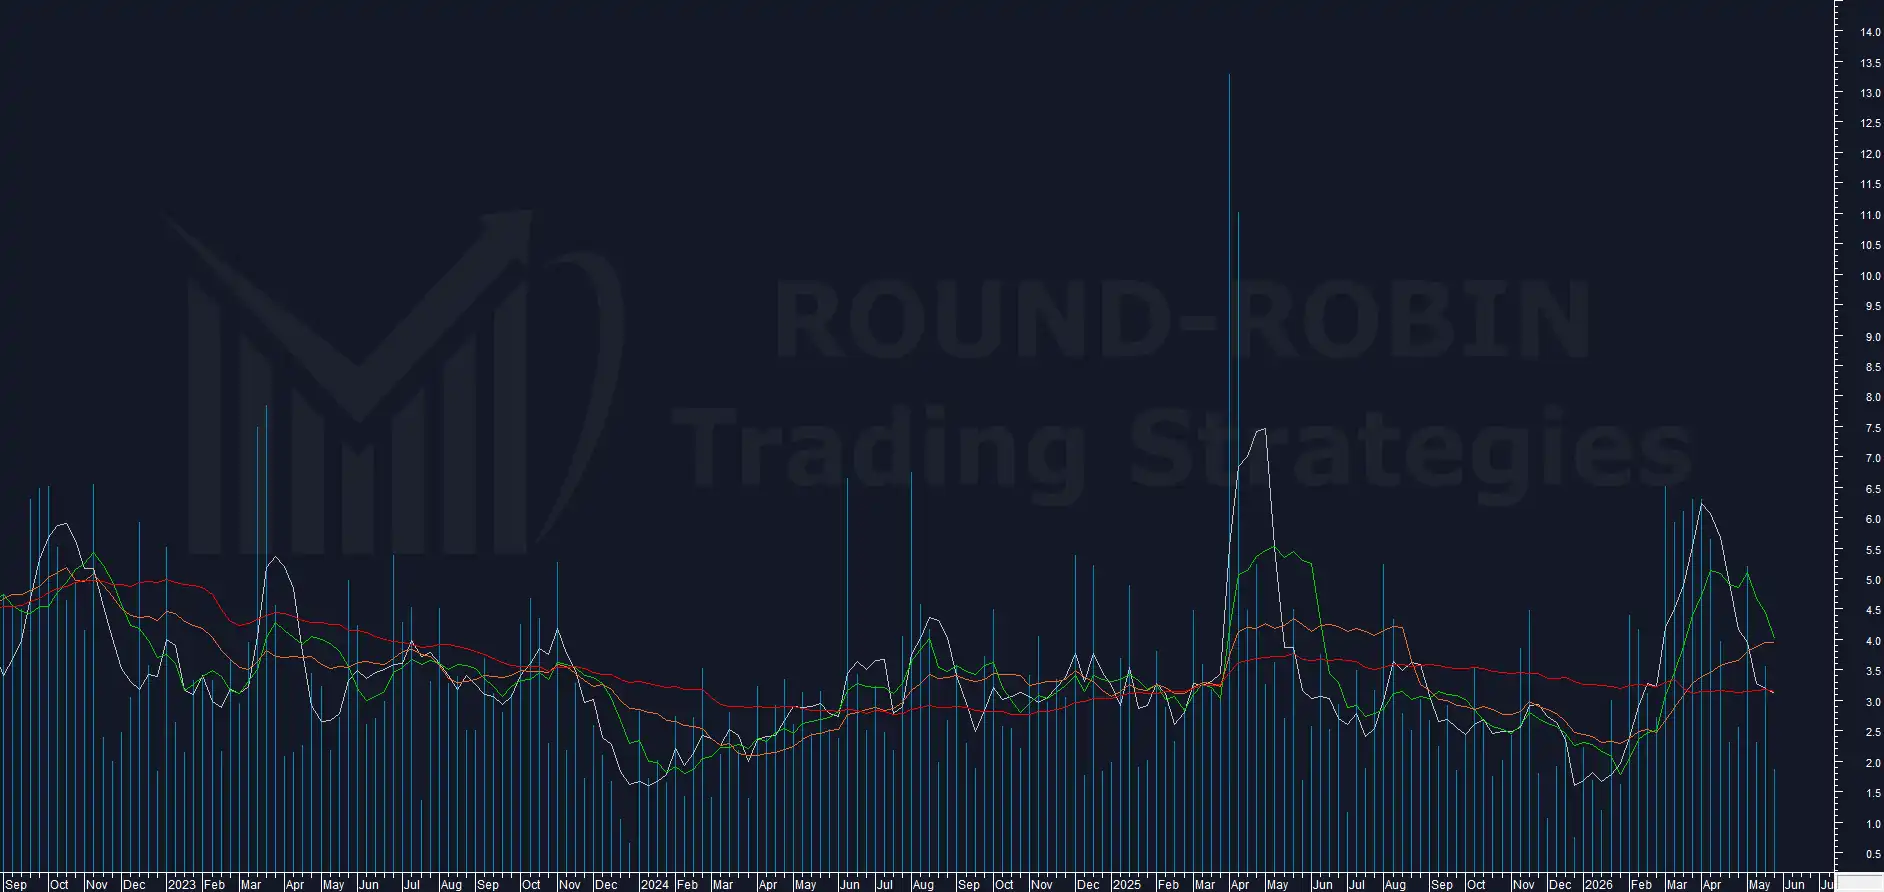
chart: FTSE MIB – range % weekly
As anticipated in the opening, the week’s range stands among the narrowest of 2026. On the indicator’s chart, the MA5W is also pointing down.
Here too the similarity with June 2025 is immediate. These are elements and moves that in the recent past have led to bearish scenarios, taking shape at minimum as a correction.
BCP3
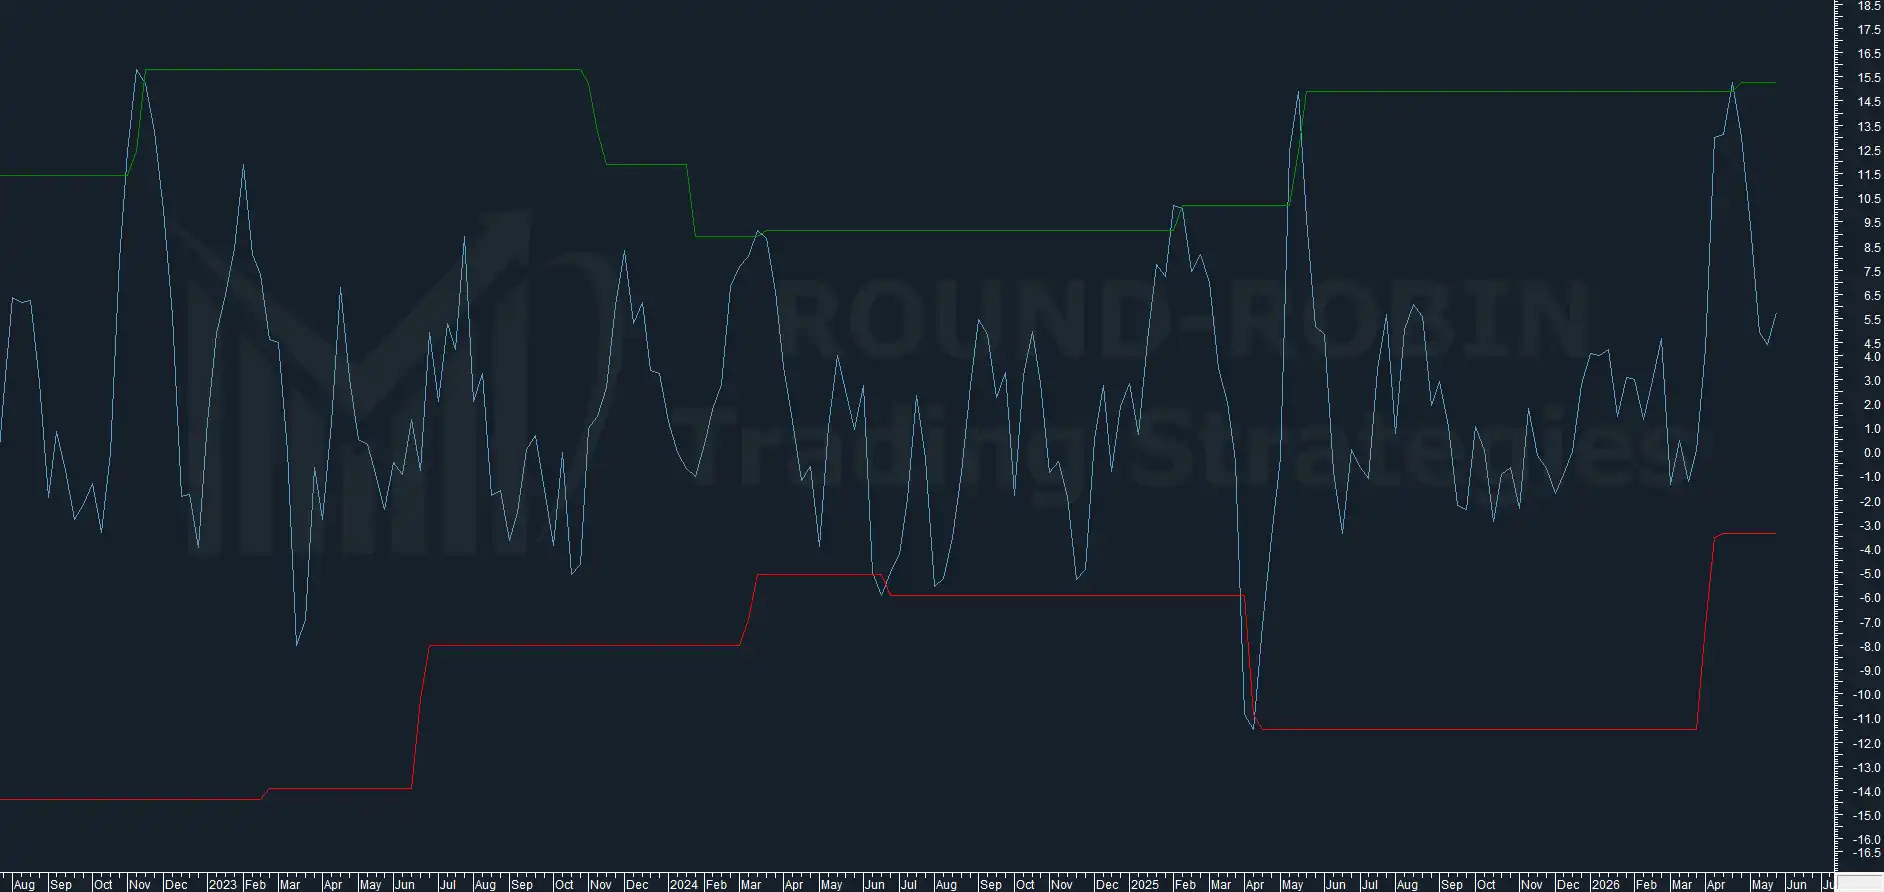
chart: FTSE MIB – BCP3 weekly
The indicator turns up after the decline of recent weeks: from 4.41% of the previous reading it moves to 5.77%. On the technical side this move represents a point in favor of the bulls.
It needs context, however. In the past ten years the indicator’s bearish swings have never stopped before falling below zero.
The reading that emerges is one of bull excess. The week just closed, out of standard relative to the indicator’s historical record, sets up a SELL opportunity.
Conclusion
Multiple indicators converge this week on the same reading. The weekly price configuration, the dynamic of the Volatility Indicator and Range Weekly %, and BCP3’s “out of standard” reversal mirror a technical scenario already seen in June 2025. On that occasion the combination of elements was followed by two weeks of retracement or pause in the uptrend.
The system remains short and the statistical picture, after weeks of progressive erosion, records a clear realignment in favor of the bearish scenario. The week just closed, out of standard relative to BCP3’s historical record, sets up a SELL opportunity on a purely statistical basis as well.
It must be said with equal clarity that the retracement scenario has been described in these pages for three consecutive weeks, and each time the market pushes it forward by seven days. The index continues its slow advance, by a few tens of points week after week.
The technical signal converges, the historical statistics converge, but price so far does not confirm.
Leave a Reply