


Quick observations on the charts that caught our eye this week.
This week’s flash covers Brent, EUROSTOXX50, DAX and Nikkei 225.
The week’s open seemed to favor the bears, but by Friday’s close the technical picture is unchanged. Bull resilience on the indices, which show technical excess but hold near the highs, building the base for the break. Brent goes the other way: after weeks of attacks on the bear zone, a first clear sign of weakness arrives.
Let’s go a bit more into detail.
⚡ BRENT
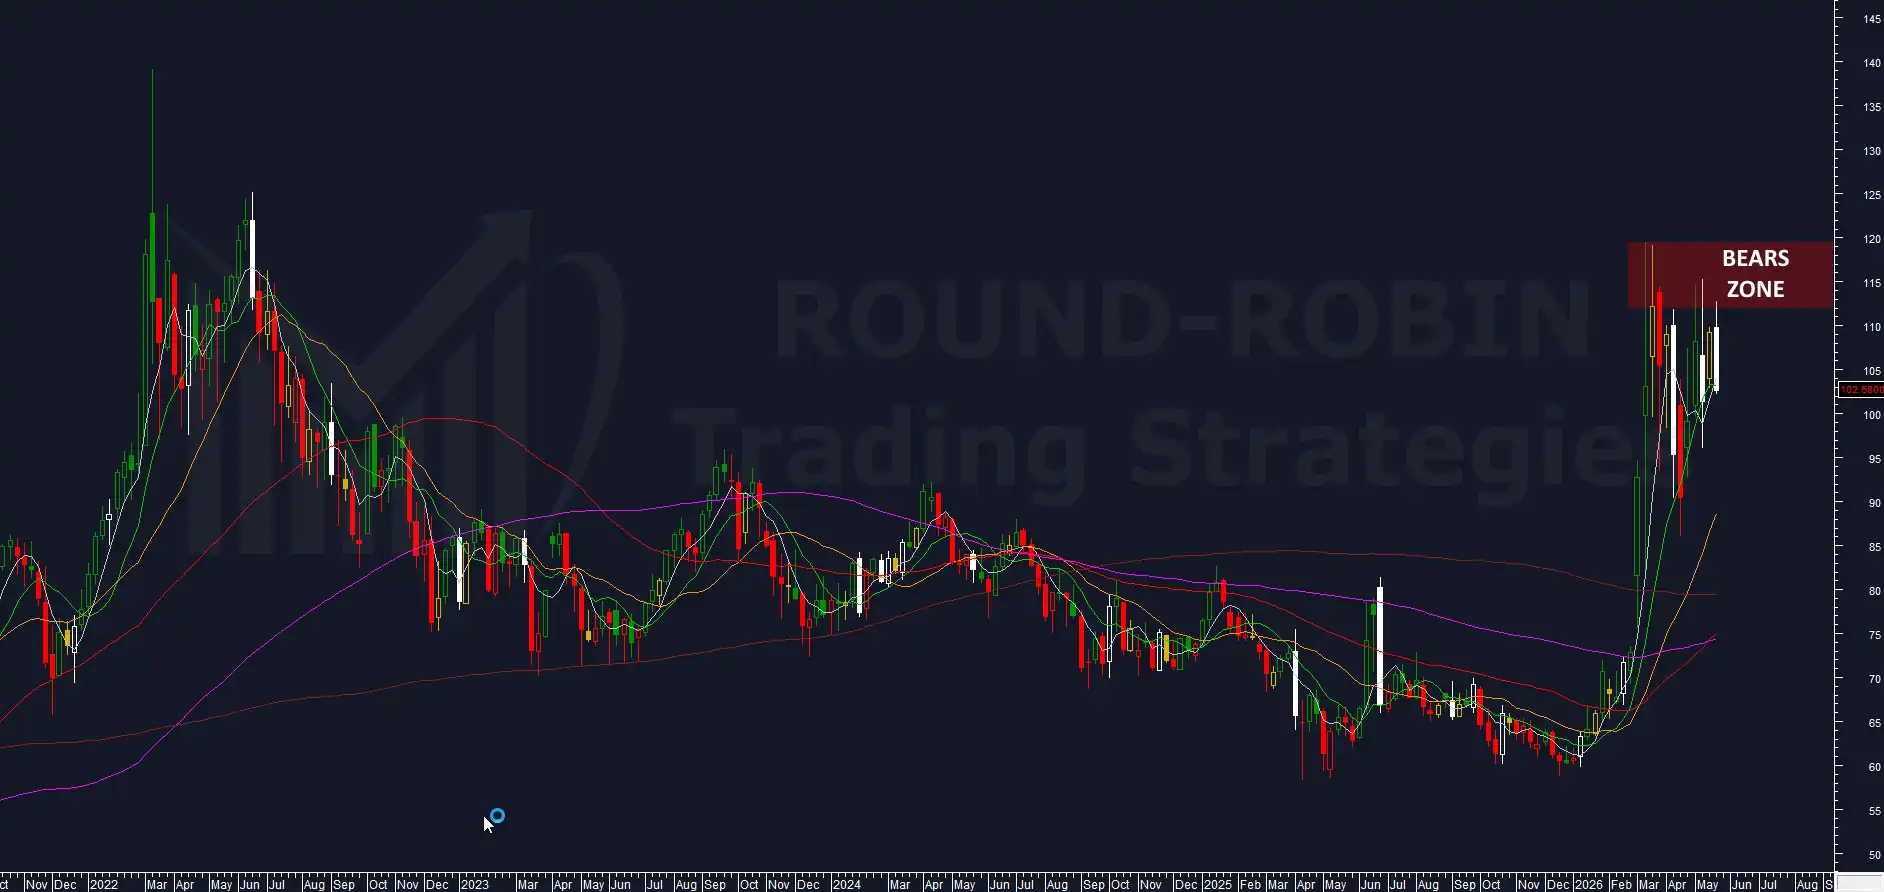
chart: Brent Crude Oil weekly
In last week’s Charts Flash the system was Flat with an inside bar with positive body that had held in the upper half of the previous outside week, closing at 109.26 above the rejection area. The thesis was continuation toward the 112-120 bear zone, with the 96 support as the holding reference.
This week price entered the bear zone (high 112.72) and was rejected: the second outside week in the last three. Open 109.75, close 103.54 (−5.24%), low 101.34. Range expanded to 11.38 points, in expansion compared to last week’s bearish candle.
It’s the third entry into the 112-120 area in the last four weeks, and the third violent rejection. This one however is the first that drives the close below MA5W and MA10W.
The Volatility Indicator contracts.
The system stays Flat. References remain the same as last week: bear zone 112-120 on the upper side, area 96 as the key support on the lower side.
⚡ EUROSTOXX50
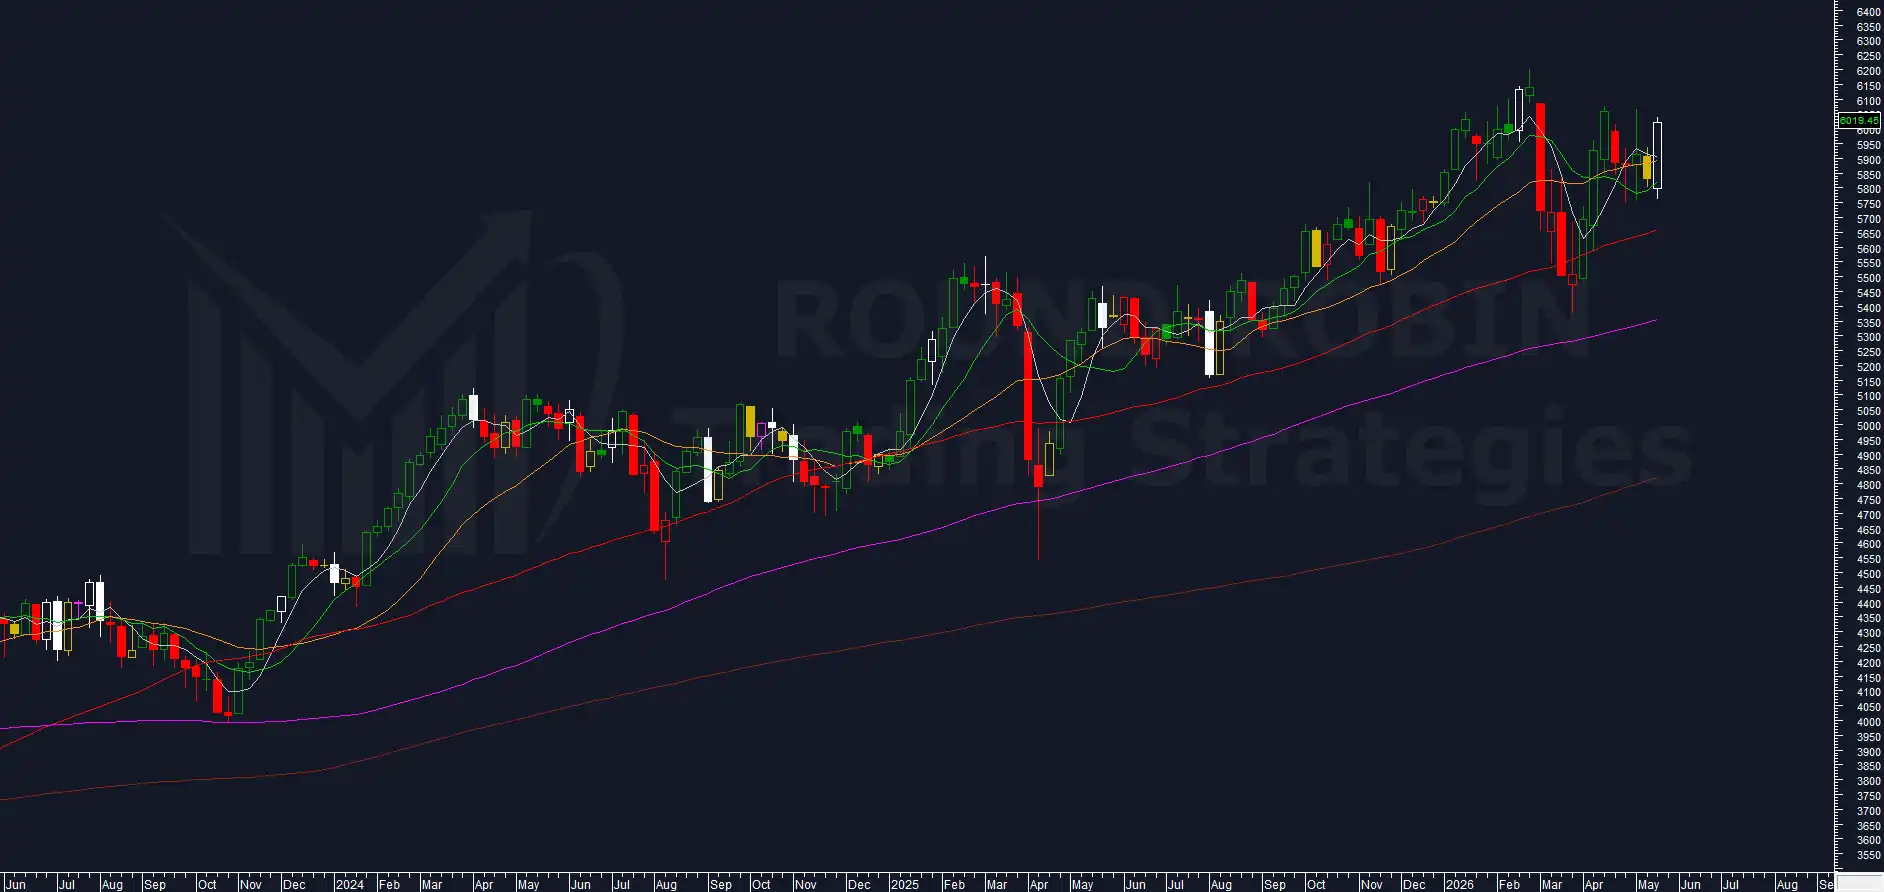
chart: Eurotoxx50 weekly
In last week’s Charts Flash the system was Short with an inside bar in the lower half of the previous outside week, closing at 5,818.21. Confirmation of bearish momentum was subject to a break of 5,745 and the MA10W.
This week the low at 5,762.15 missed 5,745 by just 17.15 points: the support held and price rebounded higher.
Open 5,797.66, close 6,019.45 (+3.46%), range expanded to 4.76%, positive body that brings the close decisively above MA5W and MA10W. Outside bar of opposite sign to last week’s inside.
The weekly high at 6,036.46 however remains below the long upper shadow of two weeks ago, which had hit 6,066.39: range expands, but price does not update the highs.
The Volatility Indicator stays stable at the lows since March, in the 4.5% area.
The system stays Short: the weekly candle did not trigger the stop loss. The upside extension of the range is however such that an attack on the highs seems inevitable.
⚡ DAX
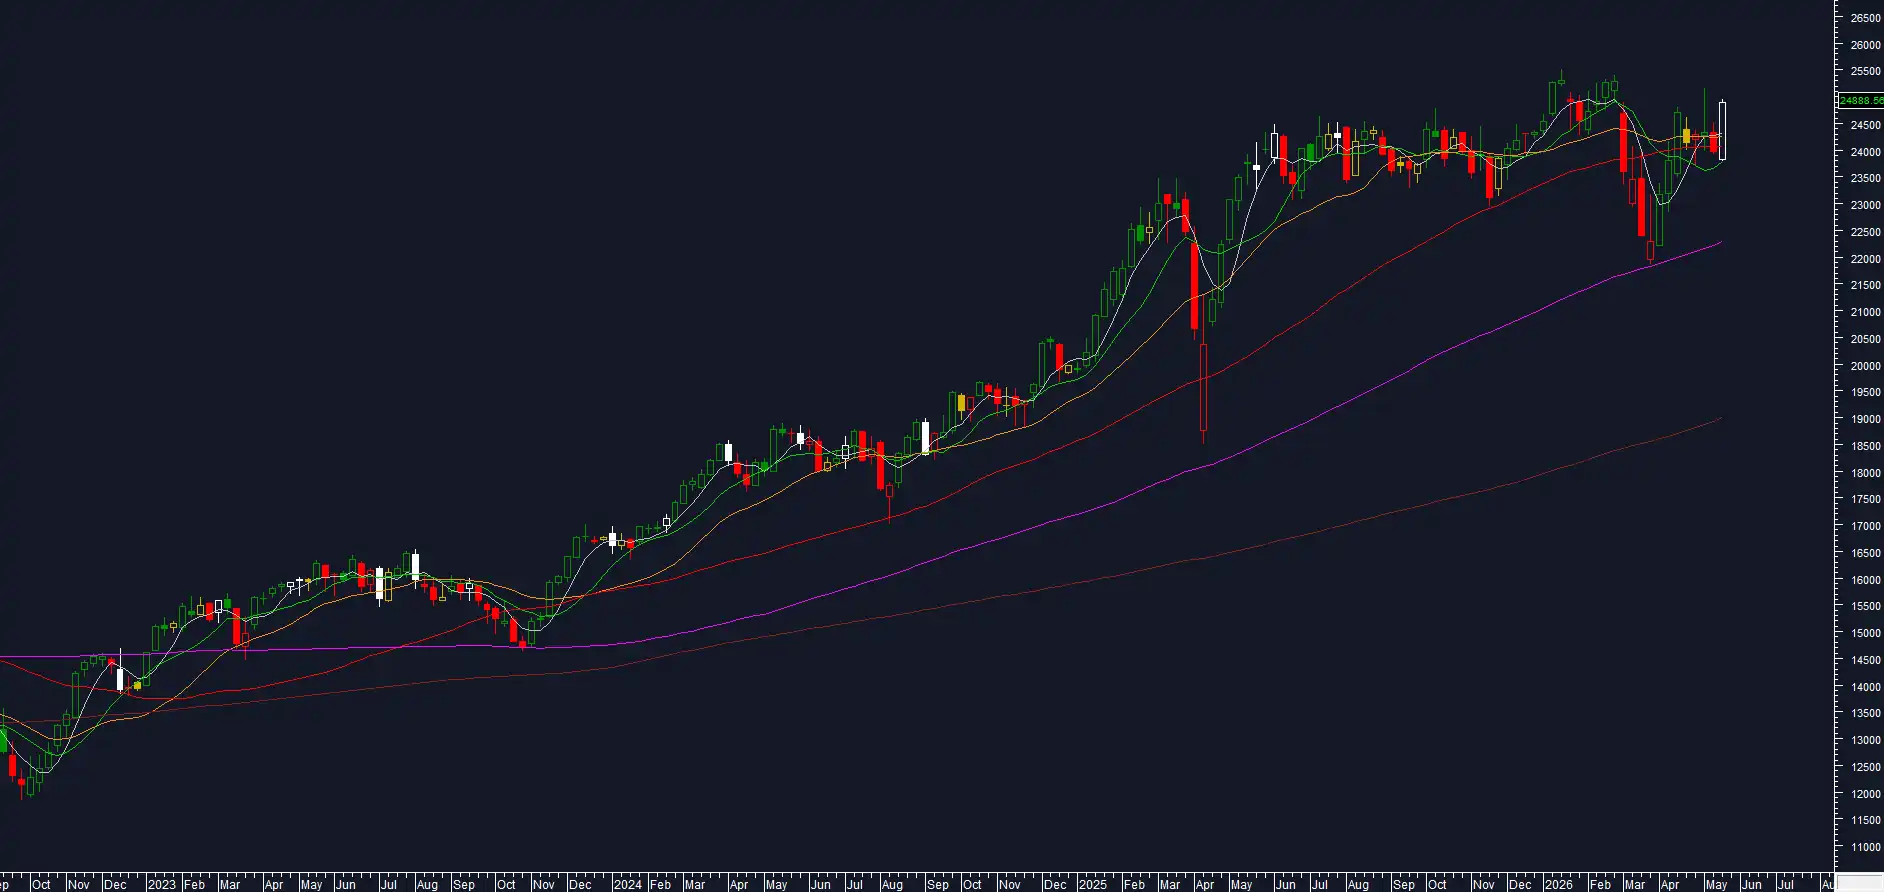
chart: DAX weekly
In last week’s Charts Flash the system was Short with lower highs and lower lows, closing at 23,962.90. Levels to watch were MA10W and 23,500 on the bear side (break = acceleration), 25,152 on the bull side (break = short exit).
This week the move is opposite in sign: outside bar with positive body. Open 23,833.11, close 24,888.56 (+3.86%), range expanded to 4.82% — a significant spike that shows the resilience of buyers.
The 23,500 level is not approached: weekly low at 23,797.33. On the upper side the high at 24,943.75 stops below the 25,152 of two weeks ago, the same behavior observed on EUROSTOXX50.
The Volatility Indicator climbs slightly to 5.33% after the previous two weeks, but stays below all the moving averages.
The system stays Short: neither operational reference has been violated. The same observation made on EUROSTOXX50 applies here: the upside extension of the range makes an attack on the highs a hard-to-avoid outcome.
⚡ NIKKEI 225
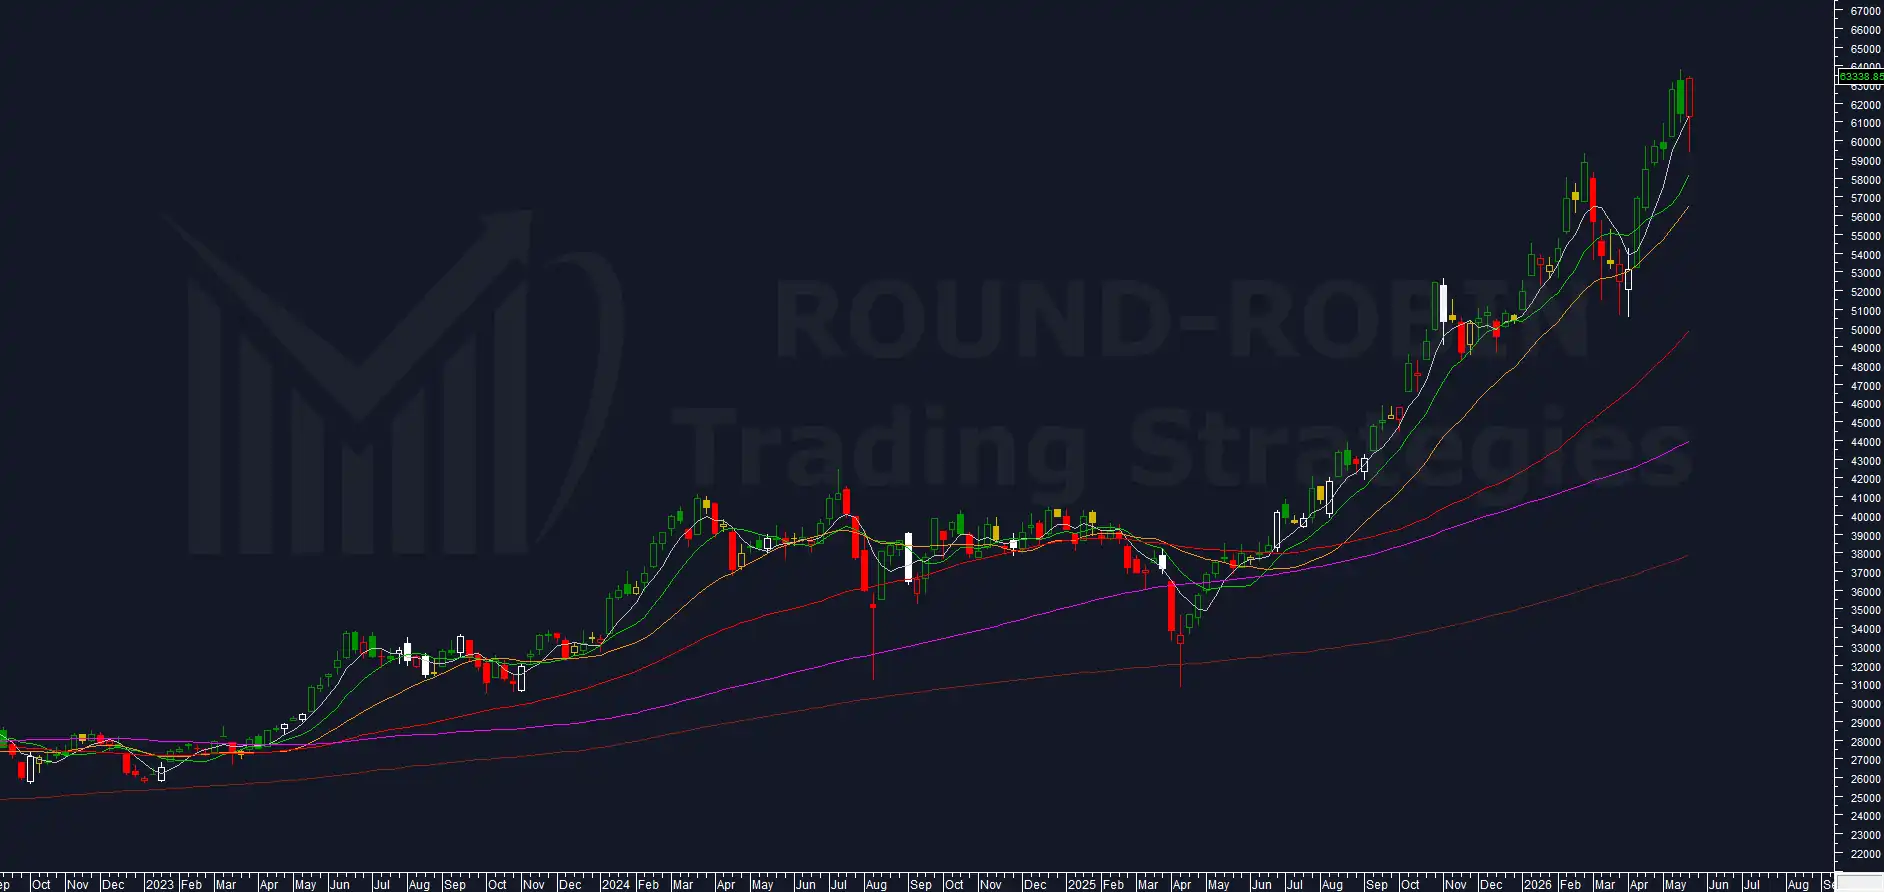
chart: NIKKEI weekly
In last week’s Charts Flash the NIKKEI had retraced after the all-time high at 62,713.65, with higher highs and higher lows but close below open. Close was 61,409.29 (−2.08%), with overextension on the MA200W at the new all-time high of +61.57%. The Short system was close to the stop loss.
This week the picture flips. Open 61,299.87, close 63,338.85 (+3.14%), range expanded to 6.98%. The bullish body drives the close to a new all-time weekly close record, above all the moving averages and in line with March peaks.
Highs and lows are decreasing compared to the previous candle: the close record does not coincide with a new weekly high record, the same configuration observed on the COTW SP500 of this week. A nuance, because the strength shown by Nikkei remains without recent precedents: the only comparable episode dates back to September 2005, but in a completely different context, exiting a multi-year bearish cycle.
The drop down to the weekly low (59,292.25) contributed to cancel the overextension on the MA5W and to reduce the one on the MA200W to +56.47% — a value that remains historically very high.
The Volatility Indicator stays at long-term average values, with no relevant cues.
The system stays Short: the weekly high did not violate the operational reference.
Bullish resilience in a context of general strength. Even more than on the other indices, on NIKKEI the break of the absolute highs looks like an easily reachable outcome.
Leave a Reply