Weekly appointment with the most followed charts in the world.
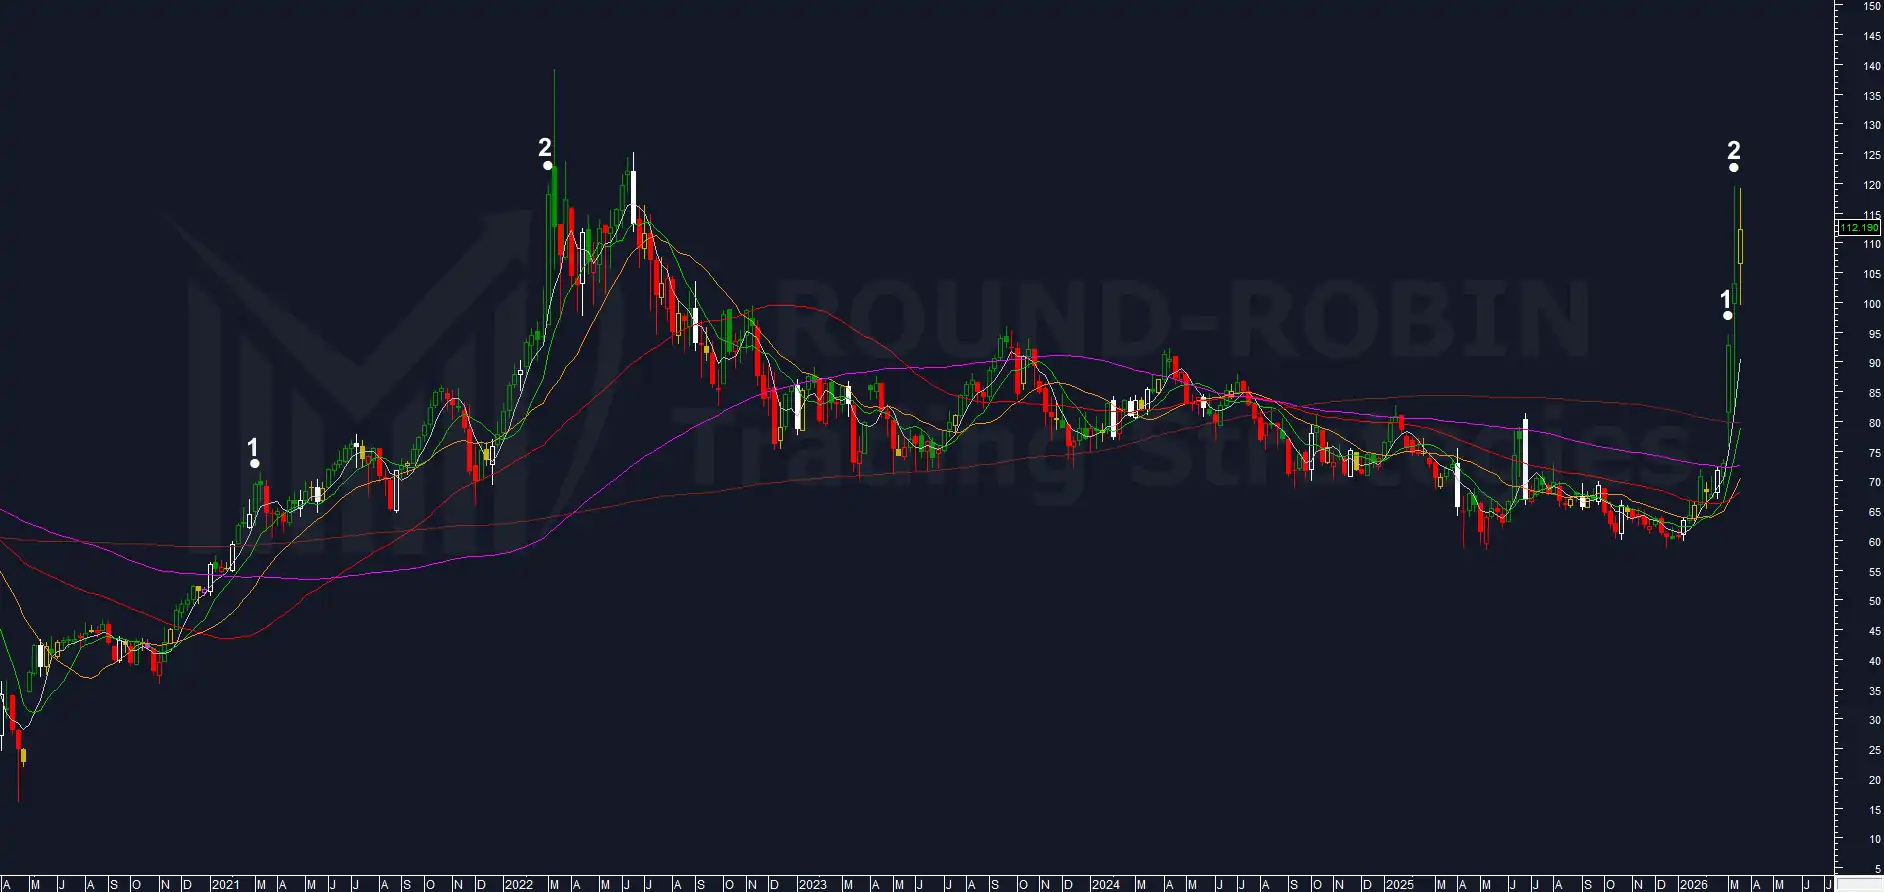
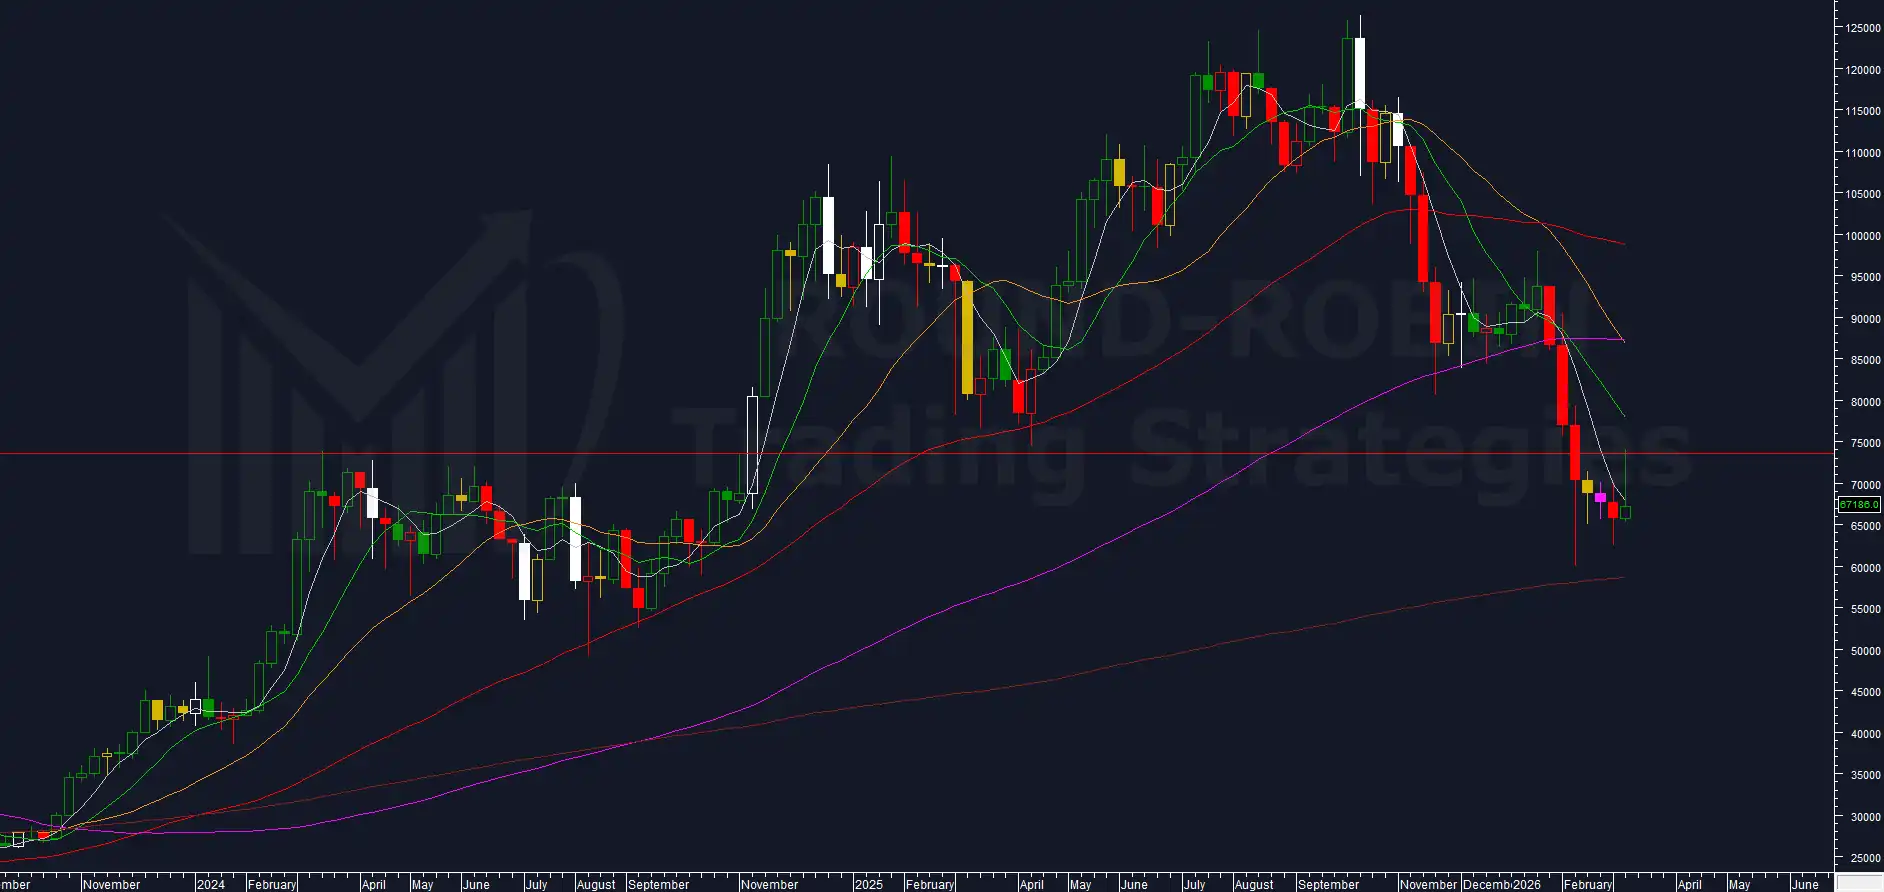
Last week we identified the setup and defined the two possible triggers: a bull trap above 119.13 or a direct rejection from the 112.19-119.50 area with a weekly close below 106.
The trigger has fired.
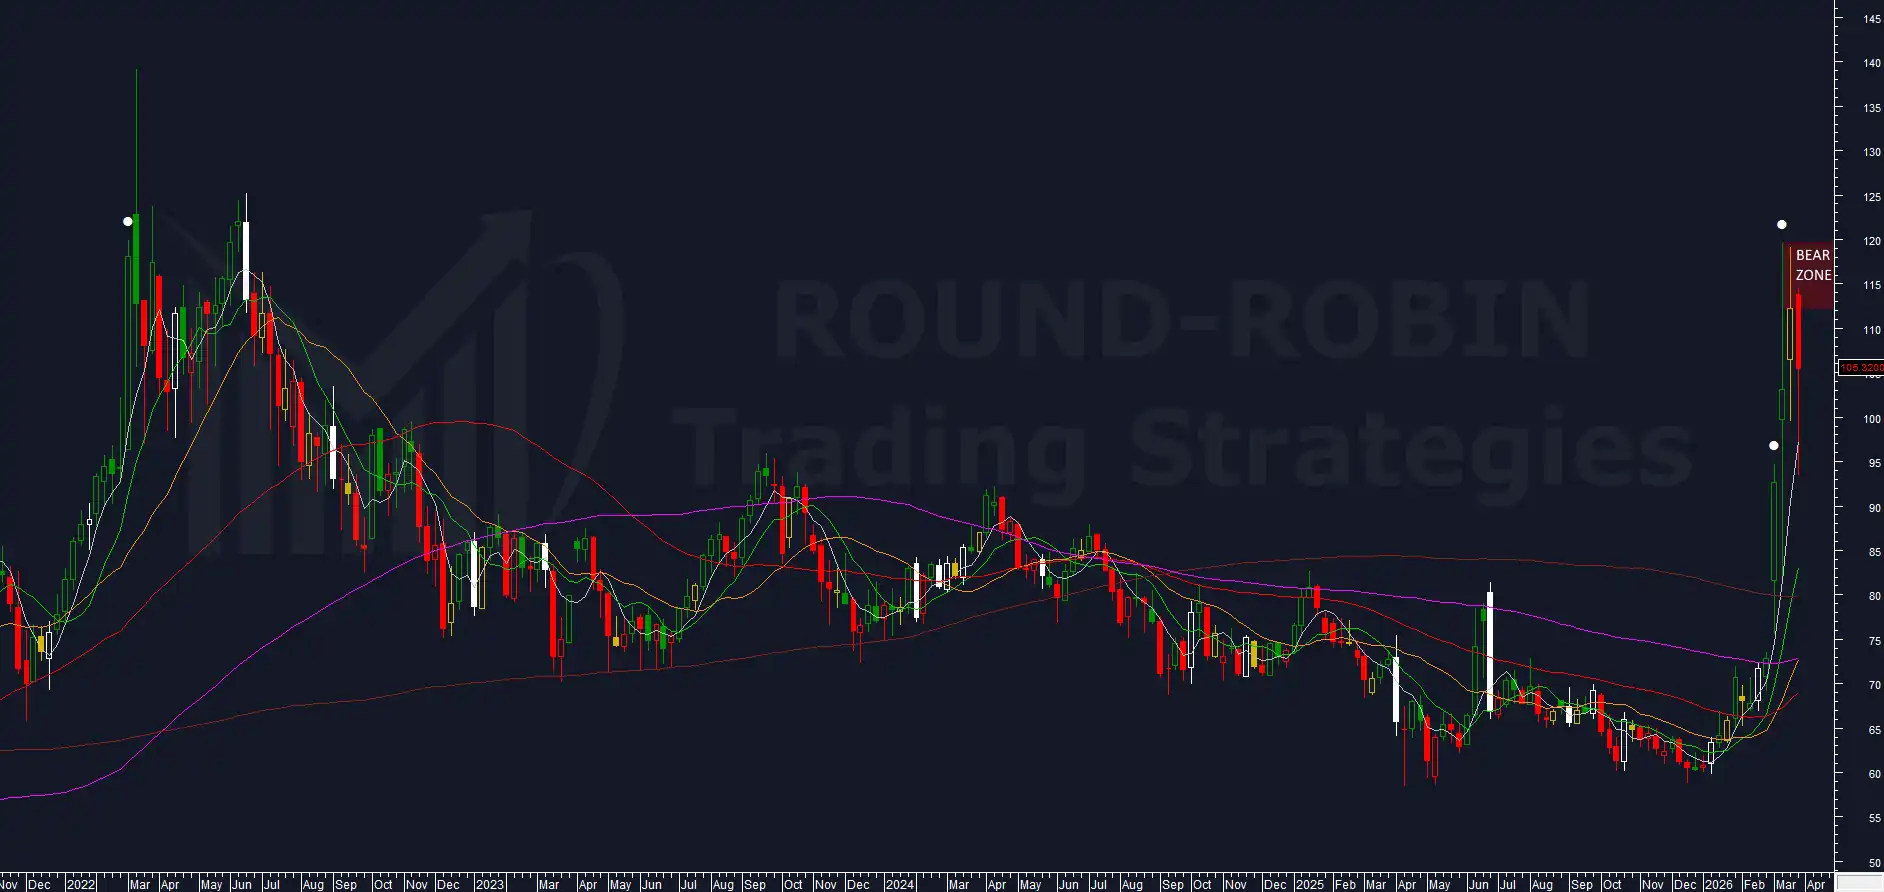
On Monday March 23, with Brent still above 114, Trump announced the suspension of attacks on Iranian energy infrastructure and the start of negotiations. The drop was immediate: within minutes the front month lost over 13%, pushing prices down to 93.45. Iran later denied the existence of any talks, and the market recovered part of the lost ground. All of this in a context already made chaotic by the contract rollover.
The selloff was followed by a recovery, but the recovery did not change the structure. At the weekly close Brent settled at 105.32: it bounced off the lows but failed to reclaim the supply area.
The short signal was generated at Friday’s close. Let’s see what the charts are telling us.