


A short week for Memorial Day, but a week of records. And not only on price.
The S&P 500 closes at 7,580.06, a new all-time closing high. The weekly high at 7,599.38 also prints the new intraweek record, surpassing the 7,517.12 of two weeks ago.
On the bullish counts, the 25-year record is matched: consecutive weeks with a positive body rise to 9, a level reached only 4 times. Consecutive weeks with higher closes also rise to 9, a threshold reached only twice in the same period.
The push comes from a favorable macro context, particularly on the geopolitical front, with the week’s newsflow feeding an already euphoric market phase.
Let’s look at the details.
Bulls vs Bears
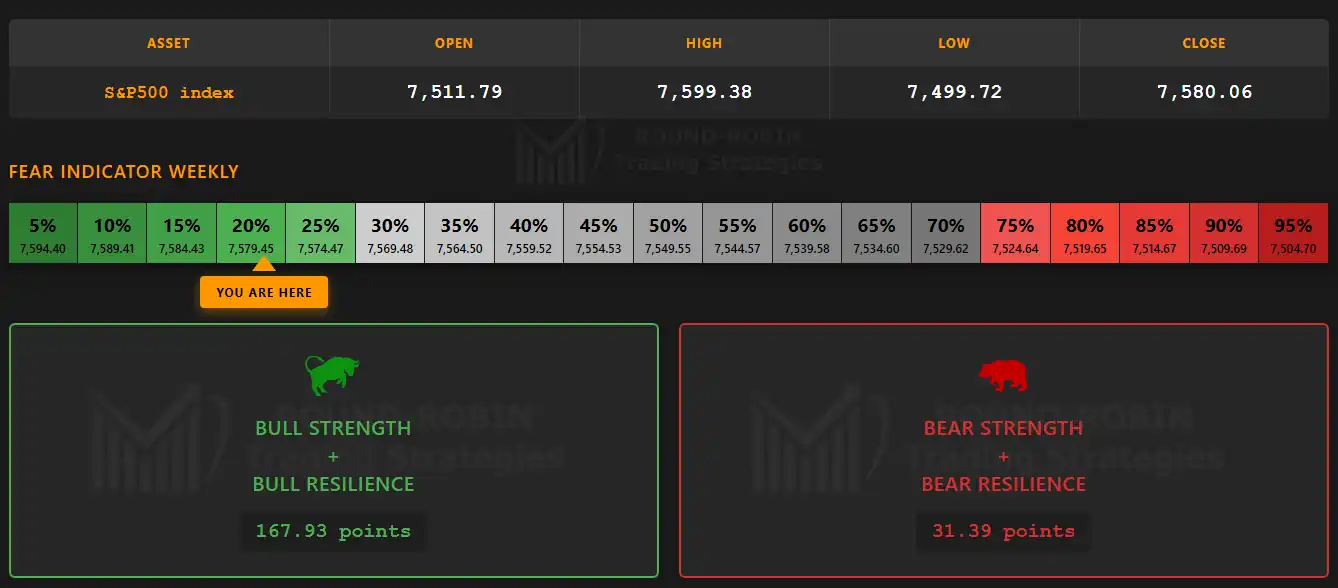
infographic: S&P500 index weekly – Bulls vs Bears
Bulls win the week by a ratio above 5 to 1, but on a total range below 100 points. The dominance is more an absence of selling initiative than structural buying pressure: the market rises by inertia.
The Fear Indicator in the lower part of the comfort zone confirms the risk-on phase.
The Big Picture
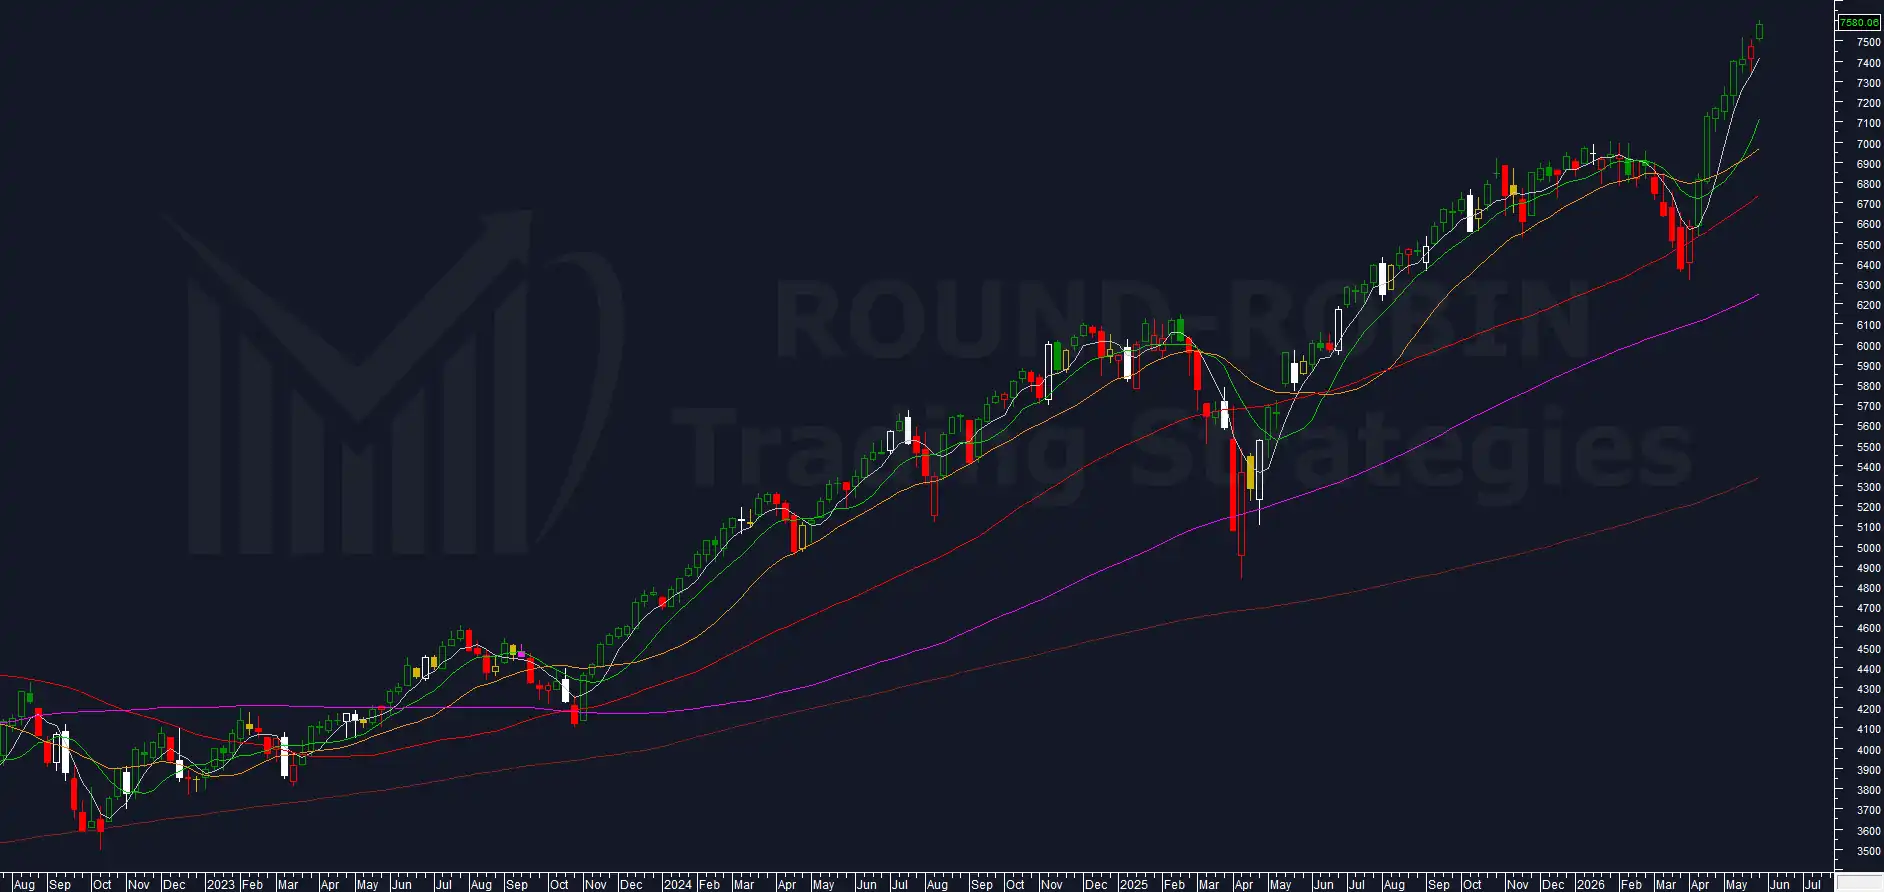
chart: S&P500 index weekly
The weekly candle prints a double record: new closing ATH at 7,580.06 and new absolute all-time high at 7,599.38. The previous intraweek record of 7,517.12 is broken and pushed higher, while the close also updates the 7,473.47 level of the previous week. The Capped ATH Close resolves into continuation, the statistically less probable side of the two options available with overbought oscillators.
Both highs and lows are higher: seventh week out of 8 with this configuration. The previous week’s interruption remains a single breath in the bullish sequence.
On the counts: 9 consecutive weeks with a positive body, matching the 25-year record (seen only 4 times). 9 consecutive higher closes, also matching the record here (seen only twice).
The index holds above all moving averages, correctly aligned from slowest to fastest. The overextension on the MA5W rebuilds with a slope close to record levels, slightly lower. The MA10W shows a slope typical of the early stages of a move emerging from deep oversold. In an already advanced bullish phase like the current one, the same angle signals anomalous trend acceleration.
Volatility Indicator
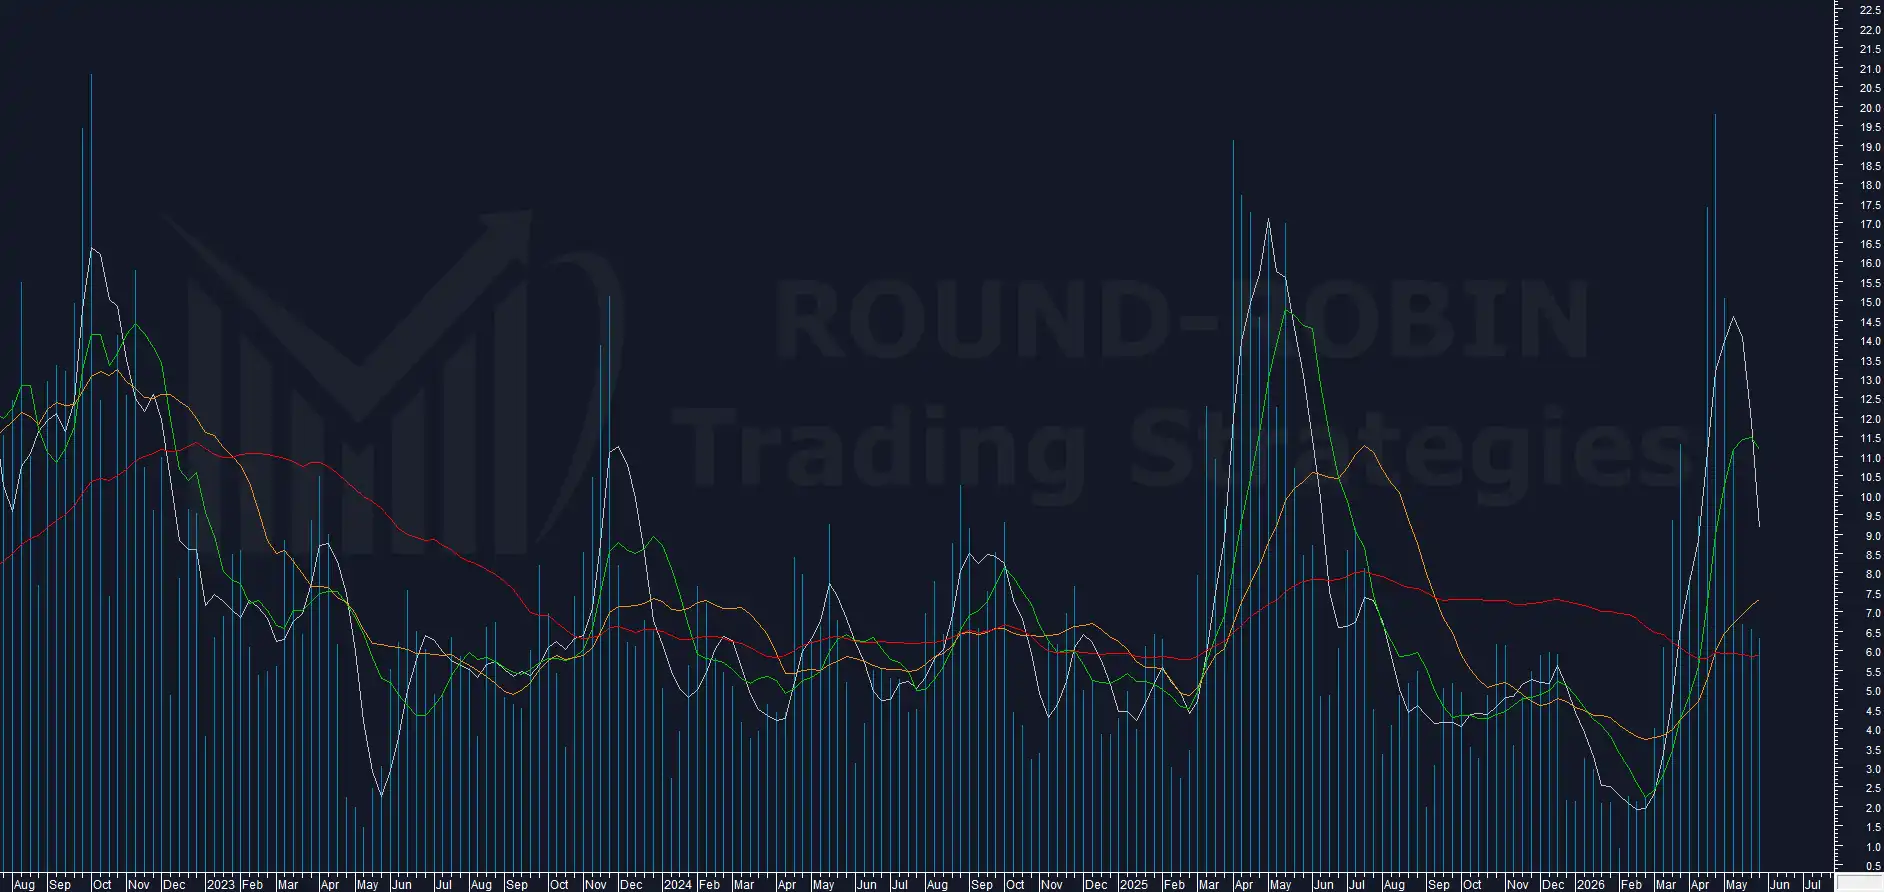
chart: Volatility Indicator – SP500 weekly
The Volatility Indicator closes at 6.36%, essentially unchanged. It holds above the MA50W around 6%, while the indicator’s MA5W continues its decline, retracing from the peaks of the recent expansive phase.
Range Weekly%
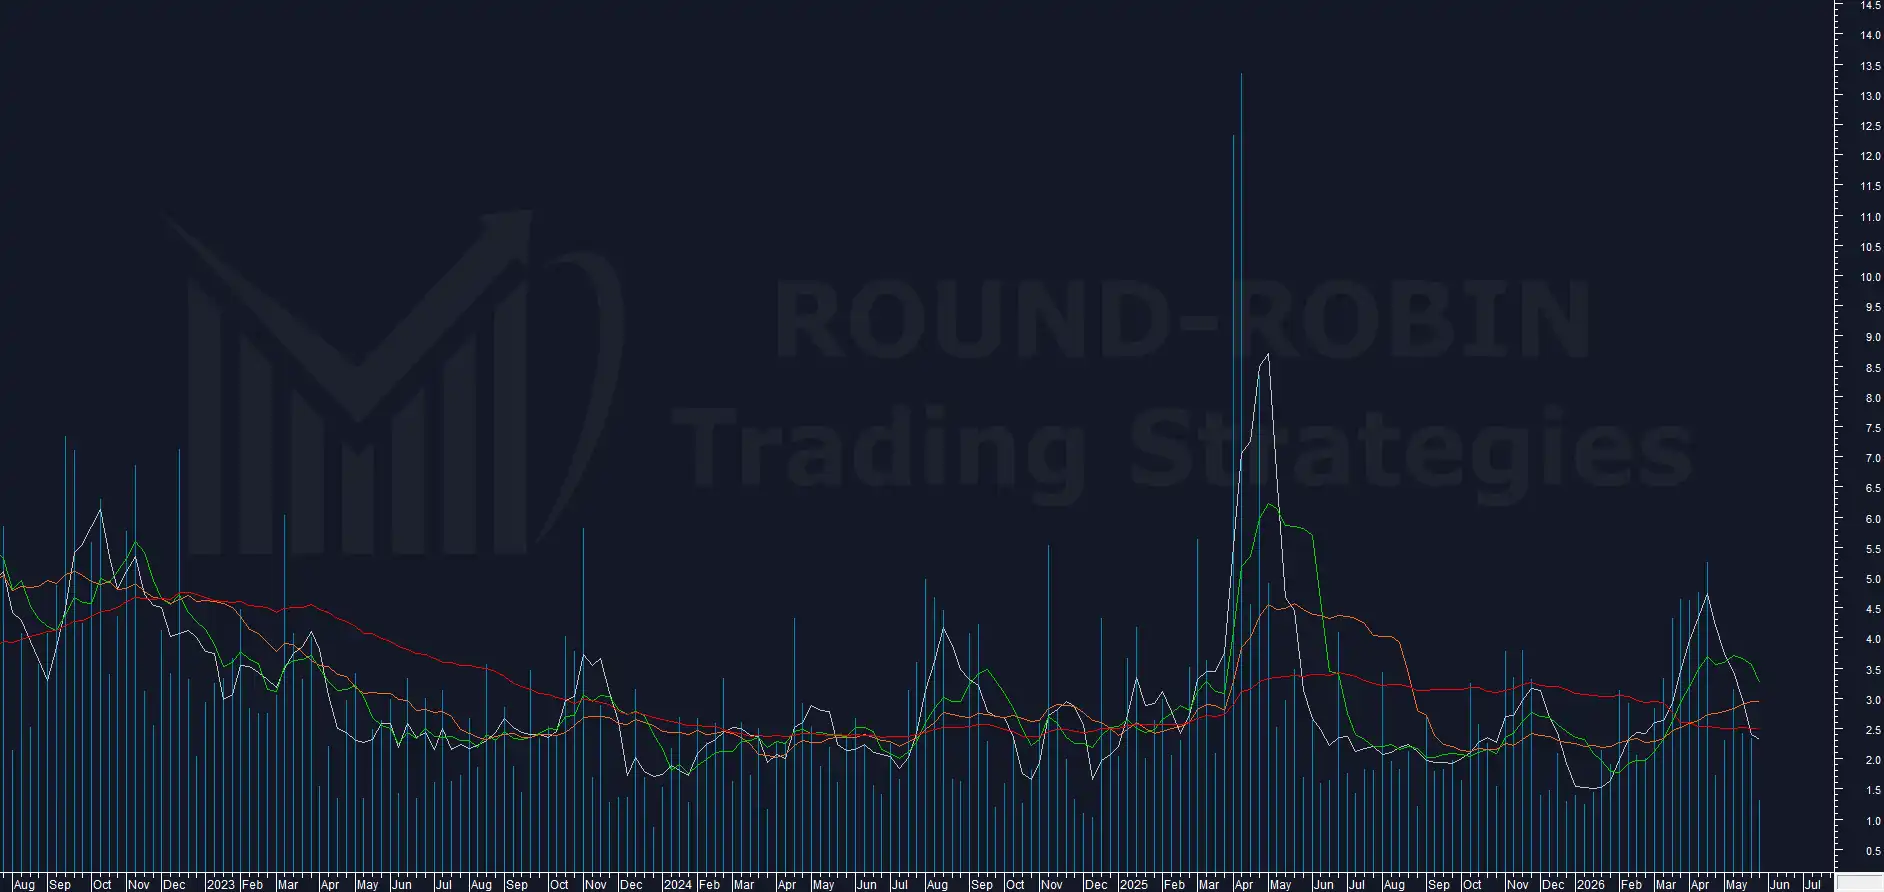
chart: S%P500- range % weekly
The Range Weekly% drops to 1.33%, the second lowest value of the year. The compression extends beyond that of the previous week, with all moving averages above the current value.
The index has updated absolute records in a historically reduced range context. The move’s directionality proceeds without volatility expansion, an anomalous configuration for a trend phase.
On the operational side, this is the data point that kept the Short position open. Range expansion is one of the conditions of the stop trigger, and with the Range Weekly% at the second lowest level of the year this condition didn’t materialize.
BCP3
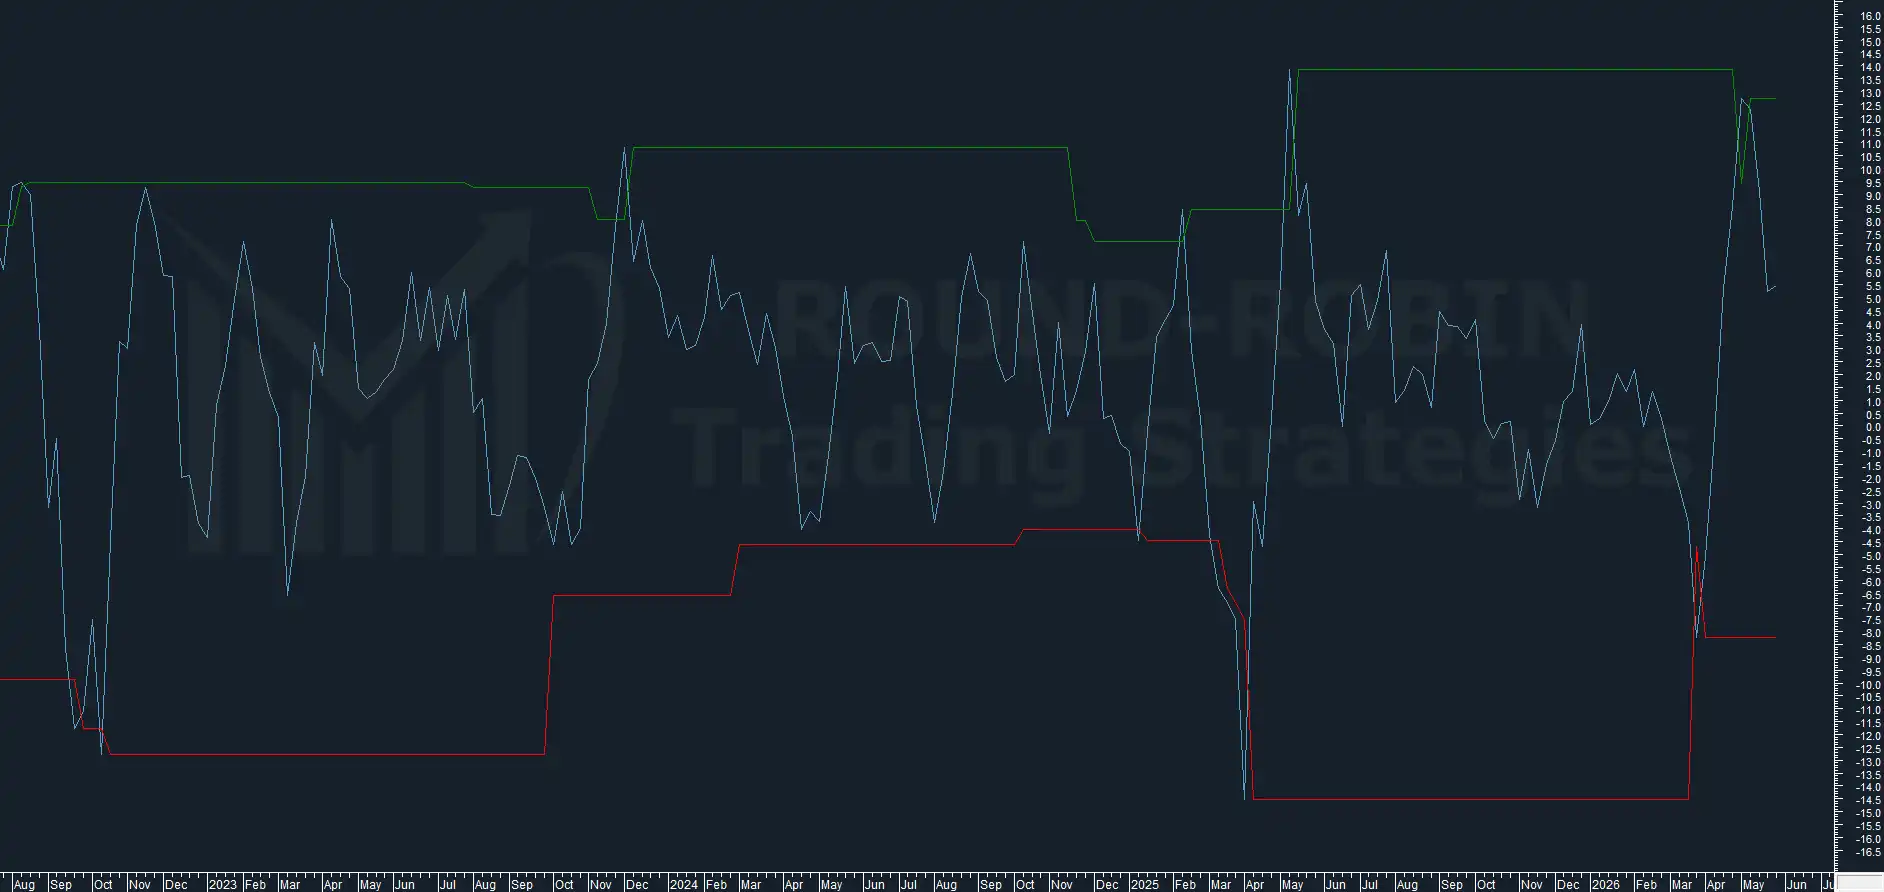
chart: BCP3- S&P500 weekly
The BCP3 closes at 5.45%, halting the decline and holding in positive territory.
In recent years no bearish swing on the indicator has reversed without first passing through negative territory. An early conclusion of the ongoing swing, above zero, would be a statistical exception.
The next candle will show whether the indicator’s swing has room to continue or whether the rotation has actually exhausted.
Overextension MA200W
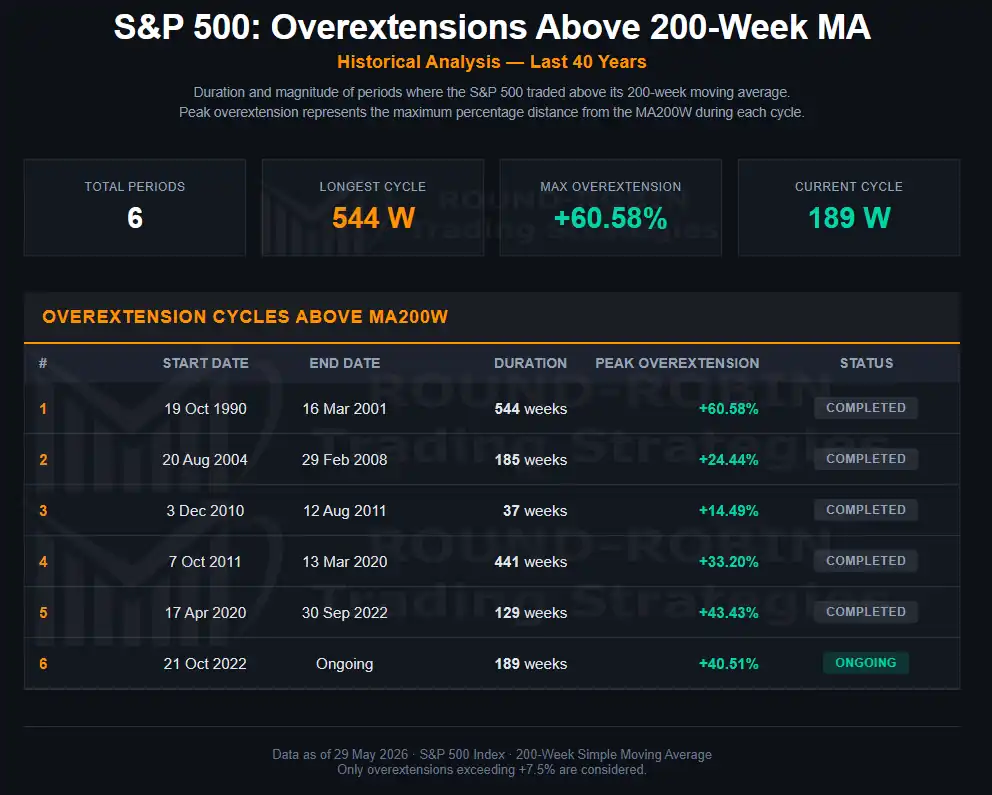
Table: S&P 500 Overextension Cycles Above MA200W (1990-2026)
The overextension on the MA200W rises to 40.51%, attacking the 2020-2022 cycle peak at 43.43%. The all-time record remains far away: the +60.58% of the 1990-2001 cycle (reached in 1998).
The comparison with 2021 is suggestive. In that cycle the first peak above 40% was followed by a decline, a V, and a second peak above 43%. Back then too, at the height of the second peak, prices were in breakout. The bear market arrived only later.
The 2026 structure retraces the same pattern on the indicator: first peak, decline, V, second peak in progress. On prices the picture is equivalent to 2021 at the corresponding moment: today too we are in breakout, today too we don’t know whether the high in formation is the cycle high.
The coming weeks will tell whether the analogy holds. A retracement of prices from current levels would strengthen the parallel with 2021. An extension beyond 43% would shift the reference to the 1990-2001 cycle, with historical room up to 60%.
Conclusion
The indicators continue to describe a market in excess conditions, but the price keeps refusing any bearish confirmation. This is the most relevant point of the week.
After the V traced from the March low, the most recent phase of the move has taken on different characteristics. The new records don’t arrive through clear accelerations or volatility expansions, but through a succession of limited advances. Taken individually they look minor; added up, they have brought the index to nine consecutive weeks of gains, matching one of the 25-year records.
For the system’s Short position this is a particularly complex configuration. The indicators remain consistent with an excess reading: the MA200W overextension is attacking the 2020-2022 cycle highs, the Range Weekly% prints the second lowest value of the year and the BCP3 remains in an incomplete bearish swing. On the price side, however, the market keeps updating historical records.
The consequence is that the trade keeps deteriorating without the conditions required for the exit trigger being met. None of the anomalies observed in recent weeks, from the Capped ATH Close to the new highs printed in range compression, has been enough to activate the realignment required by the system.
The position therefore remains open and no trigger is currently active. The coming weeks will show whether the indicators reabsorb the signaled excesses or whether the market keeps pushing further, extending a move that has already reached statistically extreme levels.
Leave a Reply