LOGIN SIGNUP
English Italiano
Markets
World Indices
Forex
Commodities
Crypto
EN
IT
×

CONTACT US

Round-Robin Logo

Charts Flash: Week 17/2026

Quick observations on the charts that caught our eye this week.


This week’s flash covers EUROSTOXX50, Brent Crude Oil, Bitcoin, Nikkei 225 and DAX.

Gold and Silver remain flat with no relevant changes and are not updated.

EUR/USD shows no significant developments.

EUROSTOXX50 prints lower highs and lower lows after four consecutive weeks of gains.

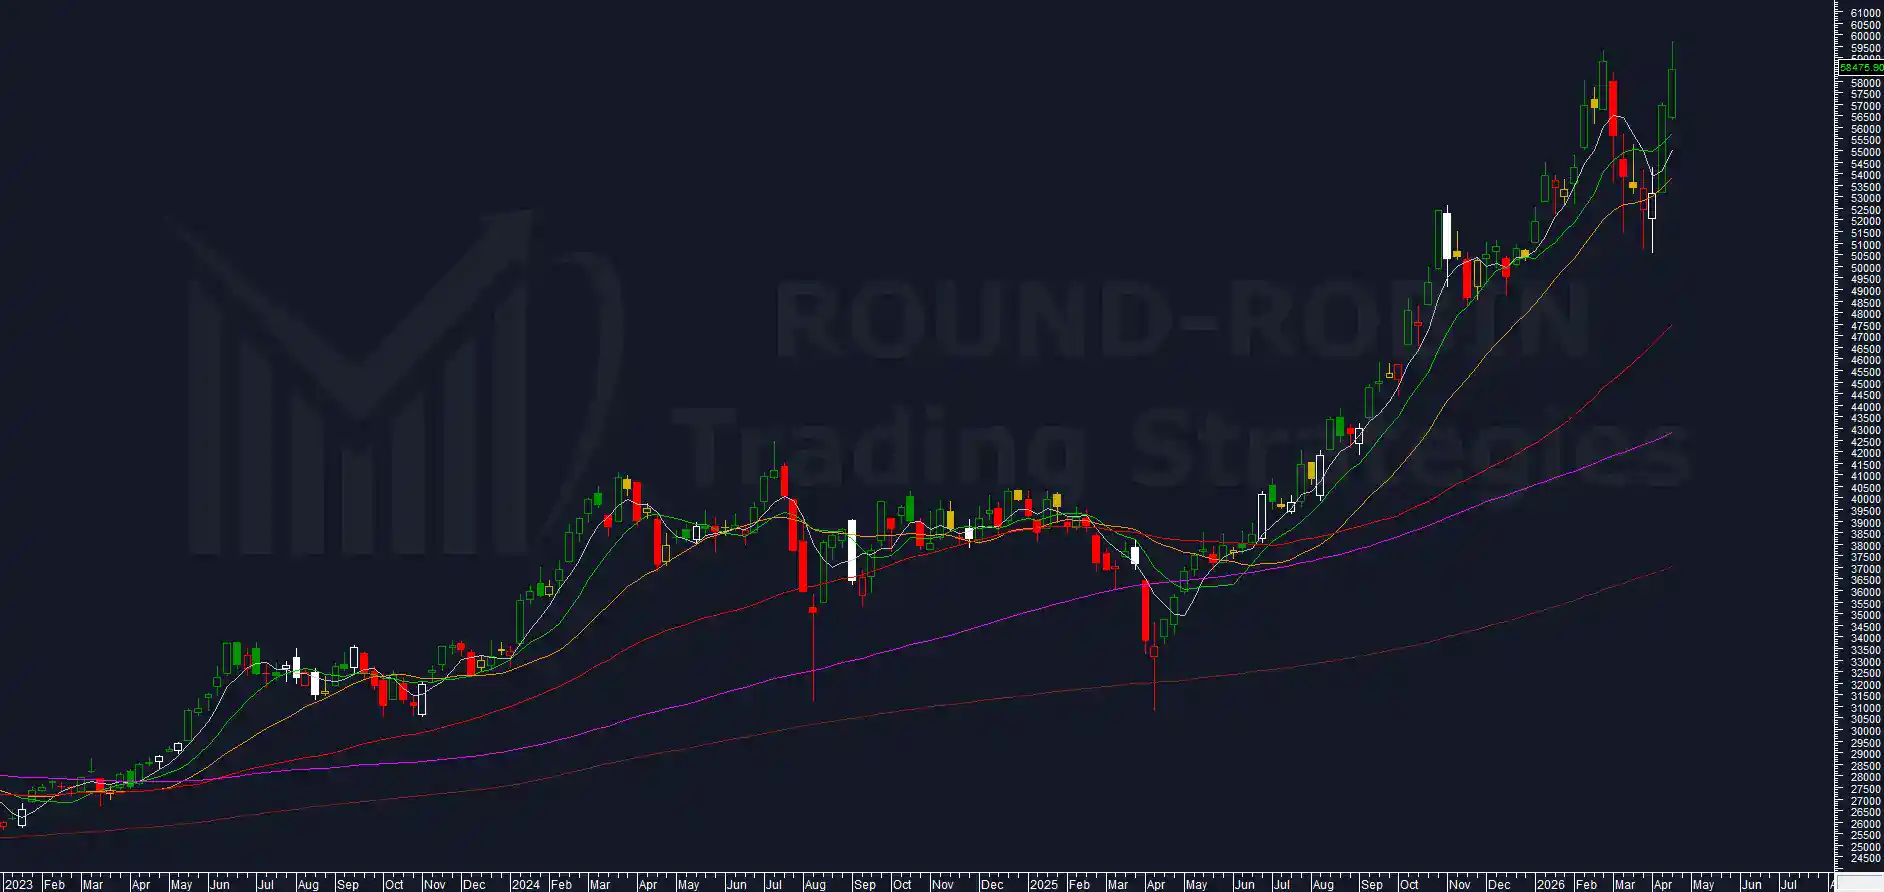
Brent recovers with higher highs and higher lows and reclaims the MA10W.

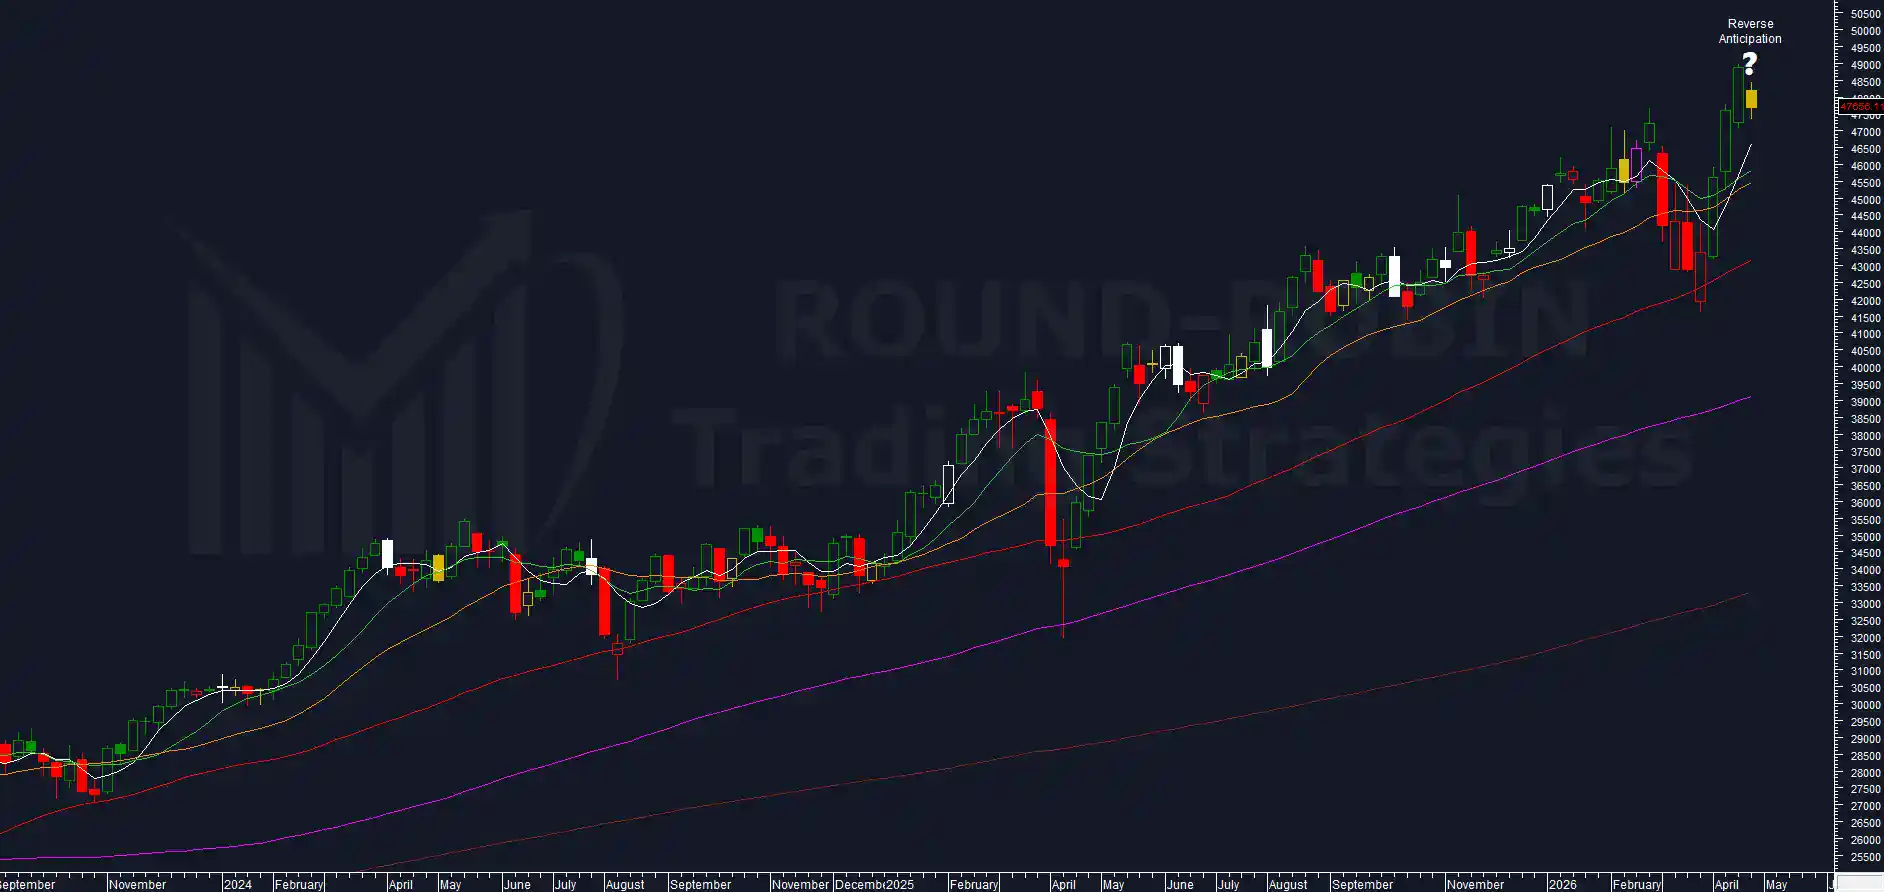
Bitcoin at its third consecutive week of recovery with a slight break of the MA20W.

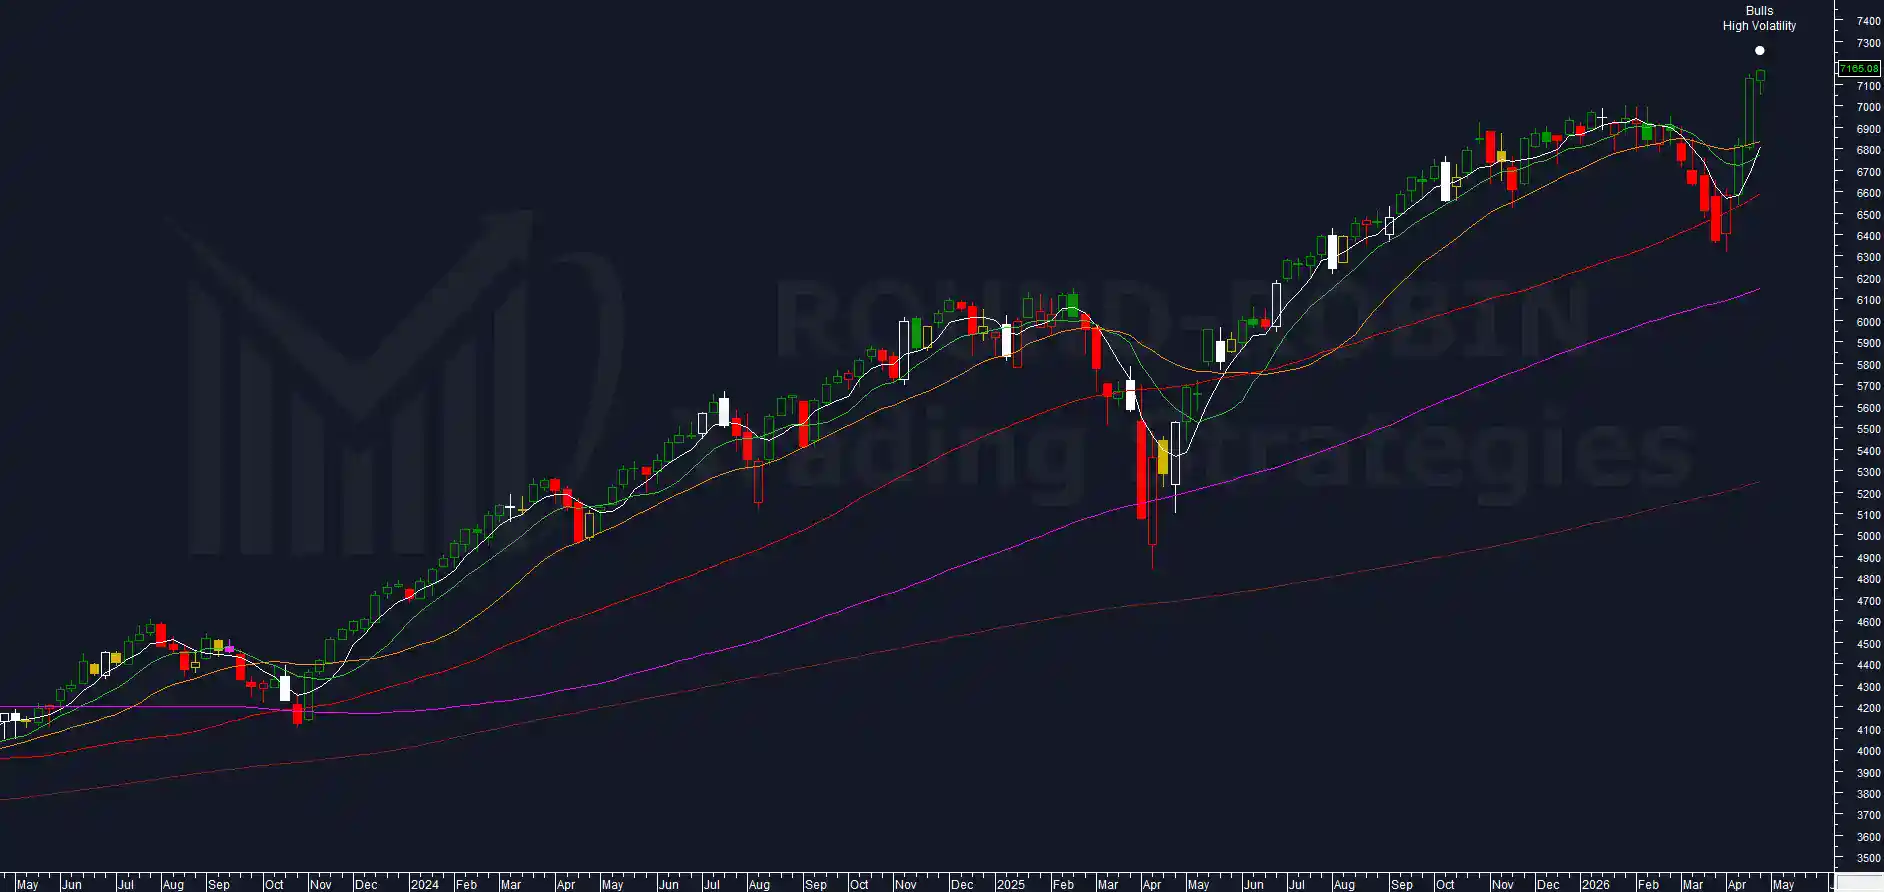
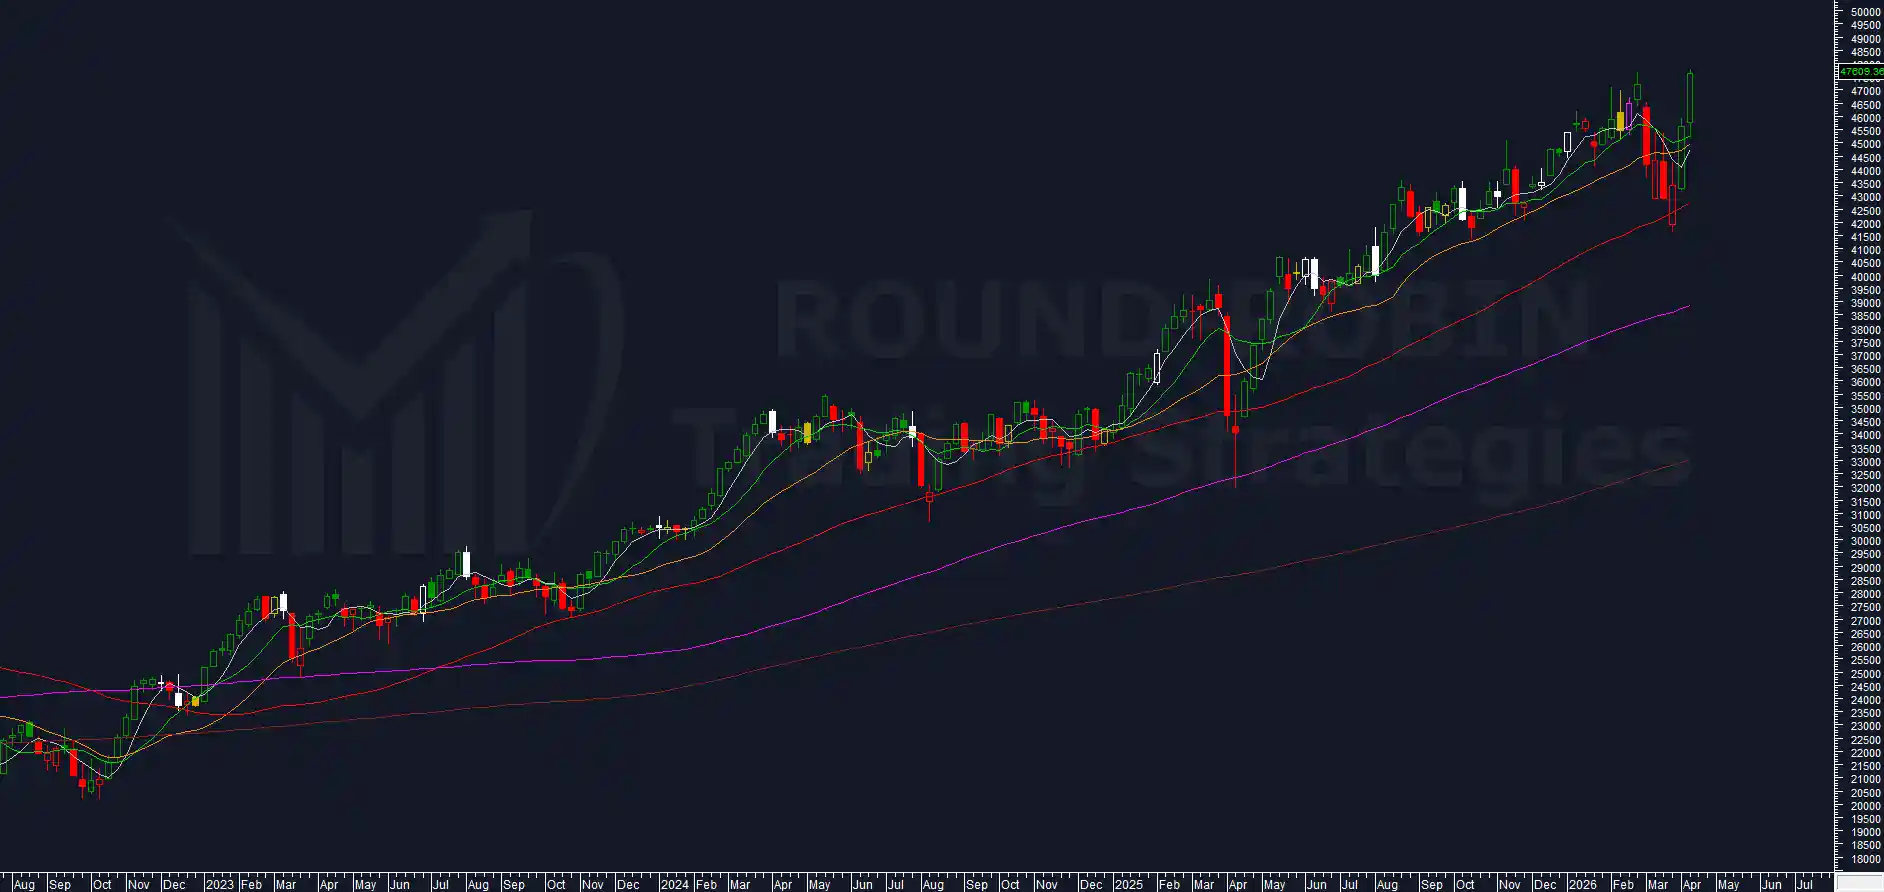
The Nikkei 225 marks a new all-time high and a new record close.

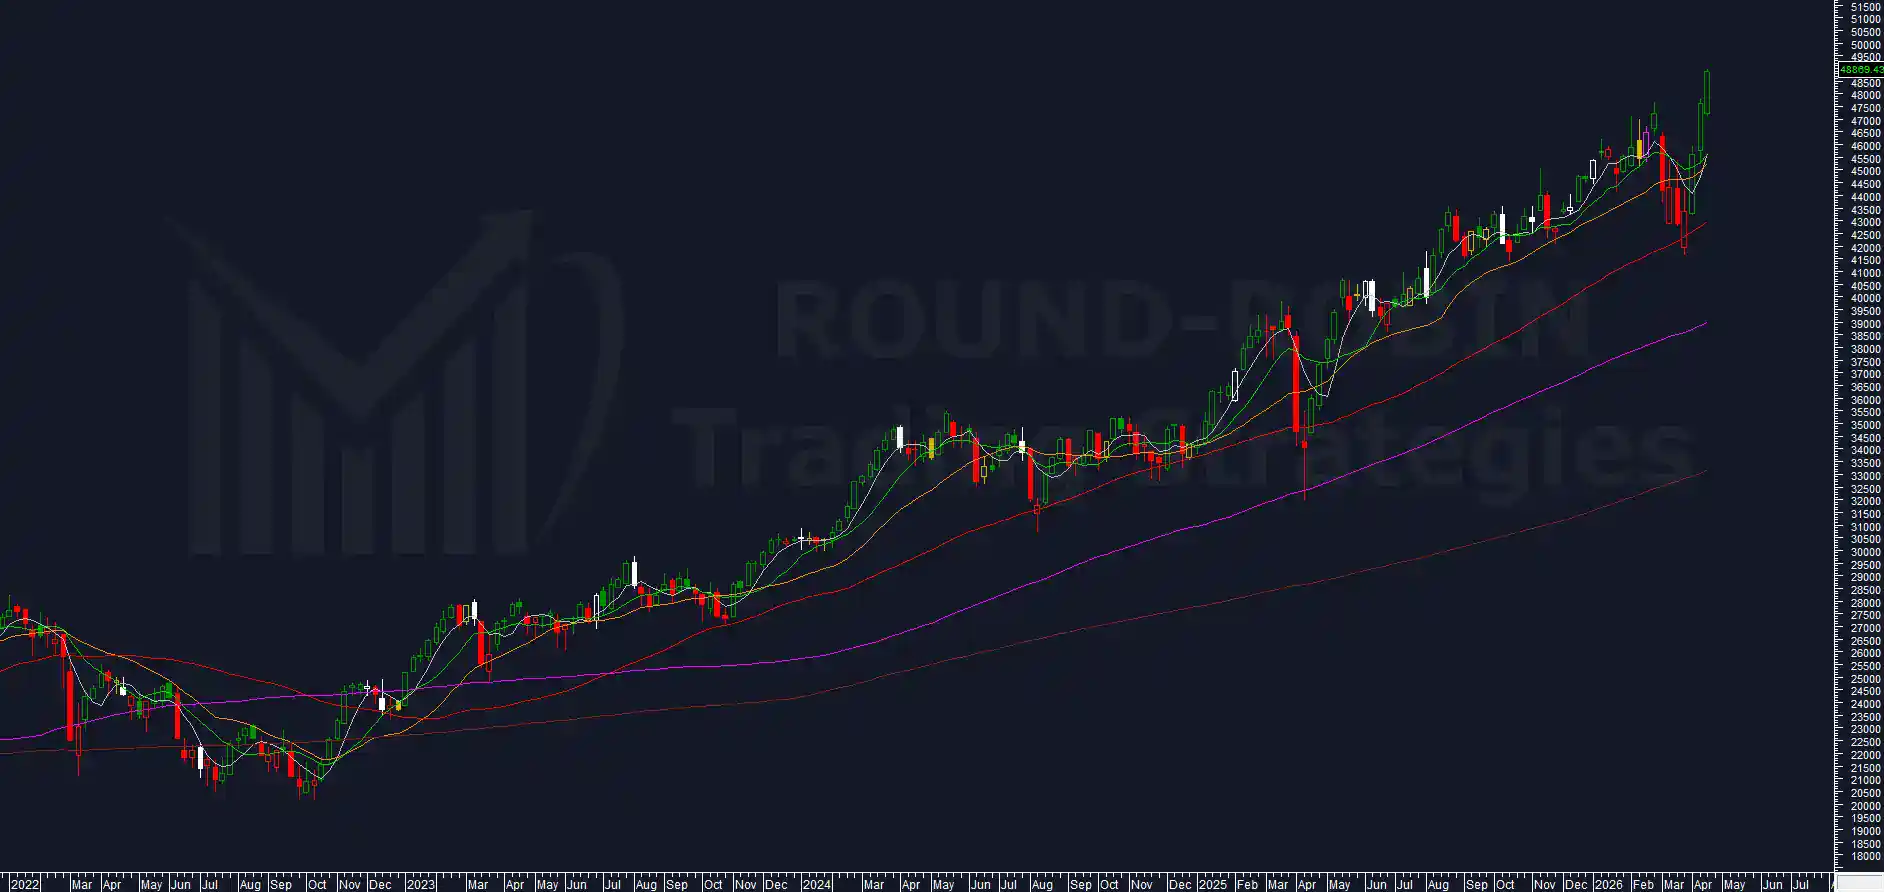
The DAX prints an inside week with a close below the open.

Let’s dig a little deeper.

Read More →

Chart of the Week: S&P500 index

Weekly appointment with the world’s most watched charts.


Last week in Charts Flash we called the S&P 500 the obvious pick for Chart of the Week, deferring to the Nikkei 225.

Another week of higher highs and higher lows, a new all-time closing high. But in a context of compressed moves and a market that is not pricing risk.

Our volatility indicator tells a different story. We are at levels that in a bull market context have been seen only once in the last 26 years. It was March 2000.

Read More →

The Hunt: FTSE MIB Week 16

Weekly monitoring of the Italian benchmark index.

Why do we do this?

Check out our strategy page.


My proprietary DBBT indicator identifies misalignments between current price and expected technical level on major indices.

Every week, the FTSE MIB is in our crosshairs.

The hunt is on.


In our latest analysis, we left off with a convergence of indicators pointing toward a potentially toppish setup.

Overextension at 3.10% on the MA5W, Fear Indicator at 5%, BCP3 in exhaustion territory: everything was suggesting the same scenario.

The FTSE MIB closes the week at 47,656.11.

One data point captures this week above all else.

Over the past six weeks, even the weakest ones, the index had always touched at least one price above the prior week’s close at some point during the week.

This week the FTSE MIB never did: the weekly high stopped at 48,439.61, over 400 points below the prior weekly close of 48,869.43.

As always, let’s dig into what the indicators are telling us.

Read More →

Charts of the Week: Nikkei225

Weekly appointment with the world’s most watched charts.


The S&P 500 printed a new all-time high with a clean break confirmed by the weekly close as well. An exceptional bullish candle that under normal circumstances would have been the natural choice for Chart of the Week.

Yet the choice fell on the Nikkei 225.

The Nikkei also touched a new all-time high intraweek at 59,688.10 this week. But unlike the S&P 500, the weekly close at 58,475.90 did not confirm the record, remaining below the all-time closing high of 58,850.27 from the week of February 27.

The reason the Nikkei deserves the main focus is another one.

The overextension on the MA200W has returned above 50%. This week could mark the beginning of that final phase we outlined in our Chart of the Week Week 9.

Read More →

Charts Flash: Week 16/2026

Quick observations on the charts that caught our eye this week.


This week’s flash covers EUROSTOXX50, Brent Crude Oil, Bitcoin and S&P 500.

Gold and Silver remain flat with no relevant changes and are not updated.

EUR/USD and DAX show no significant developments.


The Nikkei 225 will have a dedicated deep dive in the Chart of the Week.


The EUROSTOXX50 prints its fourth consecutive positive week with a wide body, low resting on the MA20W and MA10W and high still below the level that kicked off the decline in early March.


Brent is rejected from its recovery attempt and collapses violently, breaking the MA10W and closing fractionally below last week’s low.


Bitcoin marks its second consecutive week of higher highs and higher lows but is rejected at the MA20W.


The S&P 500 prints a new all-time high with an exceptionally large bullish candle and the widest weekly range since April 2025.


Let’s go into a bit more detail and try to figure out what lies ahead for next week.

Read More →

The Hunt: FTSE MIB Week 15

Weekly monitoring of the Italian benchmark index.

Why do we do this?

Check out our strategy page.


My proprietary DBBT indicator identifies misalignments between current price and expected technical level on major indices.

Every week, the FTSE MIB is in our crosshairs.

The hunt is on.


The rally is not slowing down.

The FTSE MIB closes the week at 48,869.43, a new multi-year closing high, with a high of 48,957.89 also a record. Roughly 1,260 points above last week’s close.

In our latest analysis we flagged potentially toppish conditions and the system had gone flat.

The market responded with yet another strong rally week, the third consecutive one with higher highs and higher lows.

As always, let’s dig into what happened and what the numbers are telling us.

Read More →

Chart of the Week: Eurostoxx50

Your weekly appointment with the world’s most followed charts.

This week we chose the Eurostoxx 50 as Chart of the Week not because it stood out particularly, but due to the lack of actionable setups from the other assets we follow. Gold and Silver stalling, DAX, FTSE MIB and S&P 500 flat.

The Eurostoxx 50 comes into play as it approaches a long signal, having shown more momentum than the DAX and stronger relative strength.

A configuration that, while not explosive, deserves a closer look.

Let’s see what the charts tell us.

Read More →

Charts Flash: Week 15/2026

Quick observations on the charts that caught our eye this week.


This week’s flash covers EUR/USD, Brent Crude Oil, Bitcoin, S&P 500, DAX and Nikkei 225. Gold and Silver remain flat with no relevant changes and are not updated. EUR/USD prints a large bullish candle clearing the MA50W, MA10W and MA20W in one shot. Brent is violently rejected from the weekly high with the range back above 23%, closing near the MA10W. Bitcoin moves back above the MA10W with the cross on the MA20W, but the range remains tight: the compression continues. The S&P 500 produced a textbook swing from the MA50W closing above the MA20W, recovering in one week the negativity of the previous three. The DAX loses momentum after the rally from the MA100W. The Nikkei 225 explodes with a massive bullish candle, comfortably surpassing the target from our Chart of the Week last week: all-time highs are now in sight.

Let’s go into a bit more detail and try to figure out what lies ahead for next week.

Read More →

The Hunt: FTSE MIB Week 14

Weekly monitoring of the Italian benchmark index.

Why do we do this?

Check out our strategy page.


My proprietary DBBT indicator identifies misalignments between current price and expected technical level on major indices.

Every week, the FTSE MIB is in our crosshairs.

The hunt is on.


Another short week, another bull run.

The FTSE MIB posts a new closing high for 2026 at 47,609.36.
The market seems to be back to shrugging off the real or perceived dangers of the war in Iran, every day everything and its opposite is said and we are back to good news is good news and bad news is good news.
The weekly high at 47,770.38 surpasses the previous top at 47,650.97 but the market fails to close above it.
Let’s try to understand if this is just a coincidence or if at these levels prices are starting to look a bit stretched.

Read More →

The Hunt: FTSE MIB Week 13

Weekly monitoring of the Italian benchmark index.

Why do we do this?

Check our strategy page.


My proprietary DBBT indicator identifies misalignments between the current price and the expected technical level on major indices.

Every week, the FTSE MIB is in our crosshairs.

The hunt is open.


Last week we left the FTSE MIB in a neutral stance, with shorts closed and a loss of bearish momentum still to be confirmed.

The confirmation came. In spectacular fashion.

A short week due to the Easter holidays, just 4 sessions with Friday closed. The new week reopens on Tuesday after the Easter Monday closure.

In just 4 days the market produced a bullish candle with a massive body that historically has almost always completely changed the short-term technical structure.

Read More →