


Weekly appointment with the world’s most watched charts.
New all-time highs for the Japanese index: intraday top at 59,332.43 and record close on both the daily and weekly timeframes at 58,850.27.
But is everything as bright as it seems?
Let’s find out together whether the Nikkei is showing signs of a bubble.
Bulls vs Bears
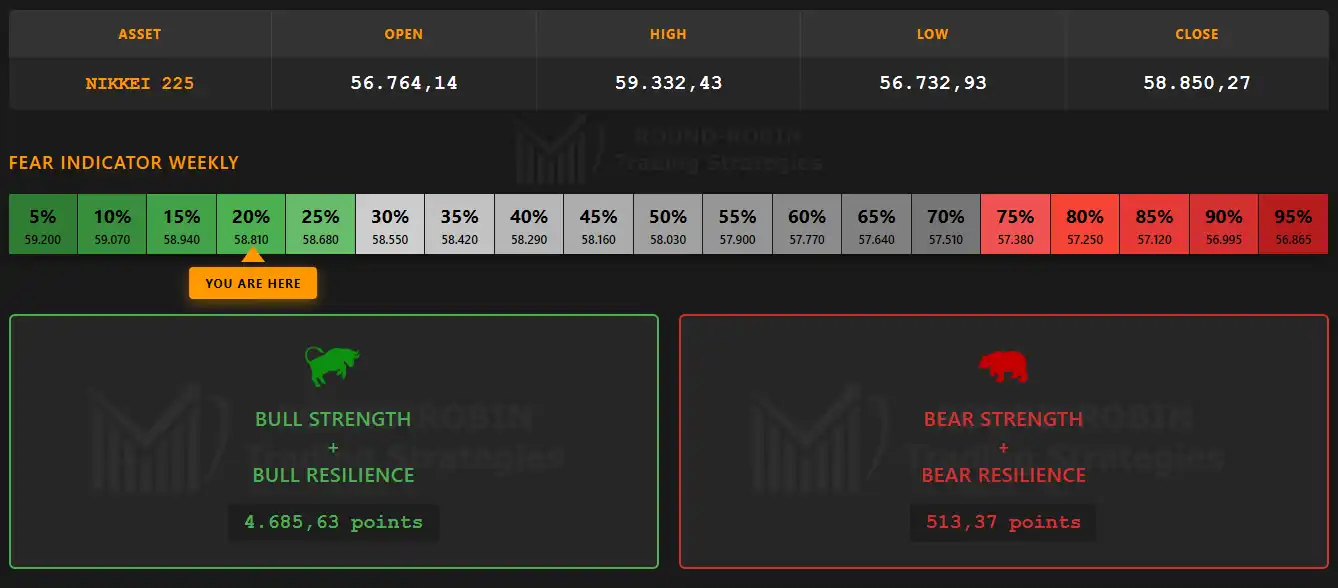
infographic: Nikkei225 – Bulls vs Bears
Another week dominated by the bulls: total control, never in question.
A market where nobody fears anything can happen, with the Fear Indicator firmly in complacency territory – nobody is hedging.
Let’s dive into the analysis and put the trend that started in 2020 under the microscope.
The Big Picture
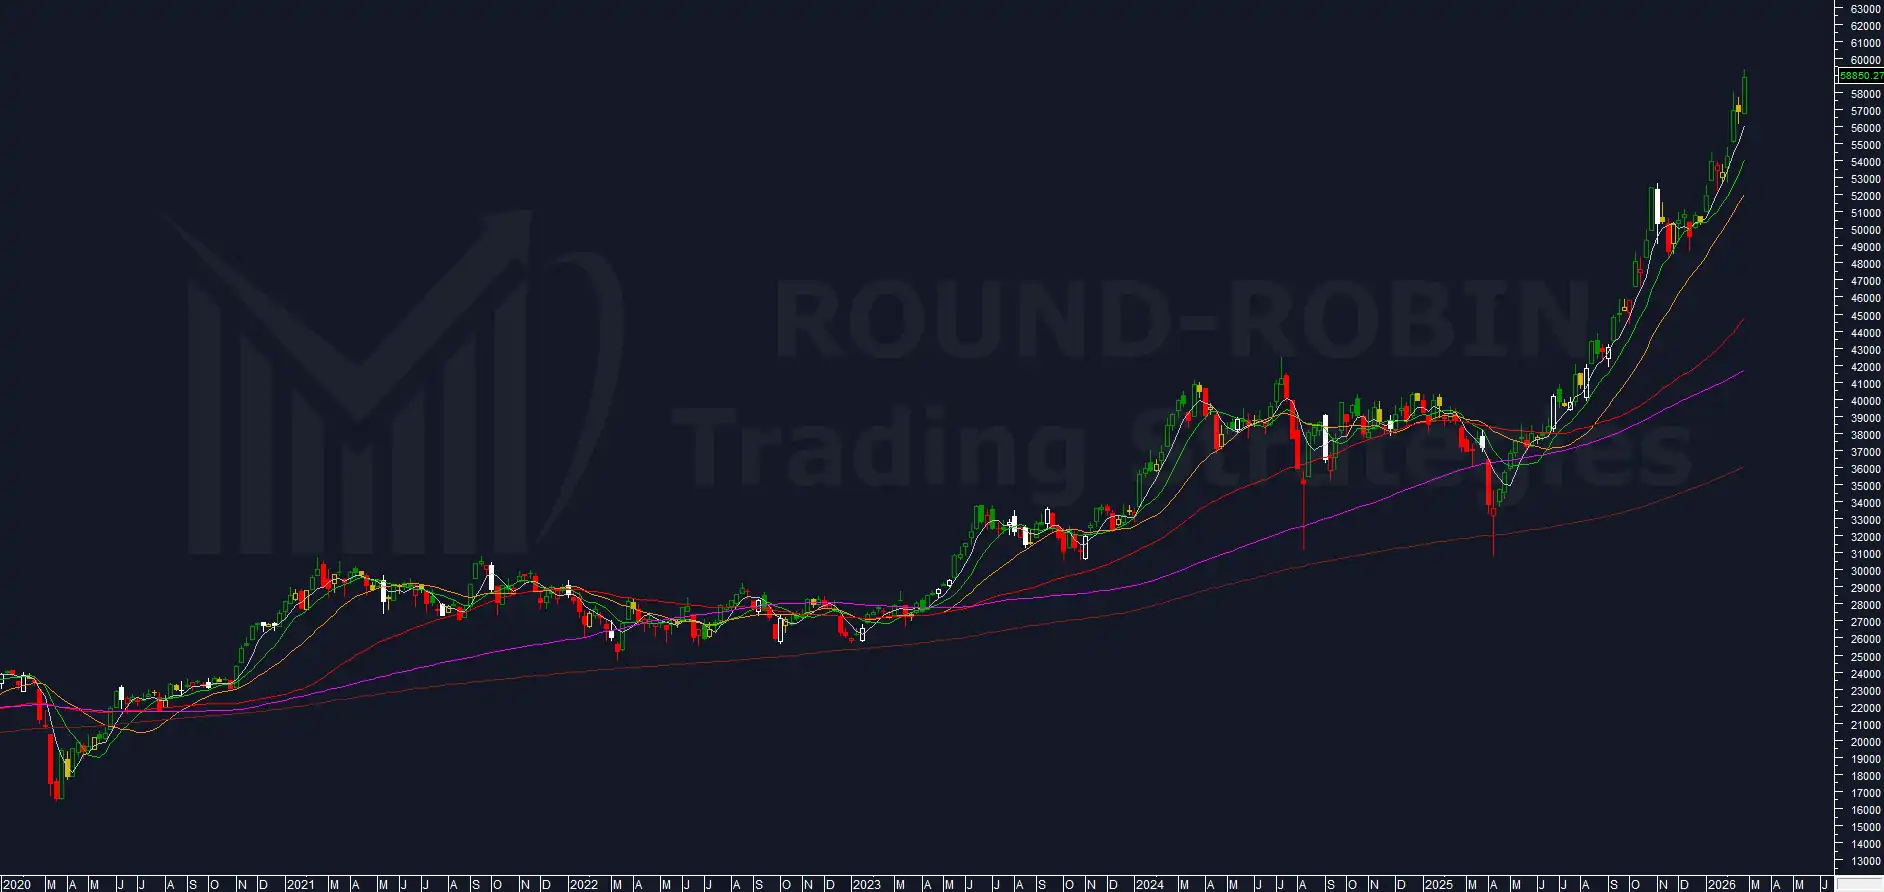
chart: Nikkei225 weekly
The Nikkei 225 is overextended above all moving averages, from the fastest and steepest (MA5W) to the MA200W.
It is precisely this slope that provides important information:
The slope of the MA5W is unsustainable in the short term.
The slope of the MA20W is unsustainable in the medium term.
Important caveat: this does not mean the Nikkei 225 will fall, but that at the very least it will need a consolidation pause.
The first takeaway is therefore: not bullish in the short/medium term on the weekly timeframe.
But it is the MA200W we want to focus on.
Since 2020 it has consistently supported the trend, allowing prices to launch a new bullish move each time.
The last touch occurred in April 2025 around the 30,000 area, and from there prices have nearly doubled (+92.68% to be exact).
Overextension on the MA200W
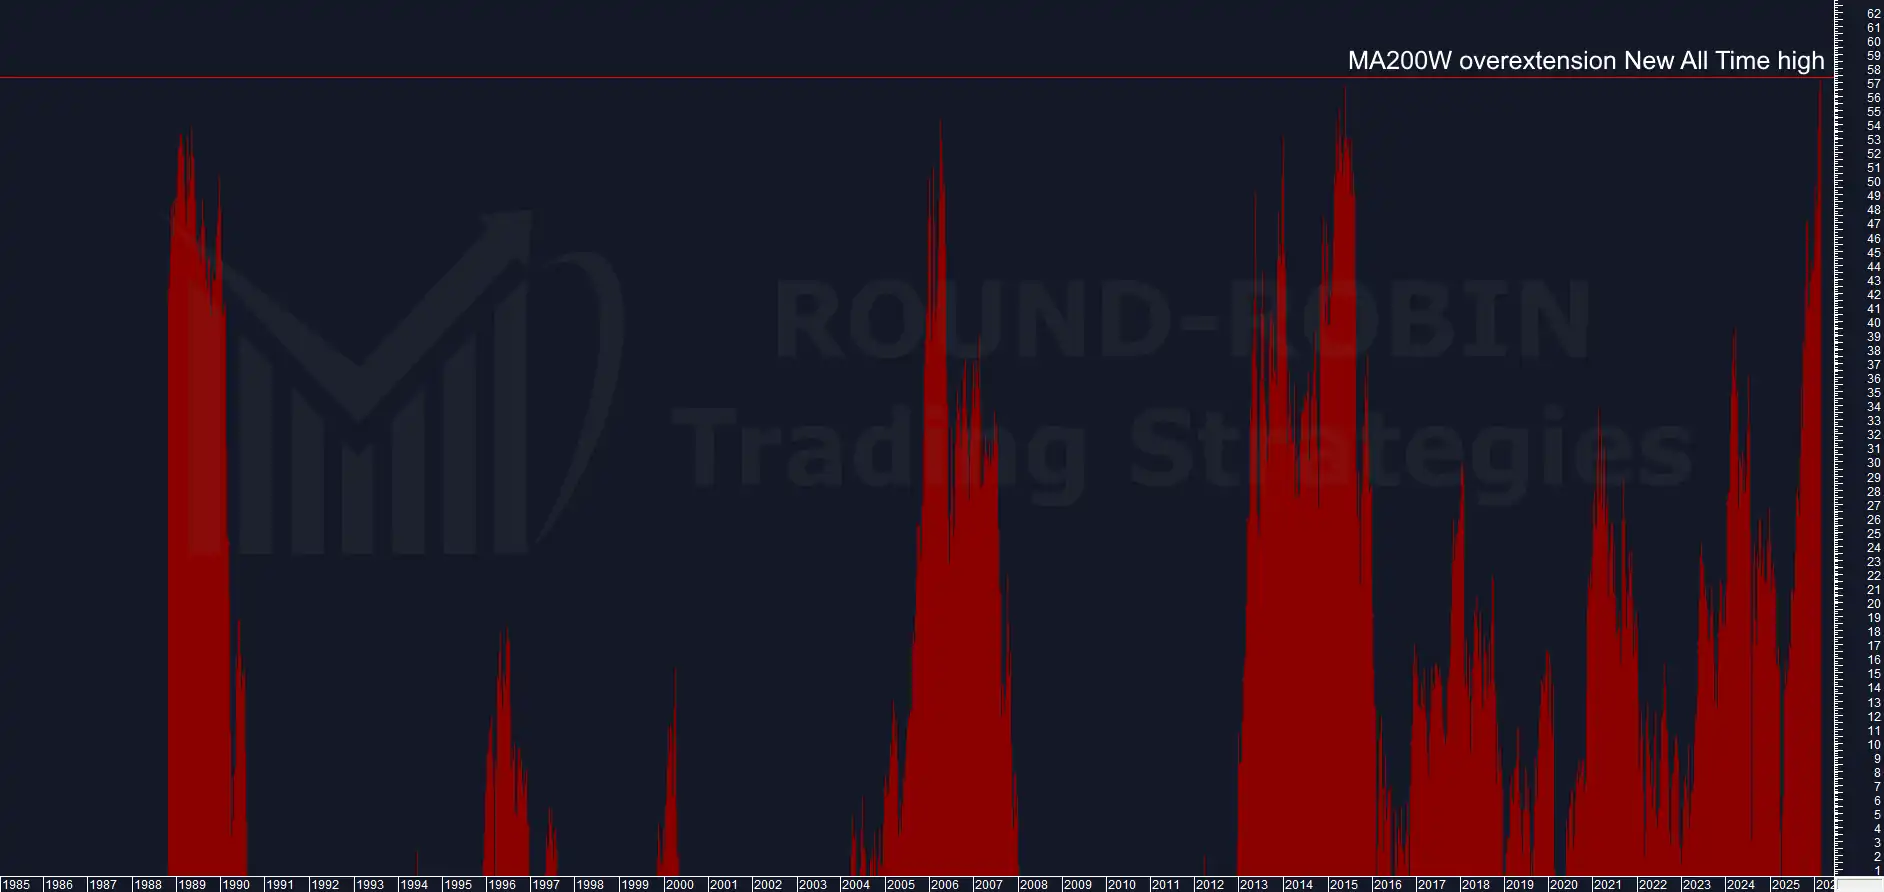
chart: Nikkei – weekly overextensions on MA200W
This is the real reason we chose the Nikkei 225 as Chart of the Week.
The overextension on the MA200W has set a new all-time record at 57.39%.
The history of such exceptional events must answer these questions:
1) How long can it stay at extremes (values >50%)?
From a few weeks up to 6 months.
The Nikkei is in its third week above 50%.
With the index “flat” and the MA200W rising approximately 200 points per week, the time limit for this excess condition can be estimated at 20–24 weeks (roughly coinciding with the June technical expiries).
2) What happened the last time the overextension set an all-time record?
Looking at the weekly chart, it marked a precise index top.
In one instance it was “toppish”: the index did not fall in the short term but stopped rising and began rounding over before the bear market.
3) What happened at the end of the excess period?
The overextension fell below 50% almost always accompanied by a decline in the index.
After this decline, prices bounced and resumed their rise, in some cases reaching new highs.
4) How long before the overextension was fully reabsorbed?
2–3 years.
Currently, the first year is about to end.
5) How was the overextension reabsorbed?
Always through a bear market of varying duration and intensity – even in cases where the overextension was not this extreme.
BCP3
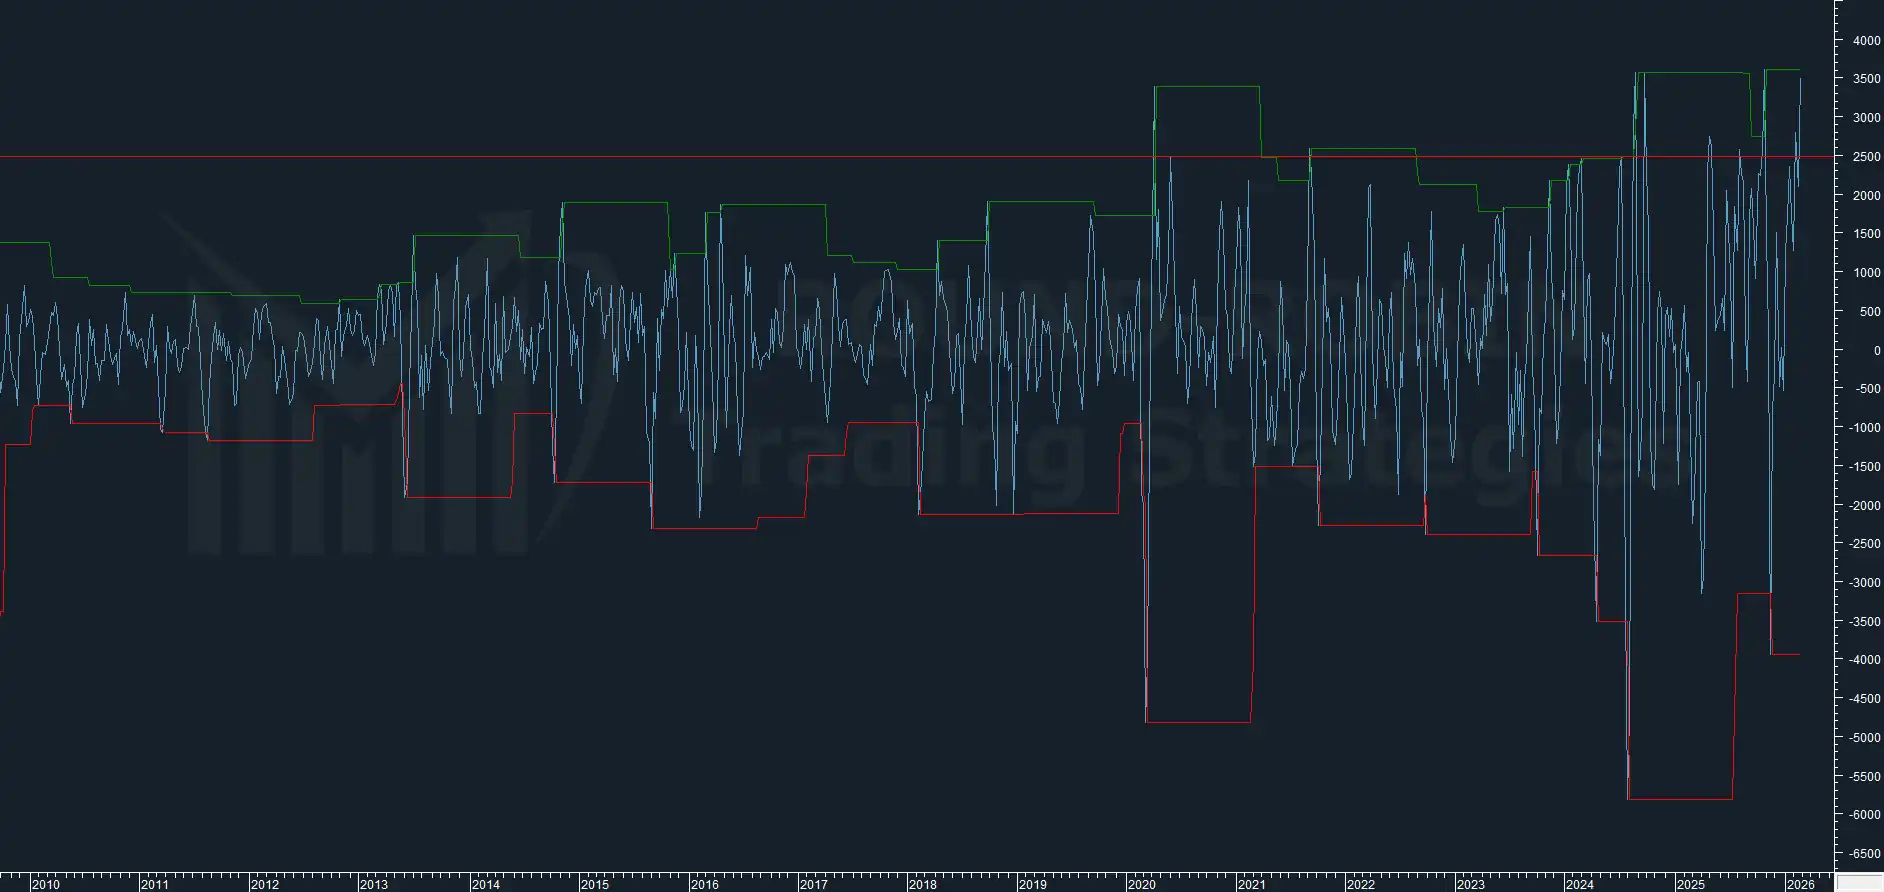
chart: Nikkei – BCP3 weekly 2015-2026
Our proprietary indicator measuring market swings shows steadily increasing volatility over the past 10 years, with downside extensions in point terms growing relative to more stable upside extensions.
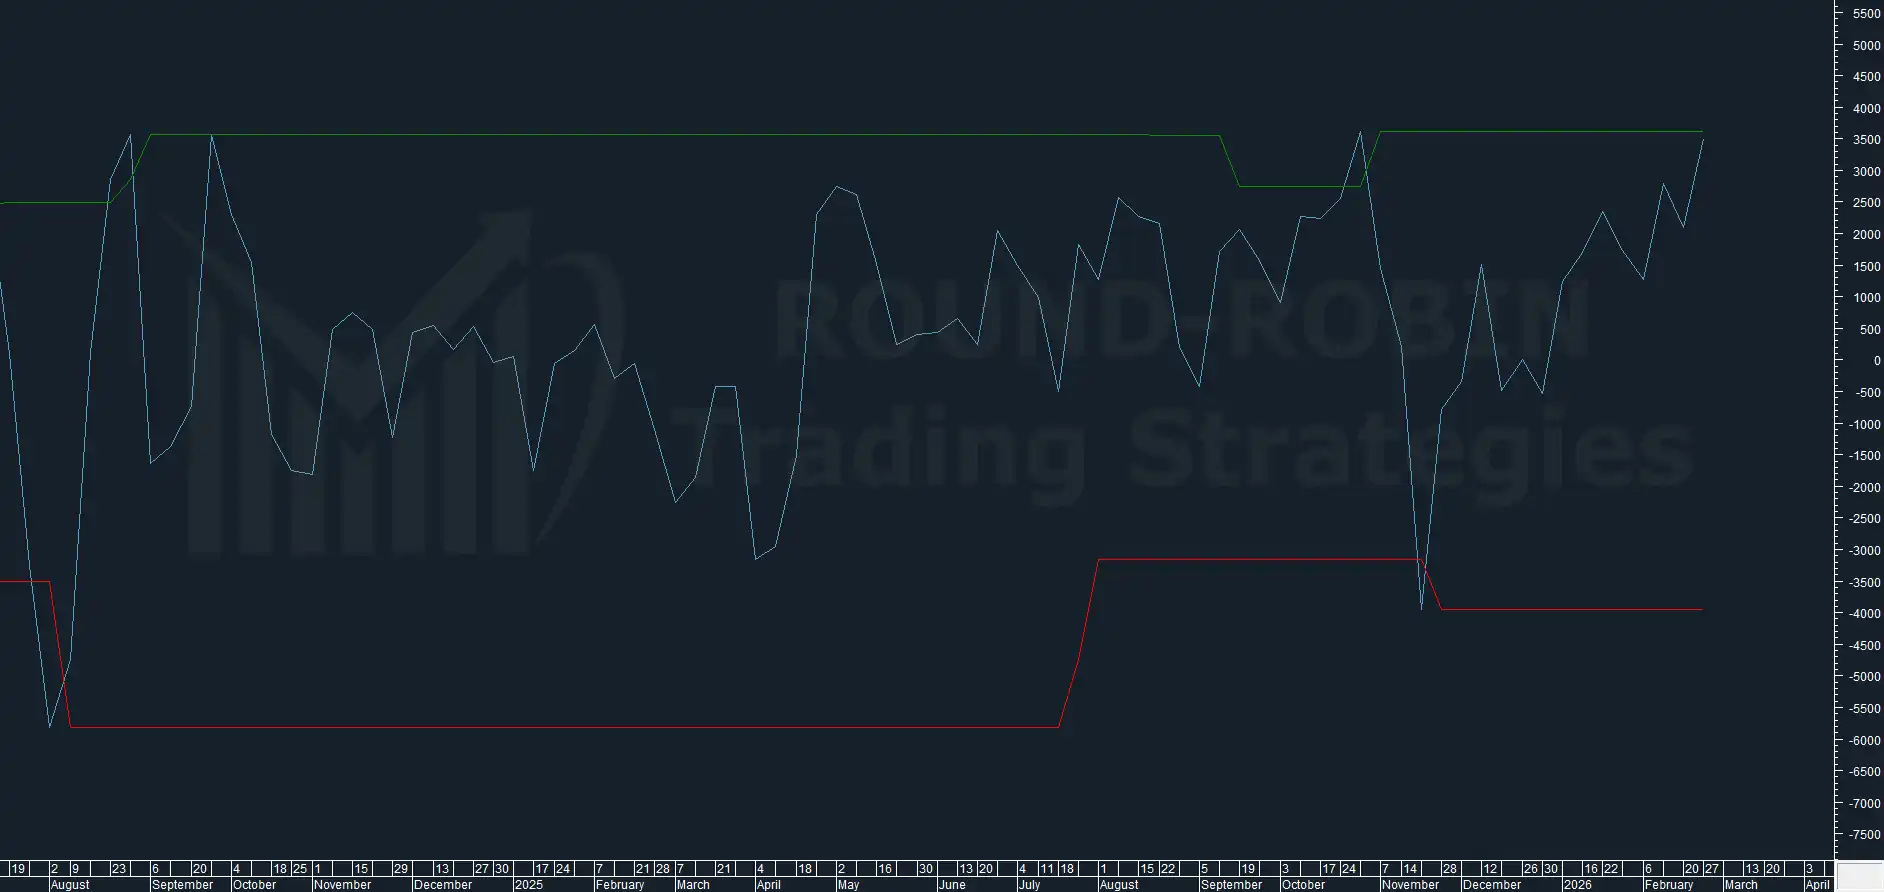
chart: Nikkei225 – BCP3 weekly 2024-2026
And it is by looking at the upside that the key data point emerges: the current value of 3,500 points has been reached only 3 times during this bull market, while values above 2,500 occurred only during the 2021 rally.
All of these swings ended with an extended retracement.
This suggests a short/medium-term decline exceeding 6%.
Conclusions
Let’s put the pieces of the puzzle together.
Short/Medium-Term Scenario
A) At least not bullish – the BCP3 also suggests bearish.
B) Reduction of excesses with a drop below 50% overextension on the MA200W.
C) Historically this has translated into the Nikkei 225 being at a top or in a topping phase.
D) From an operational standpoint, non-bullish strategies can be adopted: OTM Short Calls, or ATM Long Puts if you give weight to the BCP3.
Long-Term Scenario
E) Once the excesses are exhausted and the overextension falls back below 50%, the index has historically resumed its rise – a final leg that can even produce new highs.
F) If history repeats, this is where the most important trading window will open.
The rally toward new highs tends to push the overextension back above 50% – especially if the recovery is swift, but also with a more fragmented, stop-and-go advance, provided it is large enough to bring prices back into that excess zone.
At that point, the statistical conditions for a bear market return to those described above.
The return of the overextension above 50% thus becomes the first signal to build long-term bearish positions (Short Futures, Long Puts) targeting the full reabsorption of the overextension on the MA200W.
Alternatively, if the excess does not reform, only a strong bearish signal after new highs should be considered as a short entry level.
Full reabsorption, based on historical precedents, is unlikely to occur before 2027.
In the short term there are two paths:
Aggressive Bearish – Based on the indicators, starting with the BCP3: immediate short for the coming week (Short Future or ATM Long Put, 1–3 month expiry) with position sizing that allows pyramiding entries, to be reassessed at each weekly close.
Non-Bullish – OTM Short Calls at 3–6 months; exposure and hedging should be reviewed weekly.
The Nikkei 225 is testing overextension levels that have historically always preceded a bear market. The overextension on the MA200W is the metric to monitor – we don’t know when, but it has happened every time.
Soon only members will be able to access this content. Sign up for free.
Leave a Reply