


Weekly appointment with the most followed charts in the world.
Last week we identified the setup and defined the two possible triggers: a bull trap above 119.13 or a direct rejection from the 112.19-119.50 area with a weekly close below 106.
The trigger has fired.
On Monday March 23, with Brent still above 114, Trump announced the suspension of attacks on Iranian energy infrastructure and the start of negotiations. The drop was immediate: within minutes the front month lost over 13%, pushing prices down to 93.45. Iran later denied the existence of any talks, and the market recovered part of the lost ground. All of this in a context already made chaotic by the contract rollover.
The selloff was followed by a recovery, but the recovery did not change the structure. At the weekly close Brent settled at 105.32: it bounced off the lows but failed to reclaim the supply area.
The short signal was generated at Friday’s close. Let’s see what the charts are telling us.
Big Picture
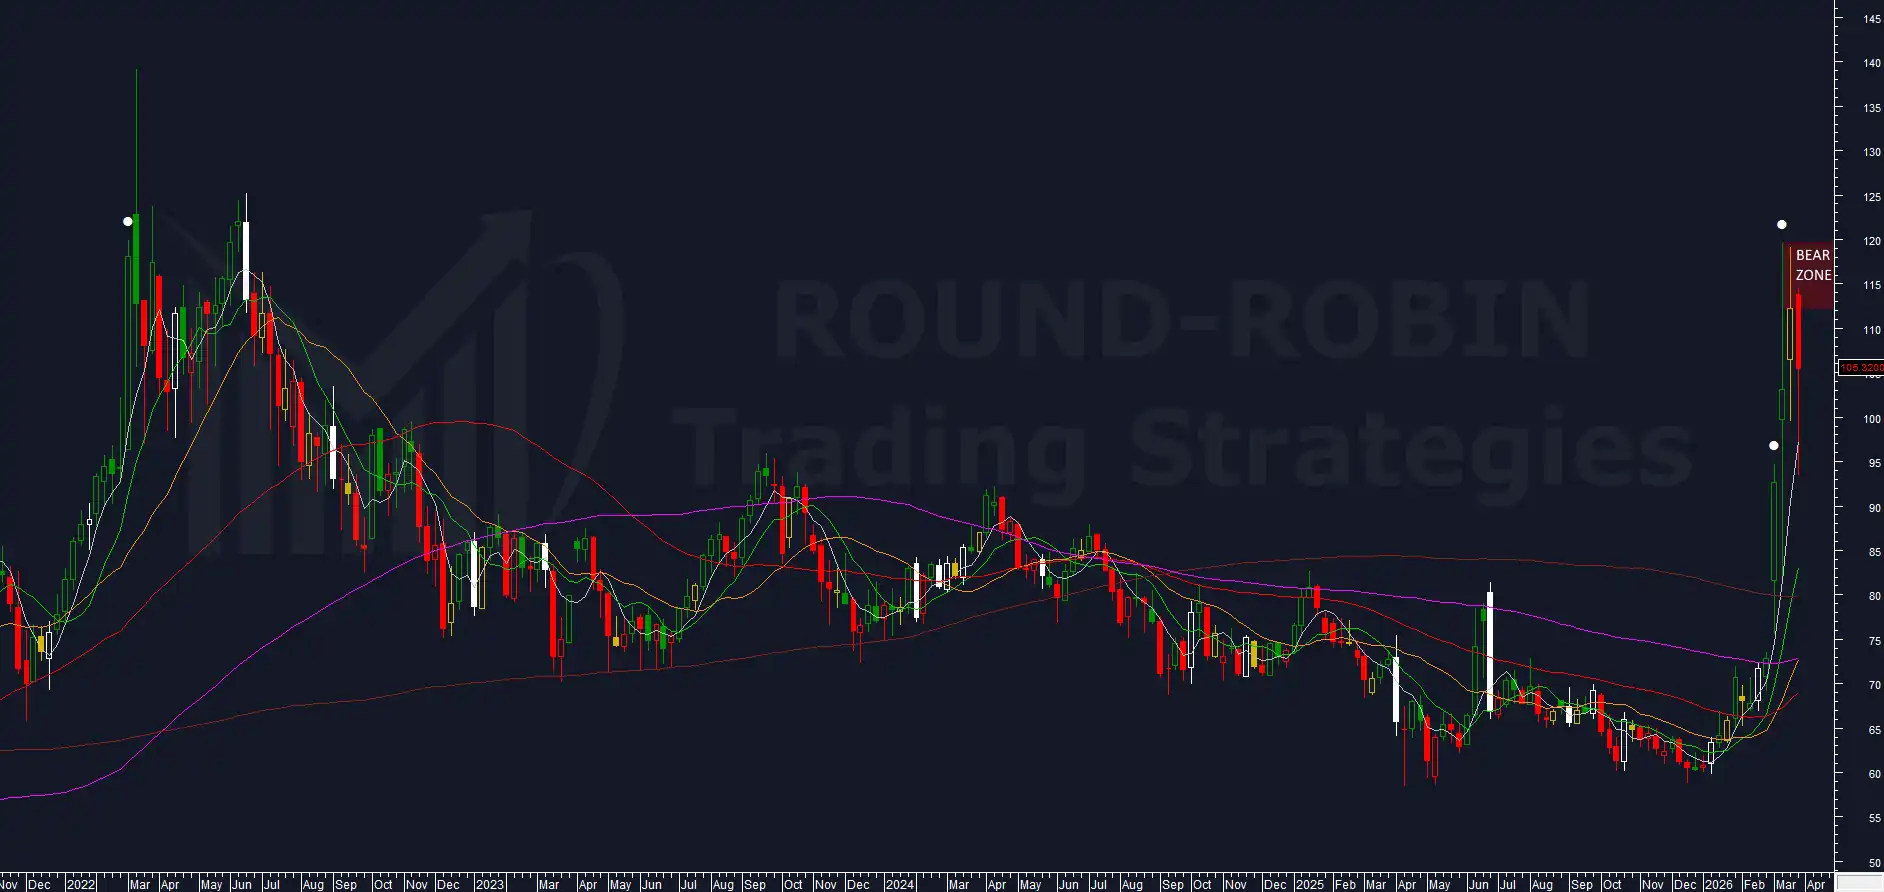
chart: Brent Crude Oil weekly
Let’s start from where we left off.
Last week we had an inside candle whose body was entirely contained within the long upper shadow of the March 13 week (range 103.14-119.50). The bears were defending the upper area, the bulls had invaded the shadow but failed to break through.
This week the market gave its answer. Prices entered the 112.19-119.50 range, the area where we said to focus attention, and from there the crash began. The rejection was violent: from the weekly high around 114, Brent dropped to 93.45 before recovering.
The weekly candle shows lower highs and lower lows compared to the previous one: this is the first structural sign of weakness after weeks of unidirectional strength.
The weekly close at 105.32 places the market in an intermediate zone. It is not near the highs, which rules out strength. But it did not close on the lows either: the bounce from 93.45 to 105 was real, the buy-side is still active and should not be ignored.
The result is a phase of unstable equilibrium, where the structure has cracked but is not yet definitively broken.
Volatility Indicator
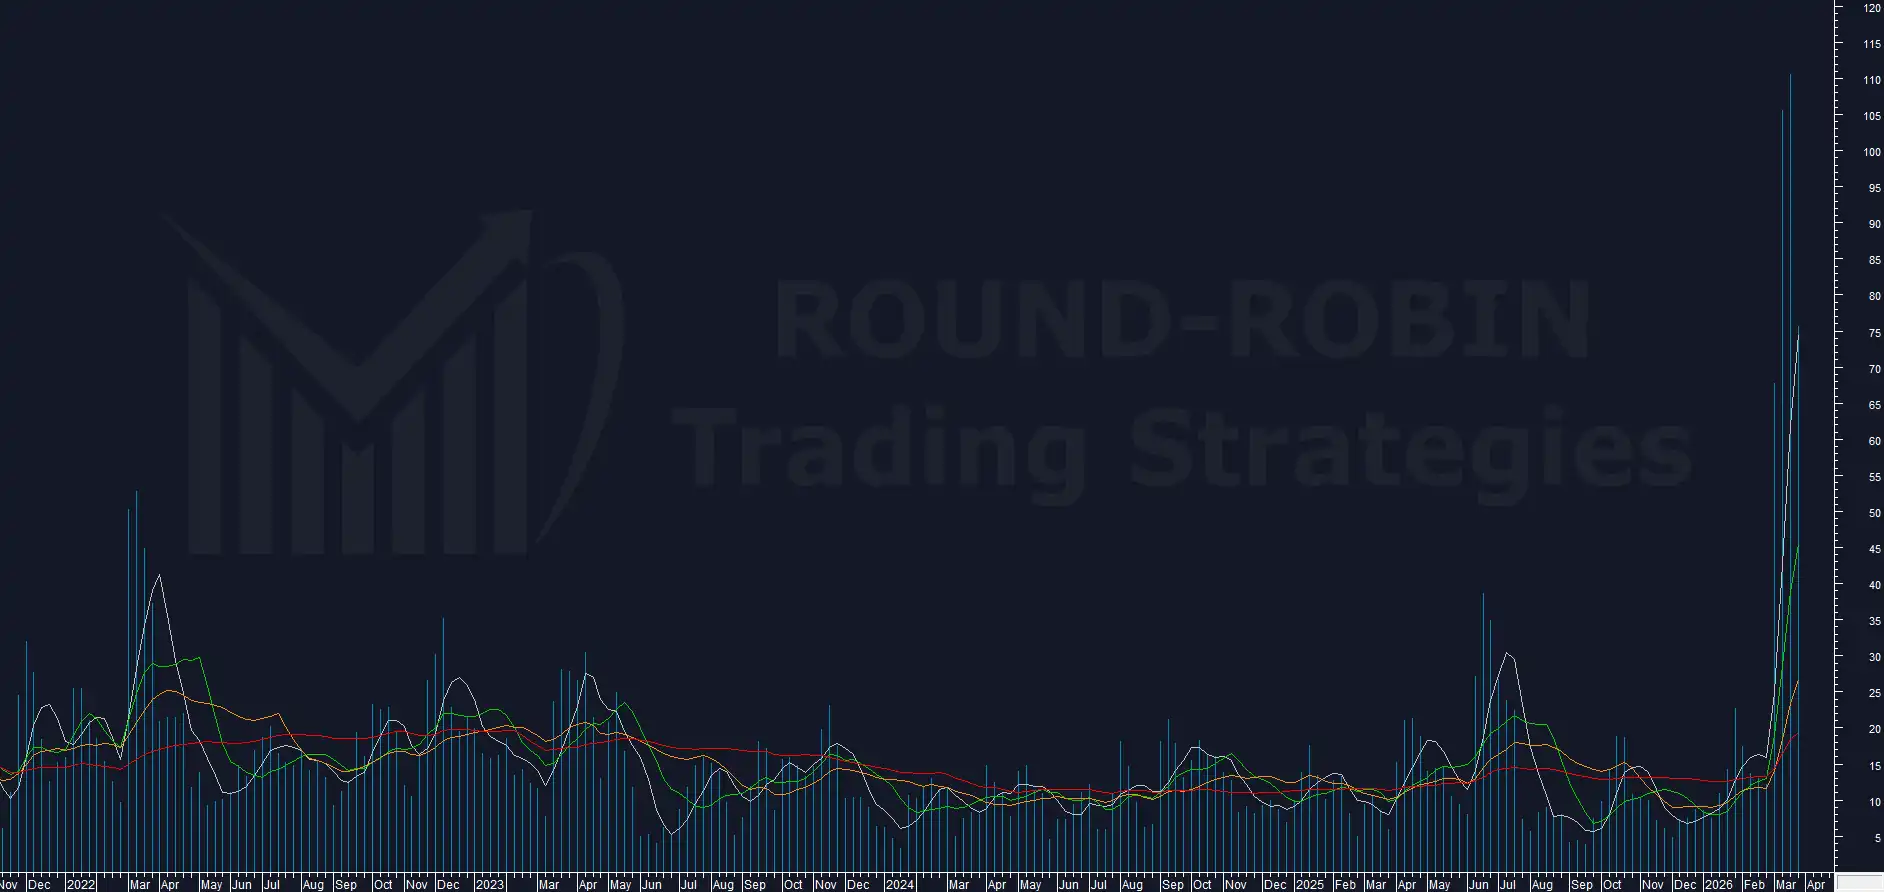
chart: Brent Crude Oil weekly – proprietary Volatility Indicator
Despite the drop from 110 to 75, our Volatility Indicator remains at elevated levels, well above its moving averages.
This is the single data point that best measures how dangerous this market is right now. Brent is still in an extreme volatility regime, even if it is pulling back from its peak.
To put it in perspective: in 2022, during the spike triggered by the invasion of Ukraine, the peak was 52.90. We are still on a different level entirely.
Bodies Counter
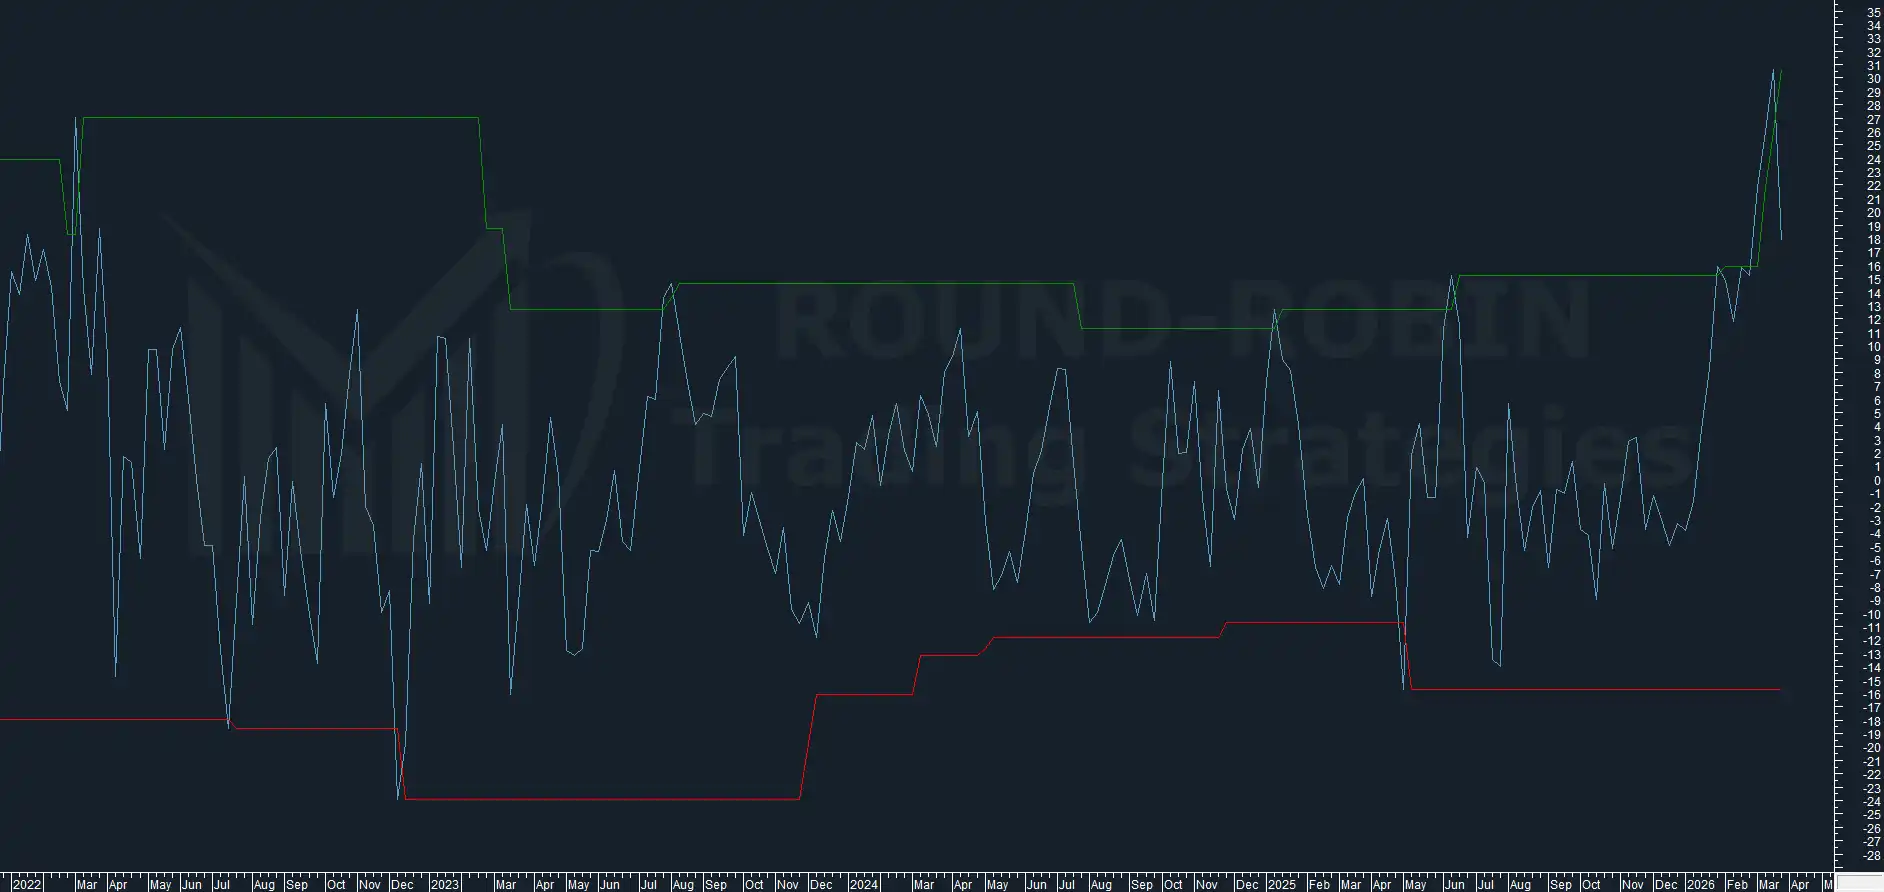
chart: Brent Crude Oil weekly – Bodies Counter
The Bodies Counter has hooked, exactly as it did in 2022 at a similar extreme.
This behavior reinforces the toppish reading: when the indicator forms this pattern at extreme levels, historically the market has then corrected.
NFC Indicator
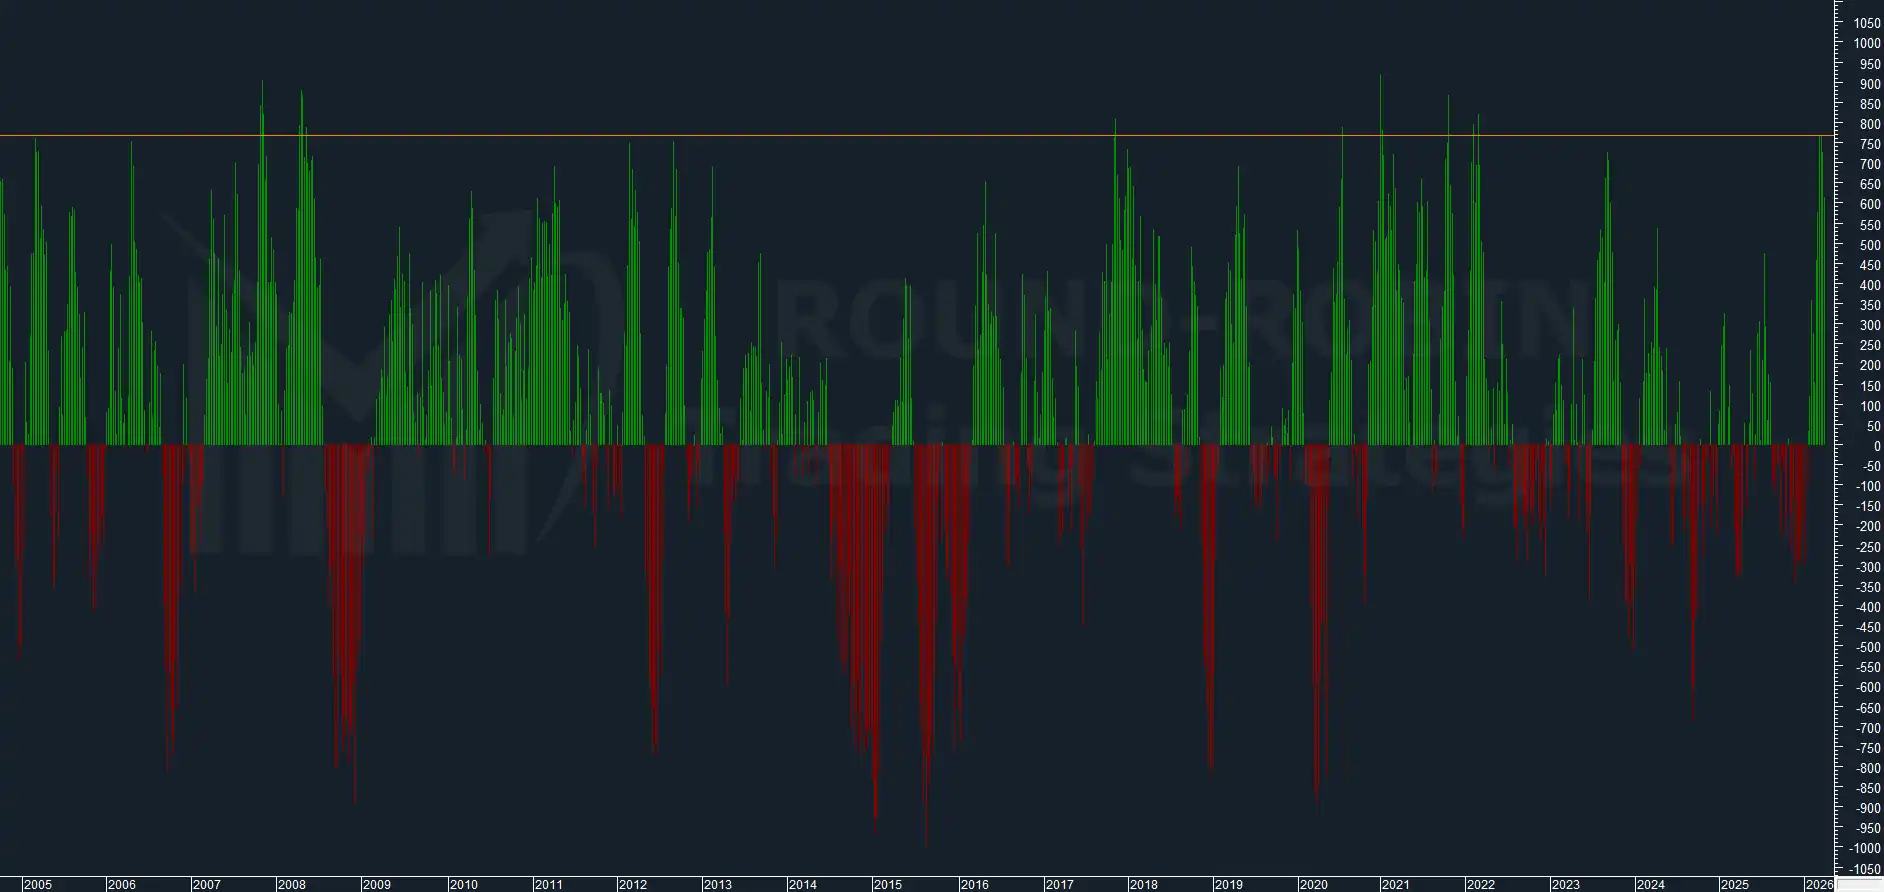
chart: NFC – Brent Crude Oil weekly
The NFC shows significant peaks even on a twenty-year scale. These are not ultra-rare extremes, but when they are aligned with the Bodies Counter and the other indicators, the convergence matters more than any single value.
And that is precisely the point: we have independent indicators, built on different calculation logics, almost all pointing in the same direction.
MA10W Overextension
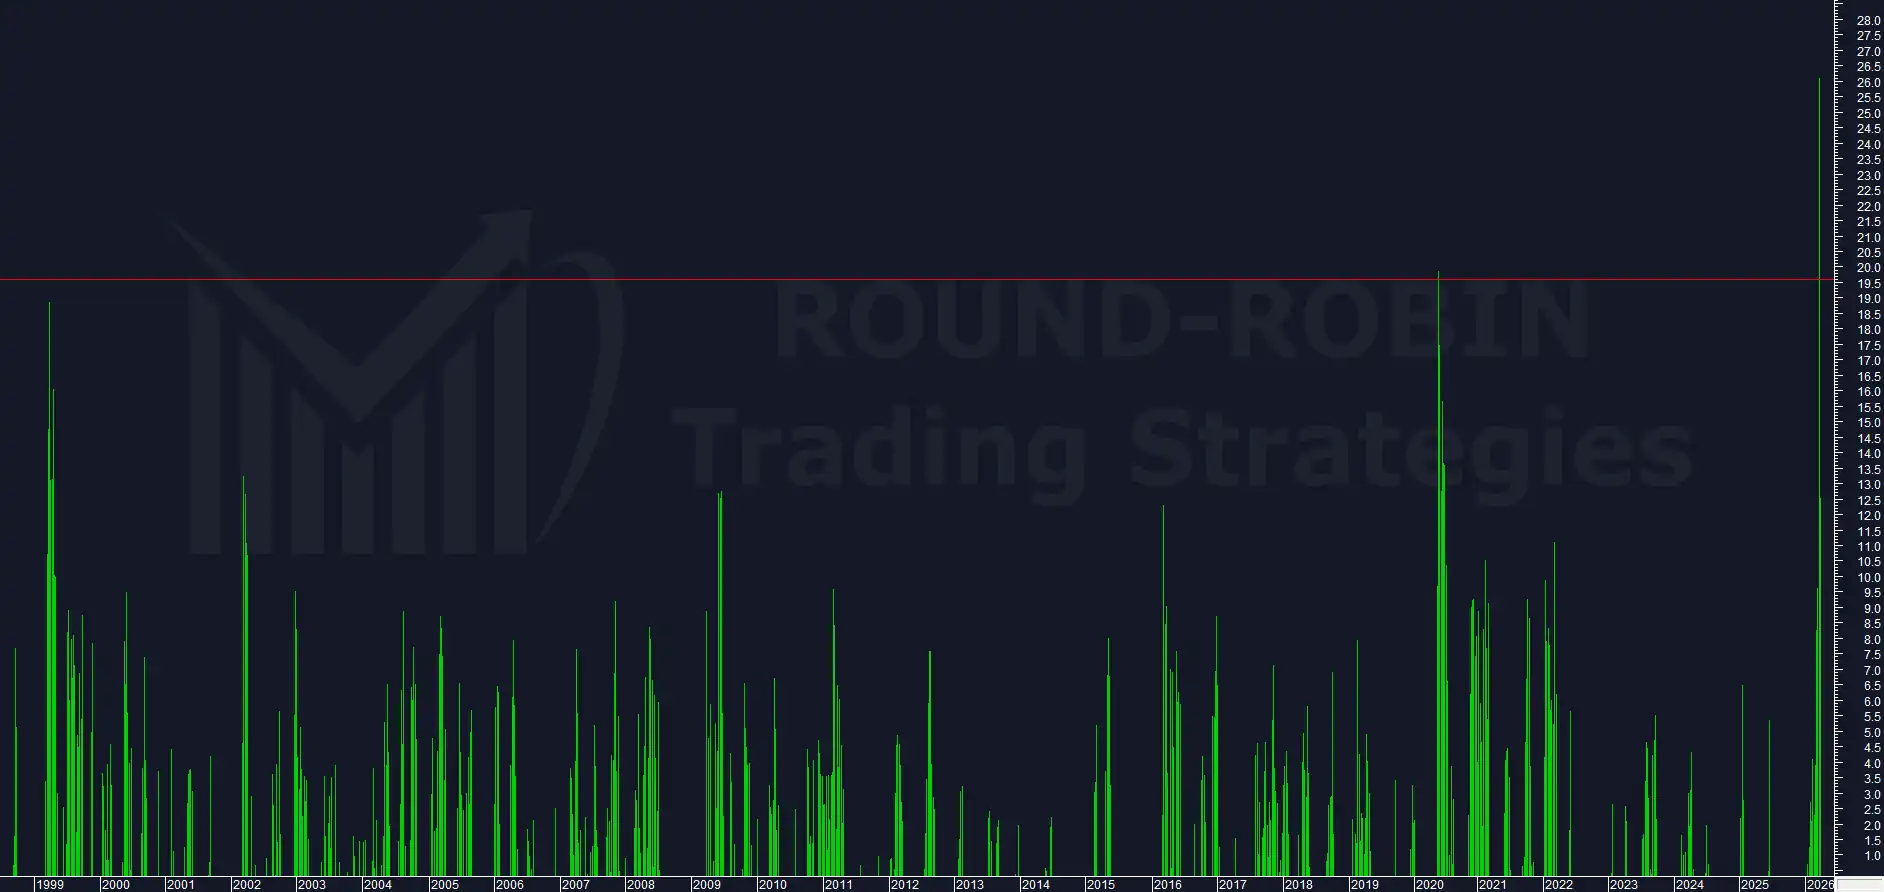
chart: MA10W overextension – Brent Crude Oil
Last week we highlighted a spike to 26.14%, historically unsustainable.
This week the values have more than halved: from 26.14% down to 12.44%.
The pullback is significant, but context puts it in perspective: four weeks ago we were at 2.3%. The 12.44% remains an elevated value in absolute terms. The excess is unwinding, but it has not yet normalized.
MA20W Overextension
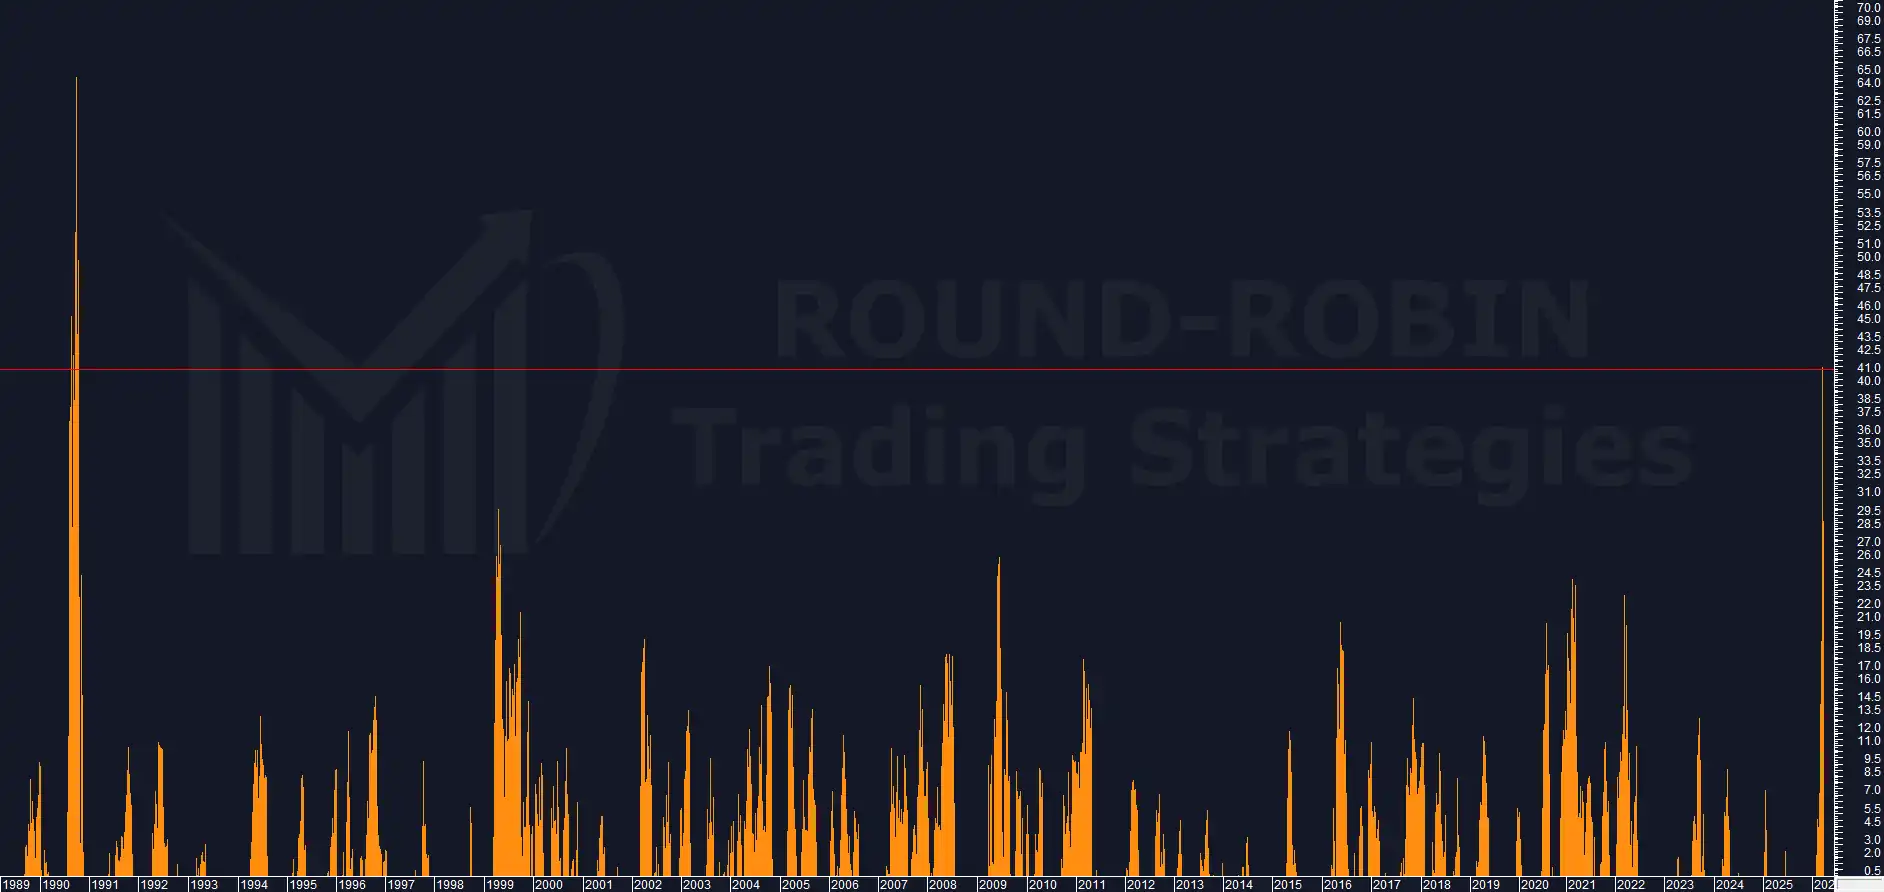
chart: MA20W overextension – Brent Crude Oil
Same trend on the MA20W: from 41.01% last week down to the current 28.59%.
The reduction is substantial, but 28.59% remains among the highest values ever recorded. The overextensions confirm: the market is pulling back from the excess, but it is still in anomalous territory.
Conclusions
The trigger we had been waiting for since last week has fired. The market entered the 112.19-119.50 area, was rejected, and at Friday’s close all elements of the system were aligned for the short signal.
This is not a signal without caveats. The bounce from 93.45 to 105 was strong: the buy-side is present and has proven it. The weekly close did not confirm a downside break. These are factors that work against the trade and must be kept in mind.
On the other side, Volatility Indicator, Bodies Counter, NFC and overextensions on both MA10W and MA20W are independent indicators, uncorrelated by calculation method, and they all converge in the same direction: Brent is in a toppish condition.
The position is short, with entry around 106, stop at 125.5 and target at 80.
The risk/reward ratio is approximately 1:1.33. The convergence of such different indicators on a toppish reading makes the trade structurally valid, even in a market where volatility can make the path to the target anything but linear.
As we wrote last week: the setup was there, the trigger was missing. Now the trigger has arrived.
Leave a Reply