


Weekly monitoring of the Italian benchmark index.
Why do we do it?
Check our strategy page.
My proprietary DBBT indicator identifies misalignments between the current price and the expected technical level on the main indices.
Every week, the FTSE MIB is in our crosshairs.
The hunt is on.
A week that overturns the balance compared to the previous analysis.
The picture outlined last week, in fact, pointed to a waiting phase with a bearish bias. Falling volatility, compressed range, BCP3 rolling over.
However, the market responded with a decisive bullish acceleration. The index marked a new high for the year, brushing the psychological 50,000-point threshold.
The FTSE MIB closes the week at 49,289.54.
The intra-week dynamic, however, left marks that deserve attention. Indeed, not everything that shines in the broader picture has found confirmation in the system’s indicators.
Bulls vs Bears
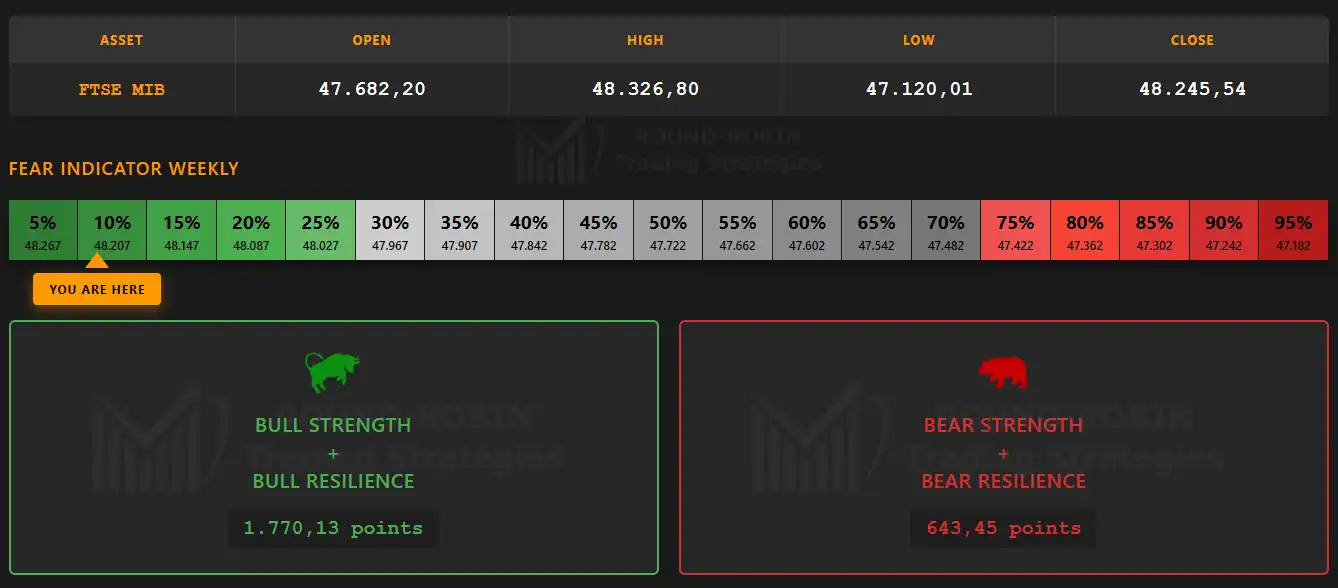
infographic: FTSE MIB weekly – Bulls vs Bears
A week that sees the bulls clearly winning. The strength ratio is roughly 2 to 1 over the counterpart.
The bears, however, did not stay still. They tried to show signs of life, pushing the weekly low down to 47,428.76 before being absorbed.
The Fear Indicator settles at 25%, in the green zone, returning a picture of widespread calm.
This reading confirms how the system’s short entry took place clearly against the broader market sentiment.
The Big Picture
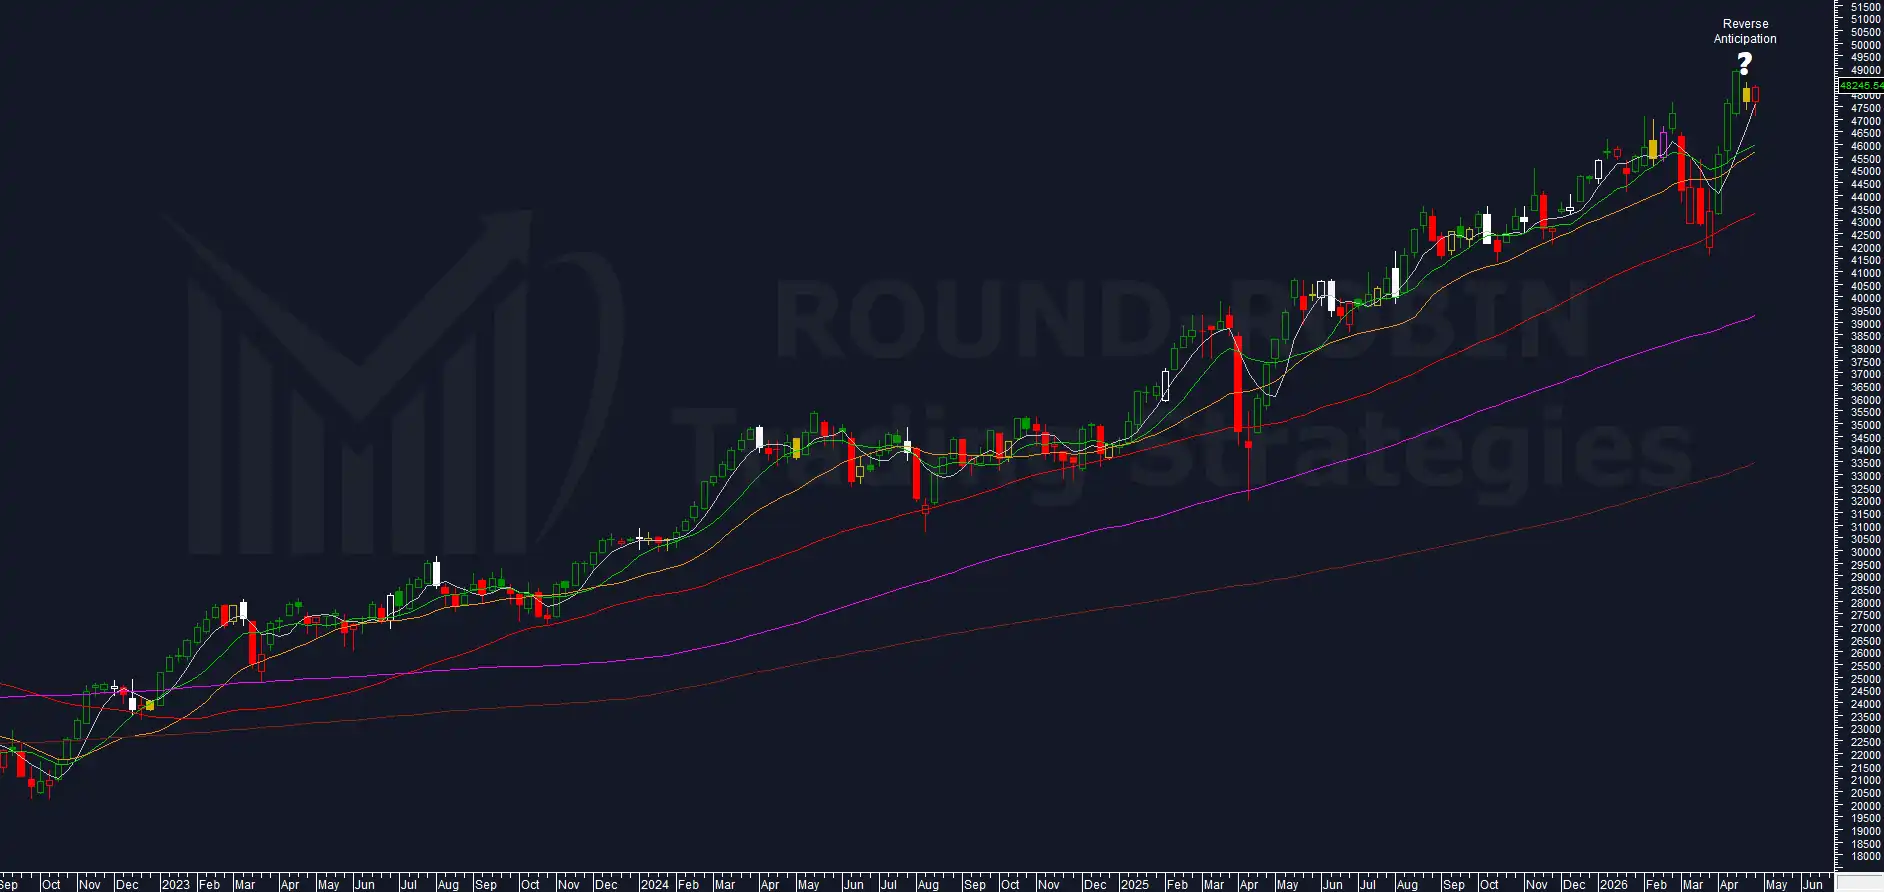
chart: FTSE MIB weekly
Higher highs and higher lows. The weekly candle shows both a lower and an upper shadow of non-negligible size.
The signal, therefore, is that of a market still nervous yet with a clear bullish prevalence.
The moving averages are perfectly aligned in a bullish configuration. Moreover, the MA5W keeps a slope that historical statistics tell us is not sustainable.
On the price levels, the weekly high at 49,898.95 takes out the previous top of April 17 at 48,957.89. The close at 49,289.54 also tops the close of that same week, set at 48,869.43. It is, therefore, the new yearly record.
However, hard to label it as a clean break, given the size of the pullback from the weekly top. Instead, it could simply be a psychological pause in front of the 50,000-point threshold.
Volatility Indicator

chart: proprietary Volatility Indicator
The indicator keeps sliding, dropping to 5.64%.
The reading is significant. In fact, despite the formal bullish extension, prices did not really go much beyond the top values of the last four weeks.
As a matter of fact, the indicator is now back at the level seen before the February 2026 correction. It is the picture of a market that has extended without truly expanding.
The weekly value, moreover, stays firmly below all the moving averages computed on the indicator itself, both fast and slow.
Range Weekly %
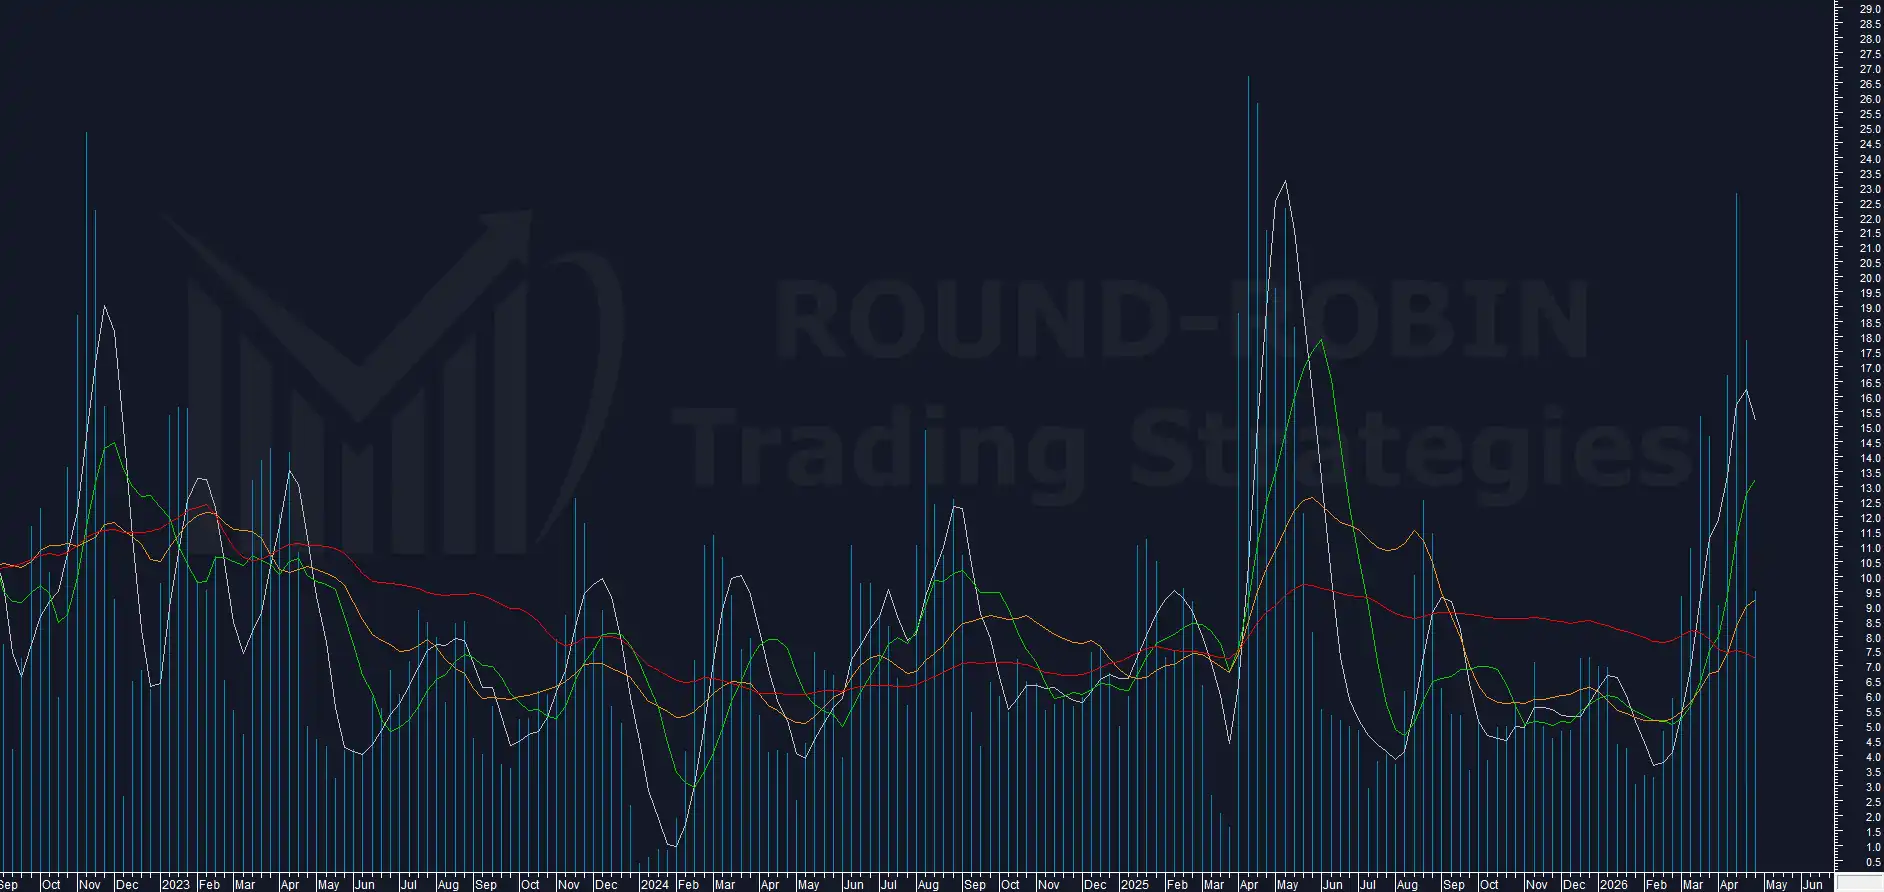
chart: FTSE MIB – range % weekly
A late surge from the indicator, which spikes back to 5.21%, the highest reading of the last four weeks.
The divergence with the Volatility Indicator carries here a precise meaning.
When a trend extension is genuine, weekly range and system volatility rise together. The width of the move, indeed, translates into new ground conquered by prices.
The opposite scenario unfolds instead when the range explodes while volatility compresses. It is the fingerprint of topping, namely a week that has burned a lot of energy just to stay in the same area.
Plenty of motion, little structural progress.
BCP3
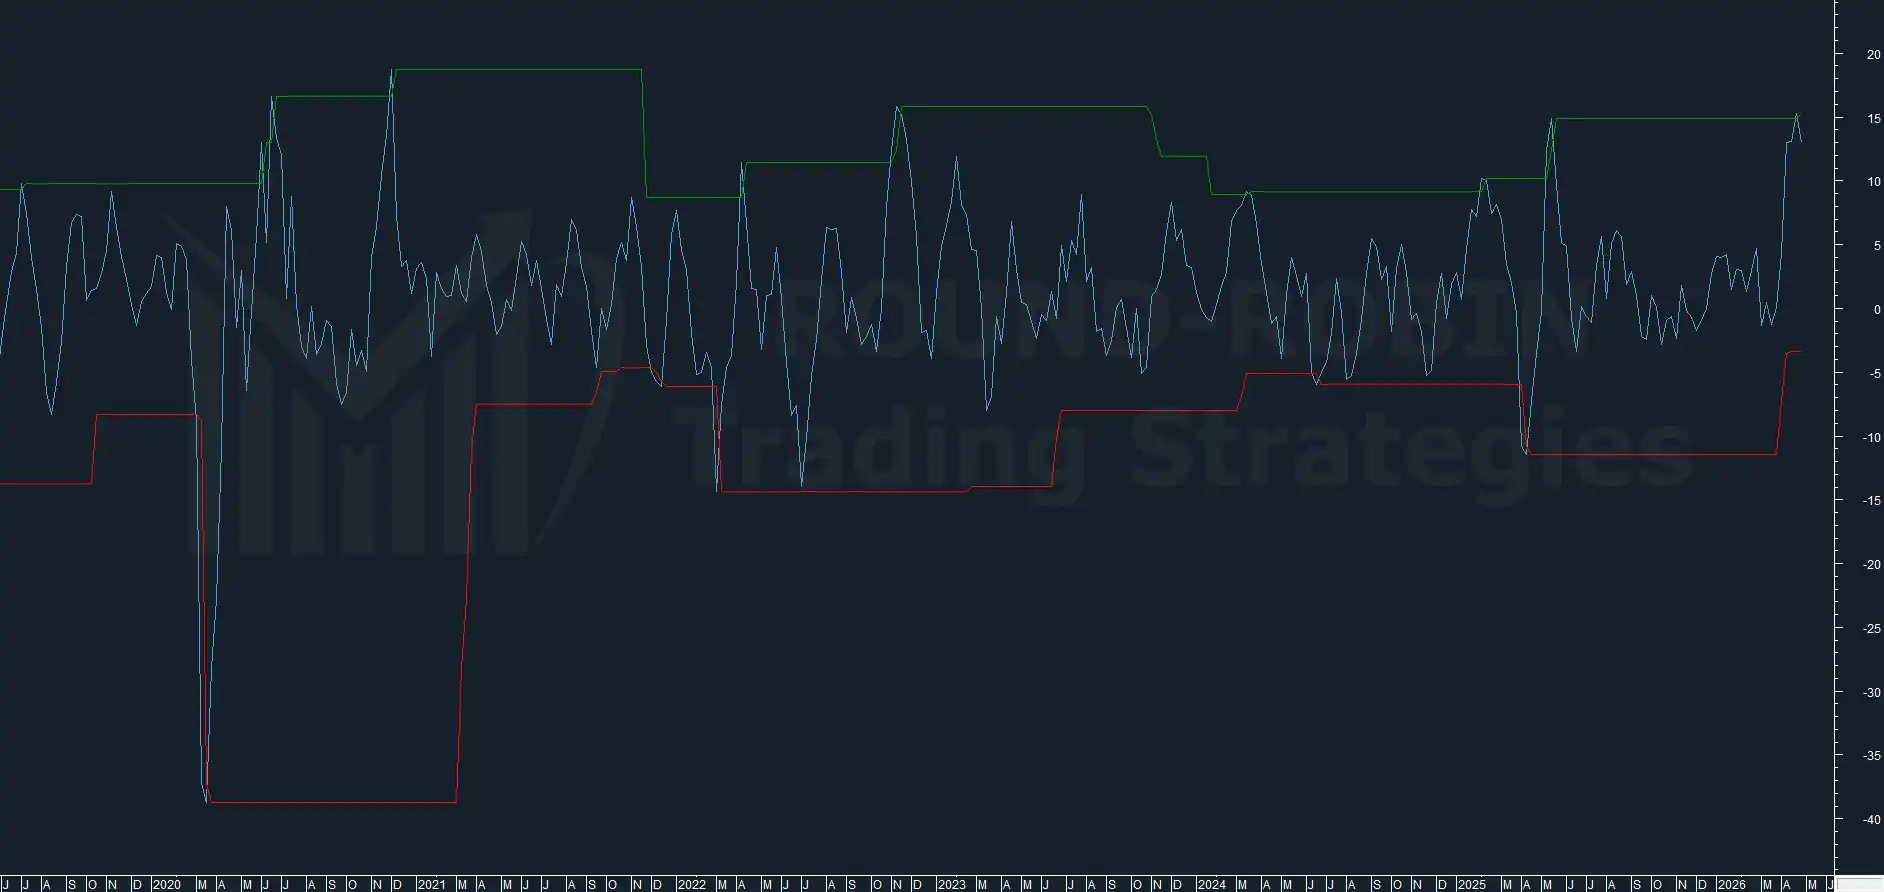
chart: FTSE MIB – BCP3 weekly
The indicator moves to 9.35%, continuing the downward path already set last week.
The most relevant fact is qualitative. The BCP3 fully ignores the price advance and keeps pointing at a bearish swing that has not even been hinted at on the chart yet.
At this point, hard to tell whether for this trend it will be a big fail of the indicator, or a bull excess that will soon present its bill.
Conclusion
Elements supporting the unsustainability of the trend were not missing, yet the market chose to ignore them and kept advancing.
The mechanics of the week, however, were anything but linear.
A negative open to the week brought the price back into contact with the daily MA20. Right after, the market restarted decisively, further accelerating with a gap up in the central session.
The last two sessions, however, gave back entirely the gains built from the Wednesday open. As a result, a structure compatible with an island reversal was isolated.
Aggregating the three candles, you get a shooting star.
Within this configuration, our system considers an at least intra-week pullback almost inevitable in the upcoming week.
On the operational side, the system is now suffering a loss of about 1,500 points. It is the first real drawdown on the performance chart of the RRTS DC-ITA.
One structural aspect, however, must be stressed: the system does not self-correct.
Started today on current data, it would deliver the very same indications.
As repeated in previous analyses, should this turn out to be an error, it will be a particularly visible one.
The odds of success remain decent. However, the upcoming week will have to show clear bearish signs to give substance to the scenario.
Leave a Reply