


Weekly monitoring of the Italian benchmark index.
Why do we do it?
Check our strategy page.
My proprietary DBBT indicator identifies misalignments between the current price and the expected technical level on the main indices.
Every week, the FTSE MIB is in our crosshairs.
The hunt is on.
A week of recovery for the FTSE MIB, despite an opening weighed down by the ex-dividend payments of several index constituents.
Monday’s initial gap down purely reflected the technical adjustment tied to the dividend payments. Tuesday brought the only truly negative session, closing at 48,354.89, more than 760 points below the previous week‘s close.
Wednesday flipped the sign. A markedly bull session recovered the losses of the first two sessions in one move. Thursday and Friday followed with openings close to the previous day’s close and contained variations.
The weekly close at 49,510.97 is 394.50 points (+0.80%) above the previous close.
The negative swing the system was waiting for did not materialize. The week that was supposed to deliver the first confirmation of BCP3’s decline closed in positive territory, exactly the condition the previous conclusion flagged as critical for the short scenario to hold.
Let’s look in detail at what the system’s indicators are telling us, to understand whether this close actually compromises the scenario or whether room still remains for it to materialize.
Bulls vs Bears
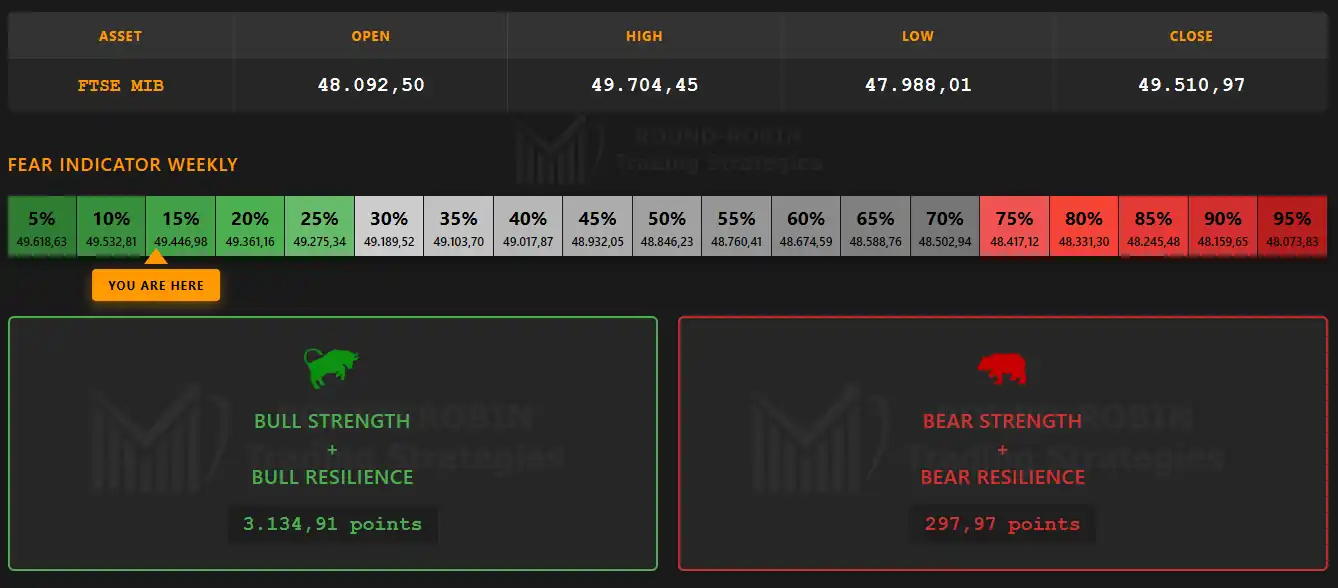
infographic: FTSE MIB weekly – Bulls vs Bears
Bulls clearly prevail over bears. The strength expressed by the bullish component remains largely superior, confirming a week that saw buyers quickly reabsorb the losses of Tuesday’s session.
The Fear Indicator sits at 15%, in the green zone. A reading consistent with a complacent market, where risk hedging remains marginal.
The Big Picture
Visually, the cash weekly candle shows lower highs and lower lows relative to the previous week. The reading is a direct effect of the dividend payments: on the future, where the adjustment does not apply, the same price action takes the form of an outside week.
The candle body nevertheless remains positive, with an extension close to 3%. In recent months, bullish bodies of similar magnitude have accompanied the rebound between late March and mid-April. It should also be noted that since October 2025 the FTSE MIB has yet to produce two consecutive weeks with close below open.
On the moving averages side, no structural change: the sequence Close > MA5W > MA10W > MA20W > MA50W > MA100W > MA200W remains intact, with all lines positively sloped. The MA10W shows a more marked acceleration relative to the others.
Read on the chart as it appears, the weekly close at 49,510.97 lies inside the upper shadows of the two previous candles. On the future, free from the ex-dividend effect, the current close at 49,495 sits on the tops of the two previous weeks between 49,460 and 49,480. Prices confirm recent levels without producing any upside extension.
For the algorithms, which operate on the visible form of the chart, the candle records a positive body and a close aligned with recent tops, without however producing elements sufficient to modify the operational setup. The system stays in position.
BCP3
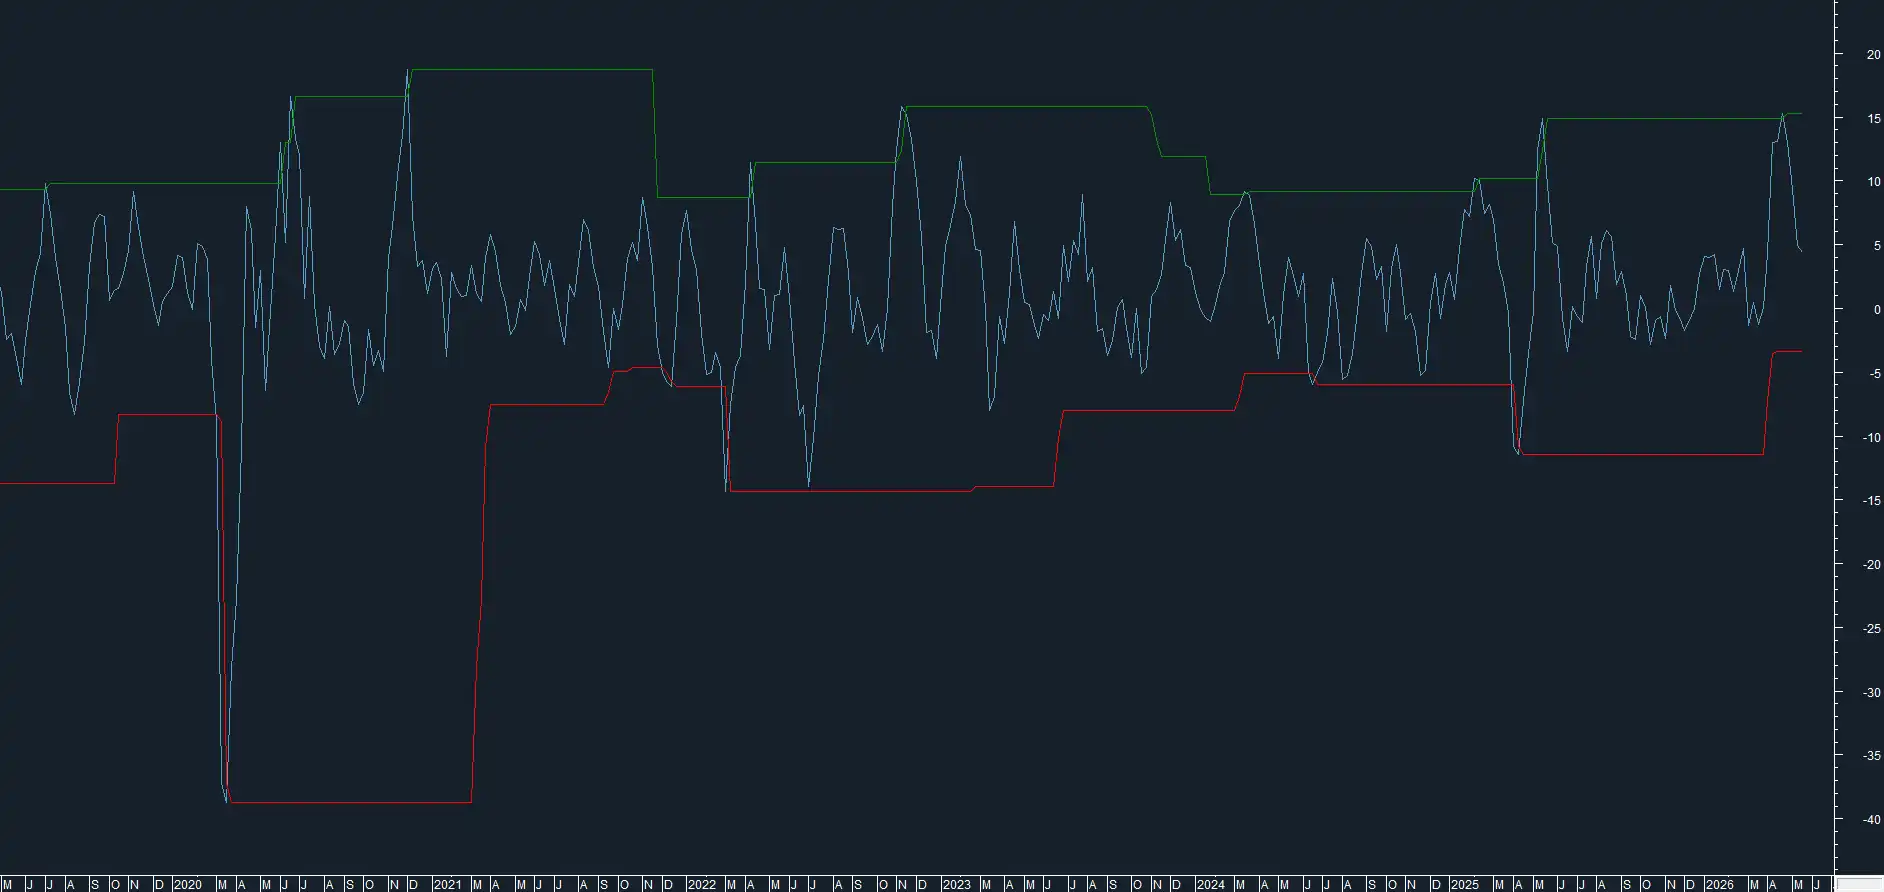
chart: FTSE MIB – BCP3 weekly
The indicator drops further, falling to 4.31%. The descent continues despite the FTSE MIB’s positive weekly close: a divergence that keeps the negative swing scenario valid.
The setup remains intact. A prolonged sideways move at the highs, without the index weakening, can exhaust the swing before it materializes.
MACD
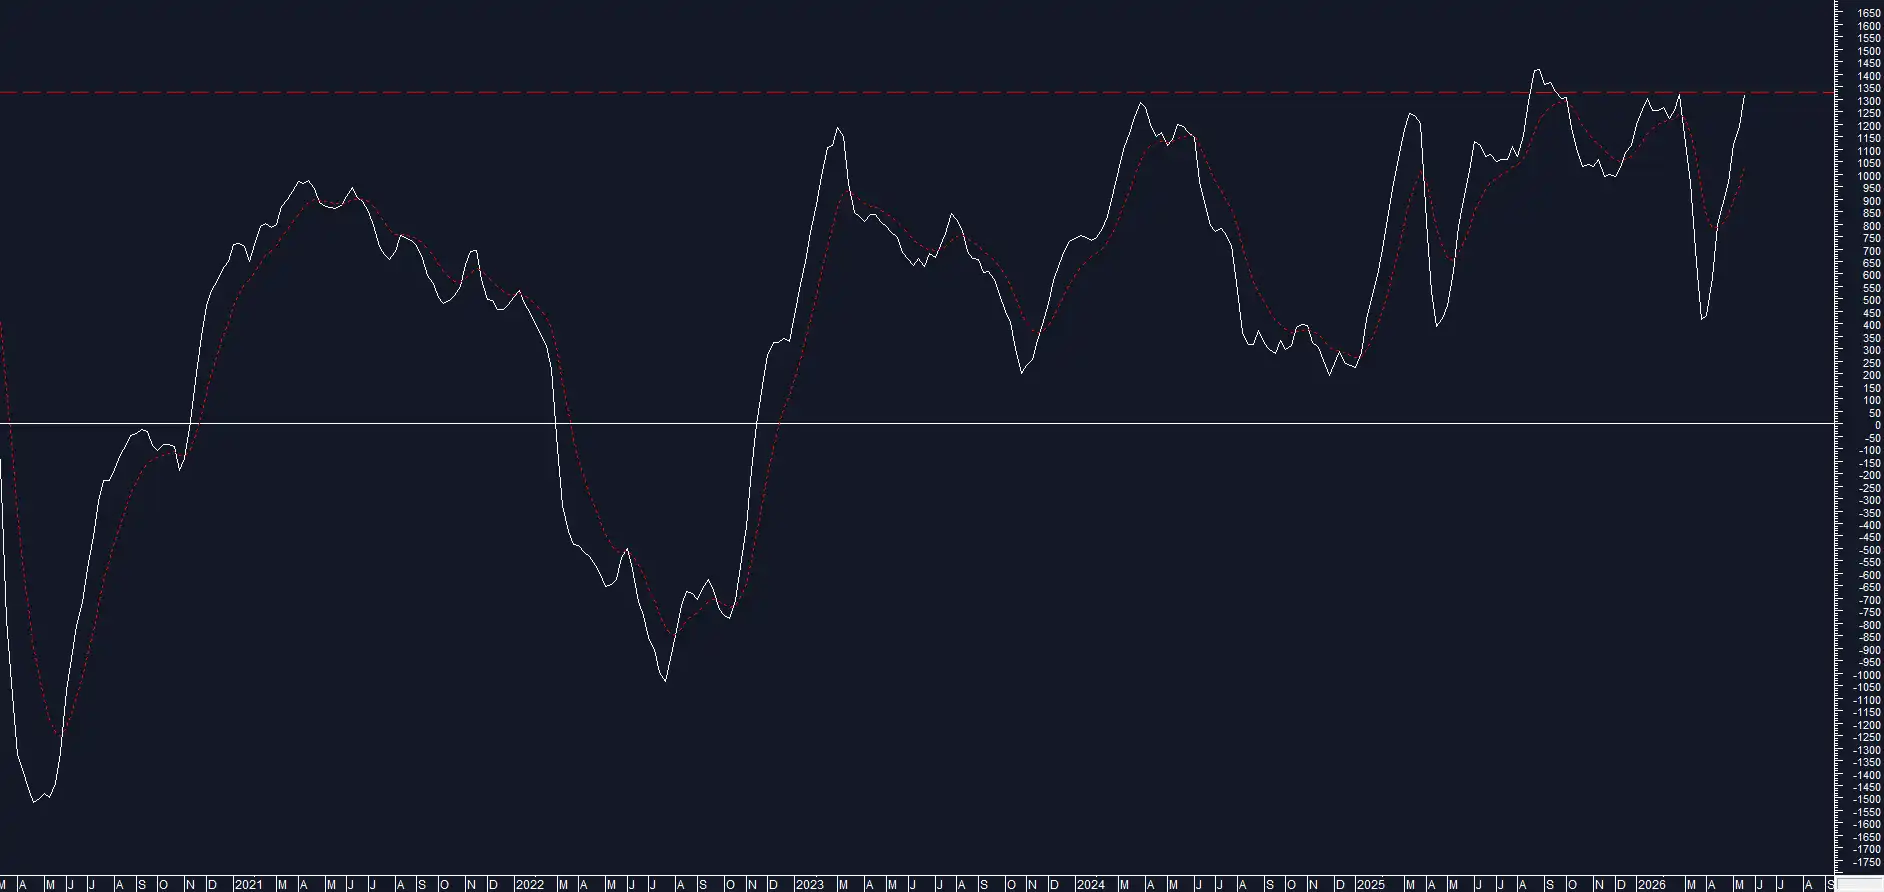
chart: FTSE MIB FUTURE – MACD weekly
The proprietary indicators do not add meaningful information this week: some replicate the readings of recent weeks, others are affected by the heavy dividend payments of Monday the 18th.
A point of interest comes from the future’s MACD, which sits at 1,319, the same value recorded in February 2026. This is an objectively extreme level: in the past 20 years the future’s MACD has exceeded this threshold only once, in August 2025.
Mere observation, with no predictive intent.
Conclusion
The system remains short, with no changes relative to recent sessions. The quantitative reading, however, records a worsening of the technical picture. The market refuses to give in even for a physiological correction, reabsorbing every hint of weakness within the same week.
The odds of a bearish swing remain intact, but the time window has shrunk further. The week just closed represented a fundamental step to confirm the bears’ presence. Its failure to materialize means the move required to confirm the system will now have to be wider to remain statistically consistent with the scenario.
A technical excess, in the absence of a concrete price signal, can persist for a long time. This is a structural feature of the market. The system, on this front, no longer has the time margin it enjoyed in previous weeks.
Leave a Reply