


Pattern Spotted is our format where we analyze patterns and configurations as they appear in the markets. This week we discuss the Bearish Engulfing on Brent and Nikkei.
The Bearish Engulfing has always fascinated me, and many others, for its immediacy.
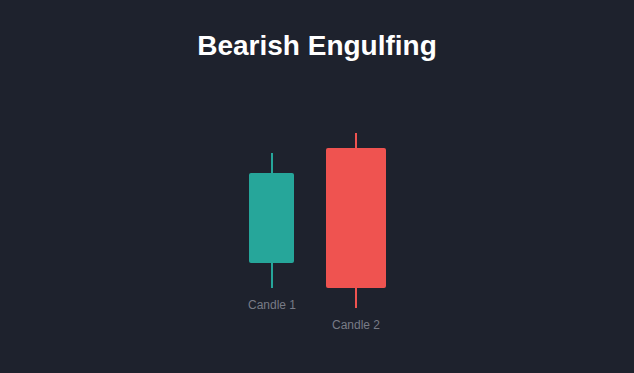
chart: Japanese Candelsticks Pattern – Bearish Engulfing
The reason is simple: it communicates something clear-cut.
Unlike the doji of a potential Evening Star or the long shadow of a Shooting Star, there’s no interpretive ambiguity here.
The trader sees the switch between bulls and bears.
It’s not a shadow — even a very long one — that could still accompany a positive close. It’s a decisive turn on the timeframe we’re observing.
The trend is bull. Bulls are dominating. After a new bullish session at the highs (with close > open), they open even higher the next candle.
Then something jams. Bulls can’t push further, profit-taking begins, and the bears exploit the swing to strike.
Not only does it close negative, but it erases the previous candle. It closes below C1’s open.
The beginner’s voice would say: it must be an almost infallible signal, because it speaks clearly and loudly.
That’s not quite the case. Let’s see why.
Brent 2018: Three Eloquent Cases
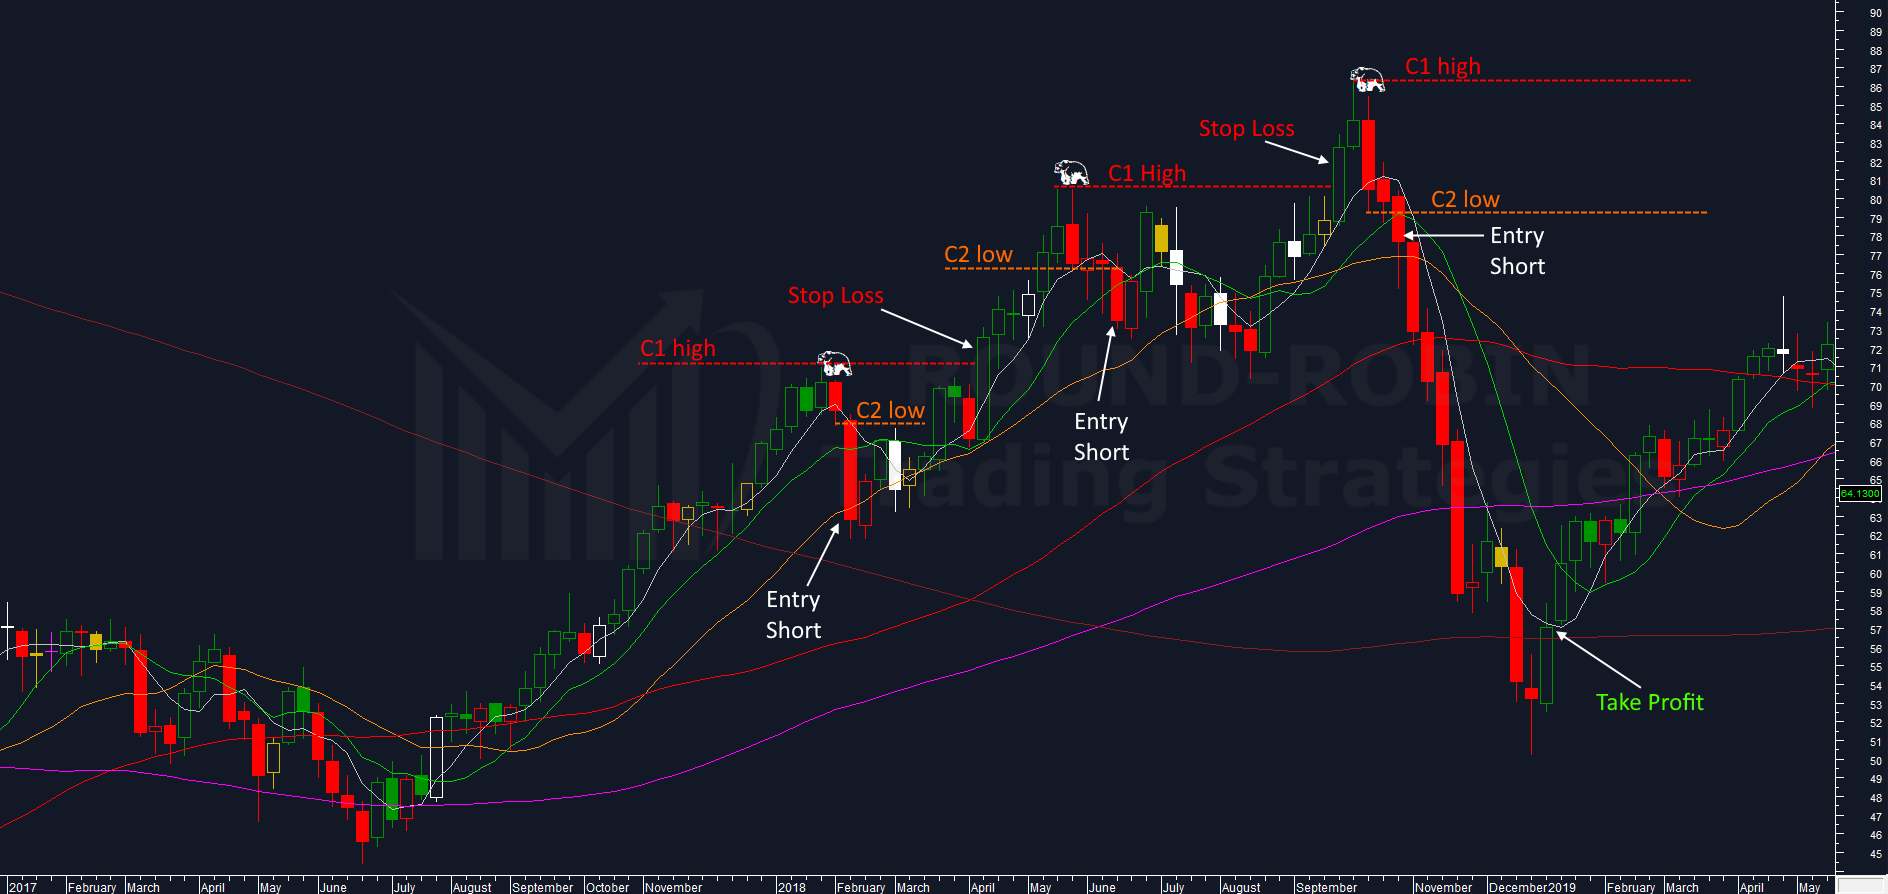
chart: Bren weekly – Bearish Engulfing
The Brent weekly chart in 2018 shows us three emblematic situations.
February. There’s an uptrend, the bearish candle engulfing the bullish one isn’t huge — it meets the conditions borderline, but it meets them. The problem comes with confirmation: the break of C2’s low rests on the MA20W (orange). This is the entry point. From there, price only rises, sending us to stop loss and continuing its climb until another Bearish Engulfing situation.
May. My favorite setup. There’s a top on C1 that already retraces — bulls have lightened up or bears have shown they’re present. The next candle, bulls try again but get rejected below the low of the candle that marked the top. It’s already a de facto reversal. Yet it takes another three weeks to close below C2’s low. This loss of momentum is already a red flag, but the pattern confirmation gives confidence.
Oil doesn’t accelerate downward. Instead, it starts rising again, approaching the stop zone. Momentum is gone.
What does the manual say?
Do nothing. Stop loss when hit, or go to profit.
I have a different approach: I entered on a momentum signal, I accepted three weeks to get confirmation — I can’t accept another four weeks to see profit again. If I do, it means I’m trading something different.
But let’s stick to the manual: after fifteen weeks it hits stop loss. Exactly one week before making a new top where another Bearish Engulfing occurs.
October. Very similar to the previous one: C1 with retracement from the top, C2 engulfing C1 and this time plunging deeper. Confirmation comes after two weeks and brings a winning trade, without suffering.
What This Case Tells Us
Something we often find with Bearish Engulfing, across all timeframes and all markets.
- If C2 engulfing C1 isn’t very extended, an extended confirmation will probably arrive that risks burning our trade. This is one of the reasons many traders use the pattern without confirmation.
- If confirmation arrives and momentum fades, it’s better to abandon the trade at breakeven.
- If C2 goes well below C1’s open, it’s the best setup. It seems counterintuitive — you feel like you’re missing a slice of the decline — but it’s a momentum accelerator. The price to pay for a higher quality signal.
The Market Map
Speaking of daily and weekly timeframes, on which markets does it work reasonably well?
EUROSTOXX50, DAX, GOLD — but with two additional conditions: C2 must go well below the open, even better if below the low, and you shouldn’t wait for confirmation.
With this setup, the best results in terms of equity line are on the Nikkei. A deviation from the manuals, but it works.
Where is there less advantage?
With classic parameters it’s frustrating on EUR/USD. It alternates terrible and excellent results on Silver. On Bitcoin it rarely occurs on the weekly, while on the daily it more often identifies a consolidation pause than a true reversal.
Nikkei: The Virtuous Case
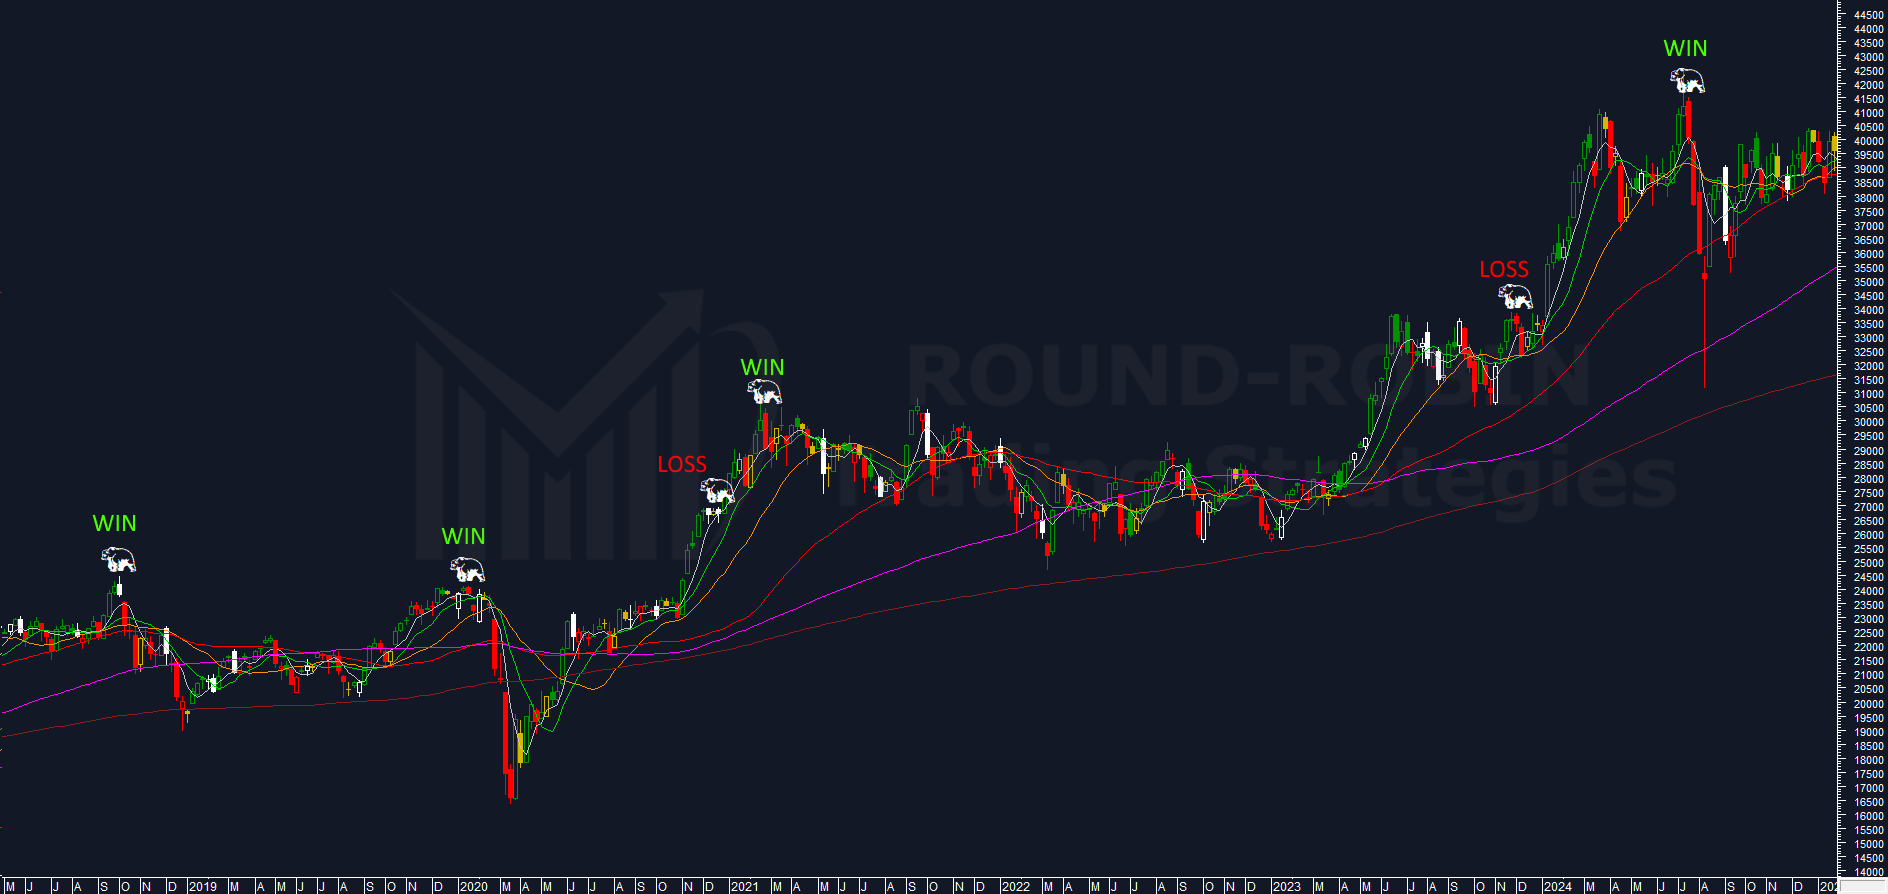
chart: Nikkei 225 weekly chart – Bearish Engulfing
Looking at the Japanese index chart from 2018 to today, the pattern works excellently — always with the deviation of not waiting for confirmation.
The win/loss ratio is 66% (4 wins, 2 losses). But that’s not all: alongside reduced losses, the pattern has identified 2 crashes and 2 medium-term downtrends. The second less steep, but it always maintained direction.
Conclusion
The Bearish Engulfing is a nice pattern, easily identifiable. It has logical reasoning behind it. But it comes with flaws at the trading level, if we strictly adhere to the manual.
Flaws that statistics help remedy — by not waiting for confirmation.
The risk? Executing some trades on a Bearish Engulfing that won’t be reported in the manuals.
But that will allow capturing a portion of profit that would otherwise be lost. All things considered, in terms of equity line, this approach is worthwhile.
How to use it?
I know, it’s not what the manual says, but… on its own.
Because it often appears when prices are overextended on moving averages, or when the first moving average that could signal a reversal is too far away. Rarely, when this configuration appears — particularly on weekly timeframes — do other oscillators accompany it.
Verify it yourself: on your charts, on the assets you follow, apply the manual settings and apply the ones I’ve suggested. Does it improve?
Even if it doesn’t improve on your market, from today you have one more reason to watch the Nikkei.
Leave a Reply