LOGIN SIGNUP
English Italiano
Markets
World Indices
Forex
Commodities
Crypto
EN
IT
×

CONTACT US

Round-Robin Logo

Chart of the Week: Nikkei225

Weekly appointment with the most followed charts in the world.

In early March we chose the Nikkei 225 as Chart of the Week to build a bearish case. The overextension on the MA200W had just set a new all-time record at 57.39%, and we wrote that the return below 50% was not a matter of “if” but “when”.

We also wrote something else: once the excesses are exhausted and the overextension falls back below 50%, the index has historically resumed its rise. We called it “the most important trading window”.

That window is opening now.

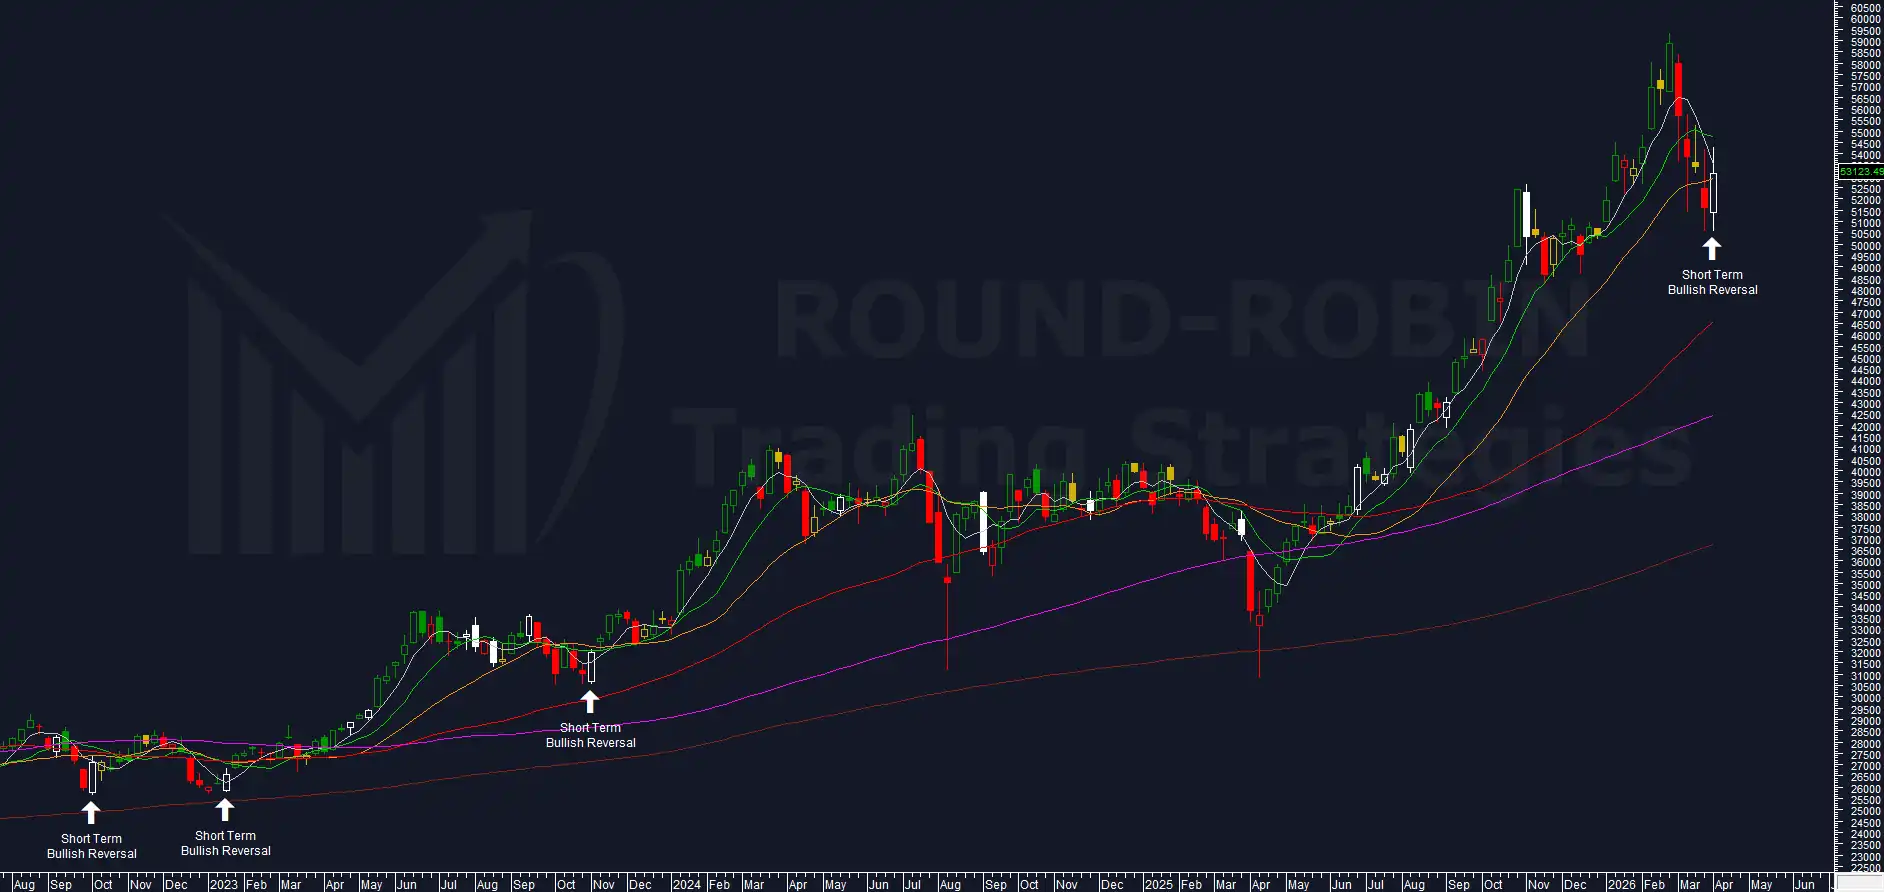
The Nikkei 225 closed this week at 53,123.49. From the record close at 58,850.27 the index has dropped 14.08% to its low at 50,558.91, completing the first leg of the correction we had anticipated.

Let’s see what the charts are telling us.

Read More →

Charts Flash: Week 14/2026

Quick observations on the charts that caught our eye this week.


This week’s flash covers EUR/USD, Brent Crude Oil, Gold, Silver, Bitcoin, S&P 500 and DAX. EUR/USD at its third consecutive week of testing and rejection from the MA50W, the attempt to recover the MA5W failed, the short remains intact. Brent, featured in our Chart of the Week last week, continues as an inside candle with volatility and range declining sharply but still elevated: the system remains short. Gold and Silver stay neutral, both with rising highs and lows but without a weekly price signal to justify re-entry. Bitcoin unchanged, compressed below the MA10W for the third consecutive week with a sharply contracting range. The S&P 500 closes short positions on loss of momentum, simultaneously recovering the MA50W and MA5W with one of the most extended bullish bodies in a year. The DAX confirms the long with nearly +900 points on the week, rising highs and lows and recovery of the MA5W.

Read More →