


Weekly appointment with the most followed charts in the world.
In early March we chose the Nikkei 225 as Chart of the Week to build a bearish case. The overextension on the MA200W had just set a new all-time record at 57.39%, and we wrote that the return below 50% was not a matter of “if” but “when”.
We also wrote something else: once the excesses are exhausted and the overextension falls back below 50%, the index has historically resumed its rise. We called it “the most important trading window”.
That window is opening now.
The Nikkei 225 closed this week at 53,123.49. From the record close at 58,850.27 the index has dropped 14.08% to its low at 50,558.91, completing the first leg of the correction we had anticipated.
Let’s see what the charts are telling us.
Big Picture
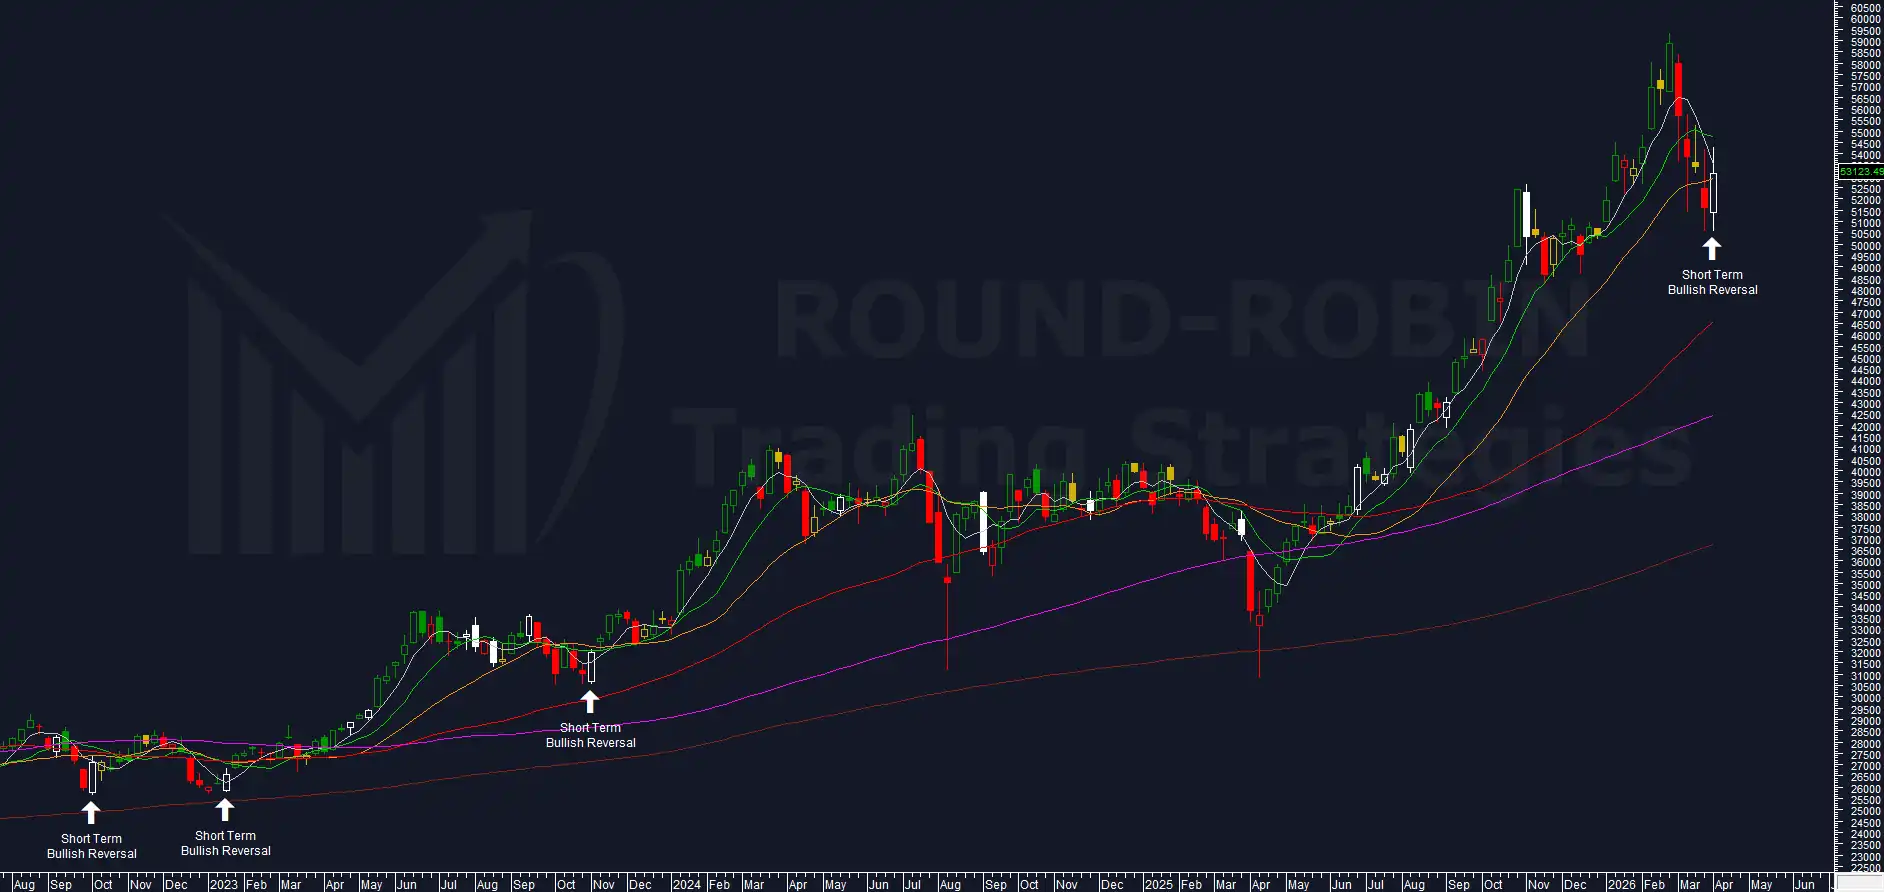
chart: Nikkei225 weekly
Prices have been below the MA5W for five consecutive weeks, and below the MA10W for four. Every week the bulls have attempted to reclaim the MA10W, and every week they have been rejected.
This week produced an outside candle with a close above the open: a bullish structure that engulfs the previous week’s range, forming a bullish engulfing pattern. The MA20W has been slightly recovered, but the MA10W remains the real resistance to watch.
The pattern is clear: the index is compressing below a key moving average, absorbing the excess built during the rally, while the bulls keep pushing from below without yet breaking through.
This is the kind of structure that typically precedes a bullish move.
Overextension on the MA200W
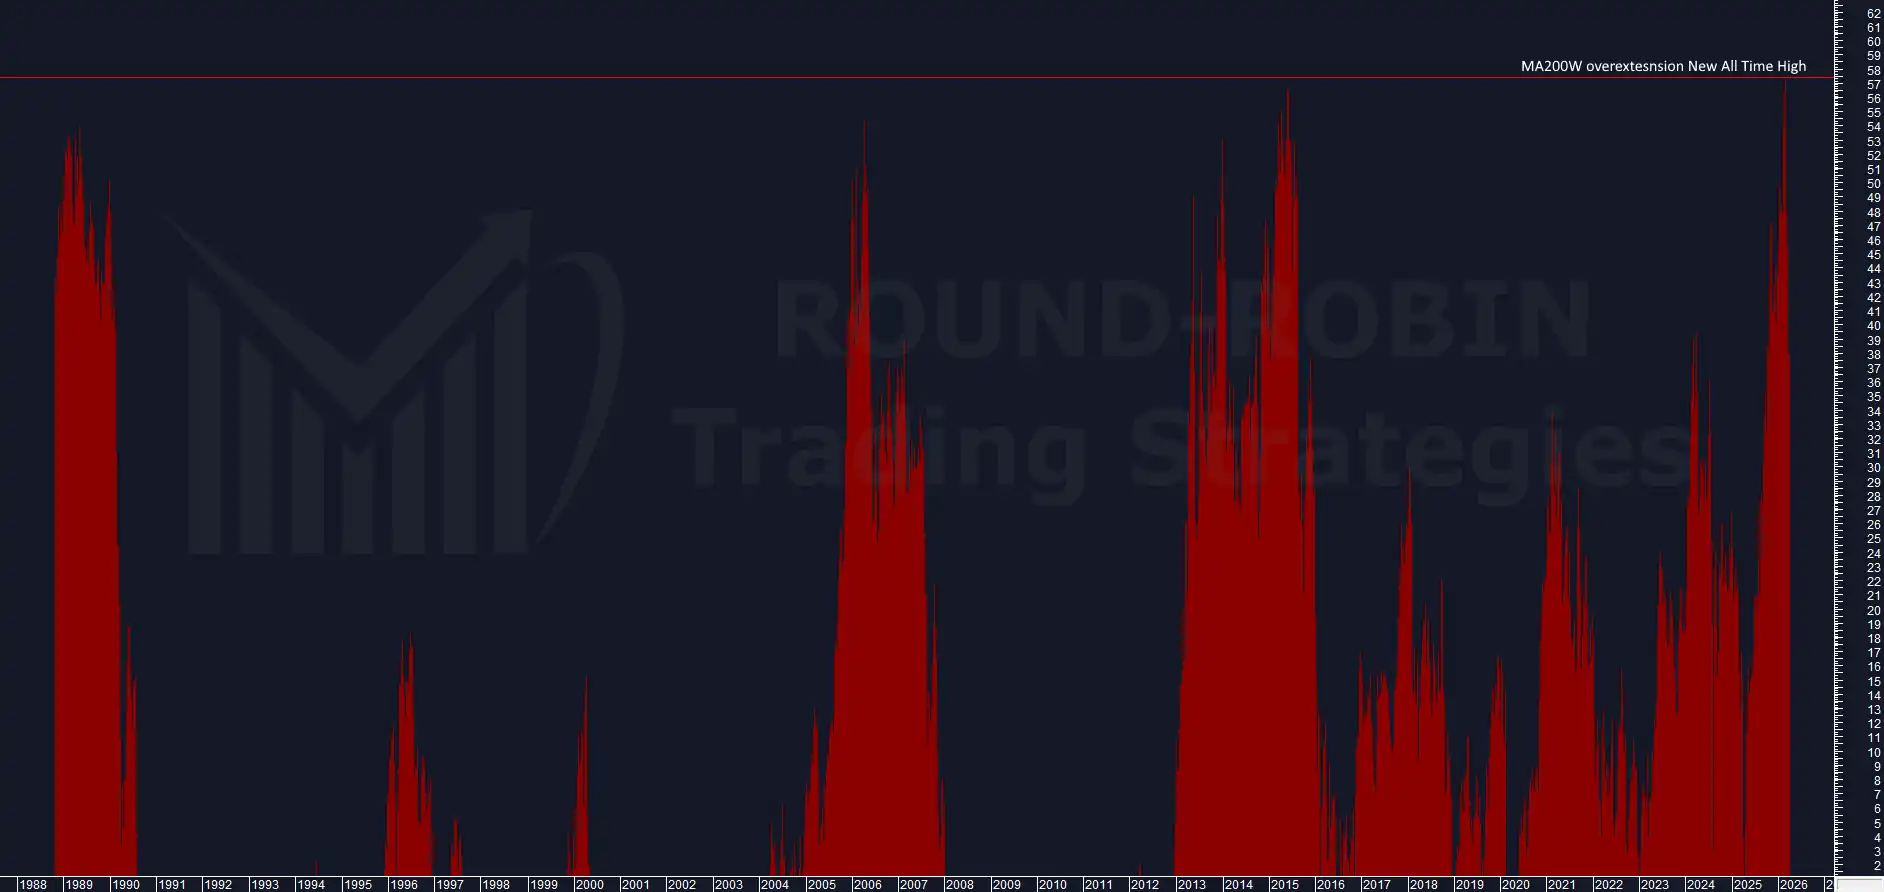
chart: Nikkei225 – weekly overextension on MA200W
This was the core of our March analysis (COTW: Nikkei225), and it remains the metric that matters most.
In early March the overextension on the MA200W stood at 57.39%, a new all-time record. We asked five questions about what happens when the Nikkei pushes above 50%, and the third was the most relevant for today:
“The overextension fell below 50% almost always accompanied by a decline in the index. After this decline, prices bounced and resumed their rise, in some cases reaching new highs.”
The overextension has now dropped from 57.39% to 37.73%.
The decline below 50% has occurred, exactly as described. In previous instances, once the overextension retreated from its extremes the bearish momentum faded and the index produced a bullish rebound. According to our system, this is a statistically high-probability event.
In the March article we described this as the long-term scenario, point E: the phase where the Nikkei has historically resumed its rise toward new highs. The overextension at 37.73% tells us the first wave of excess reduction is complete and the conditions for that scenario are now present.
Overextension on the MA100W
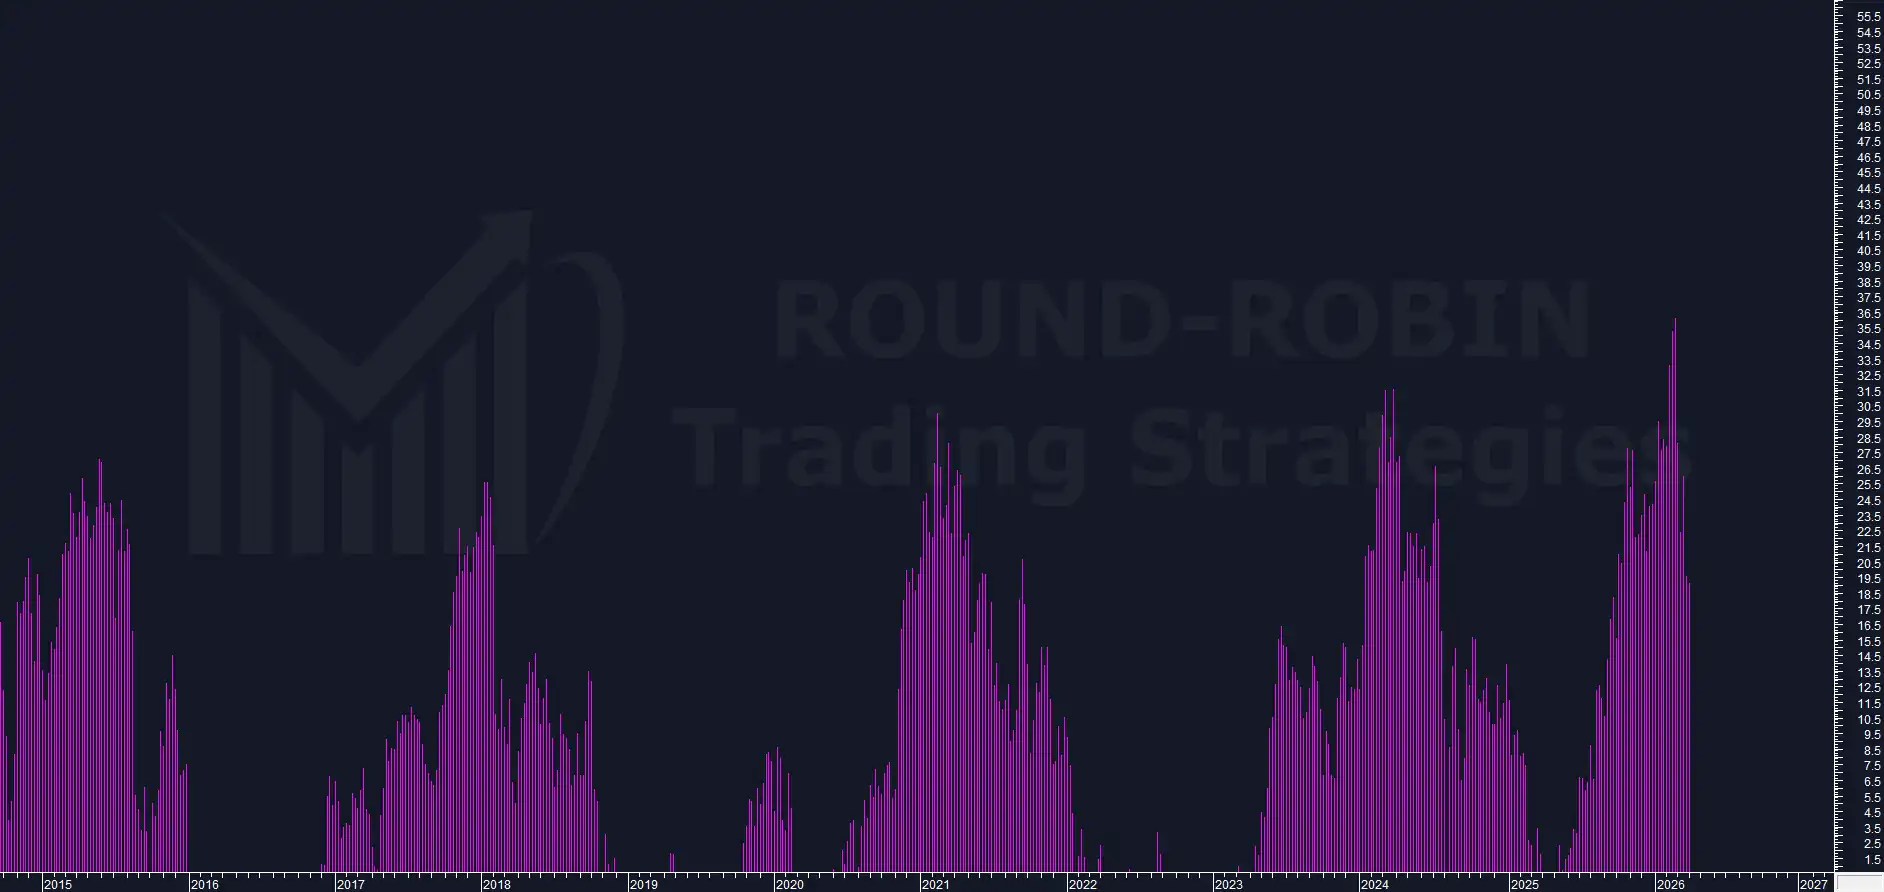
chart: Nikkei225 – weekly overextension on MA100W
The MA100W overextension has dropped to 19.17%.
What matters here is the convergence with the MA200W: both overextensions are showing a loss of bearish momentum. The decline is decelerating, the values are stabilizing, and the two timeframes are telling the same story.
When both the MA100W and MA200W overextensions stabilize simultaneously after a sharp drop from extremes, we are looking at a market that has absorbed the initial shock and is setting up for the next move.
BCP3
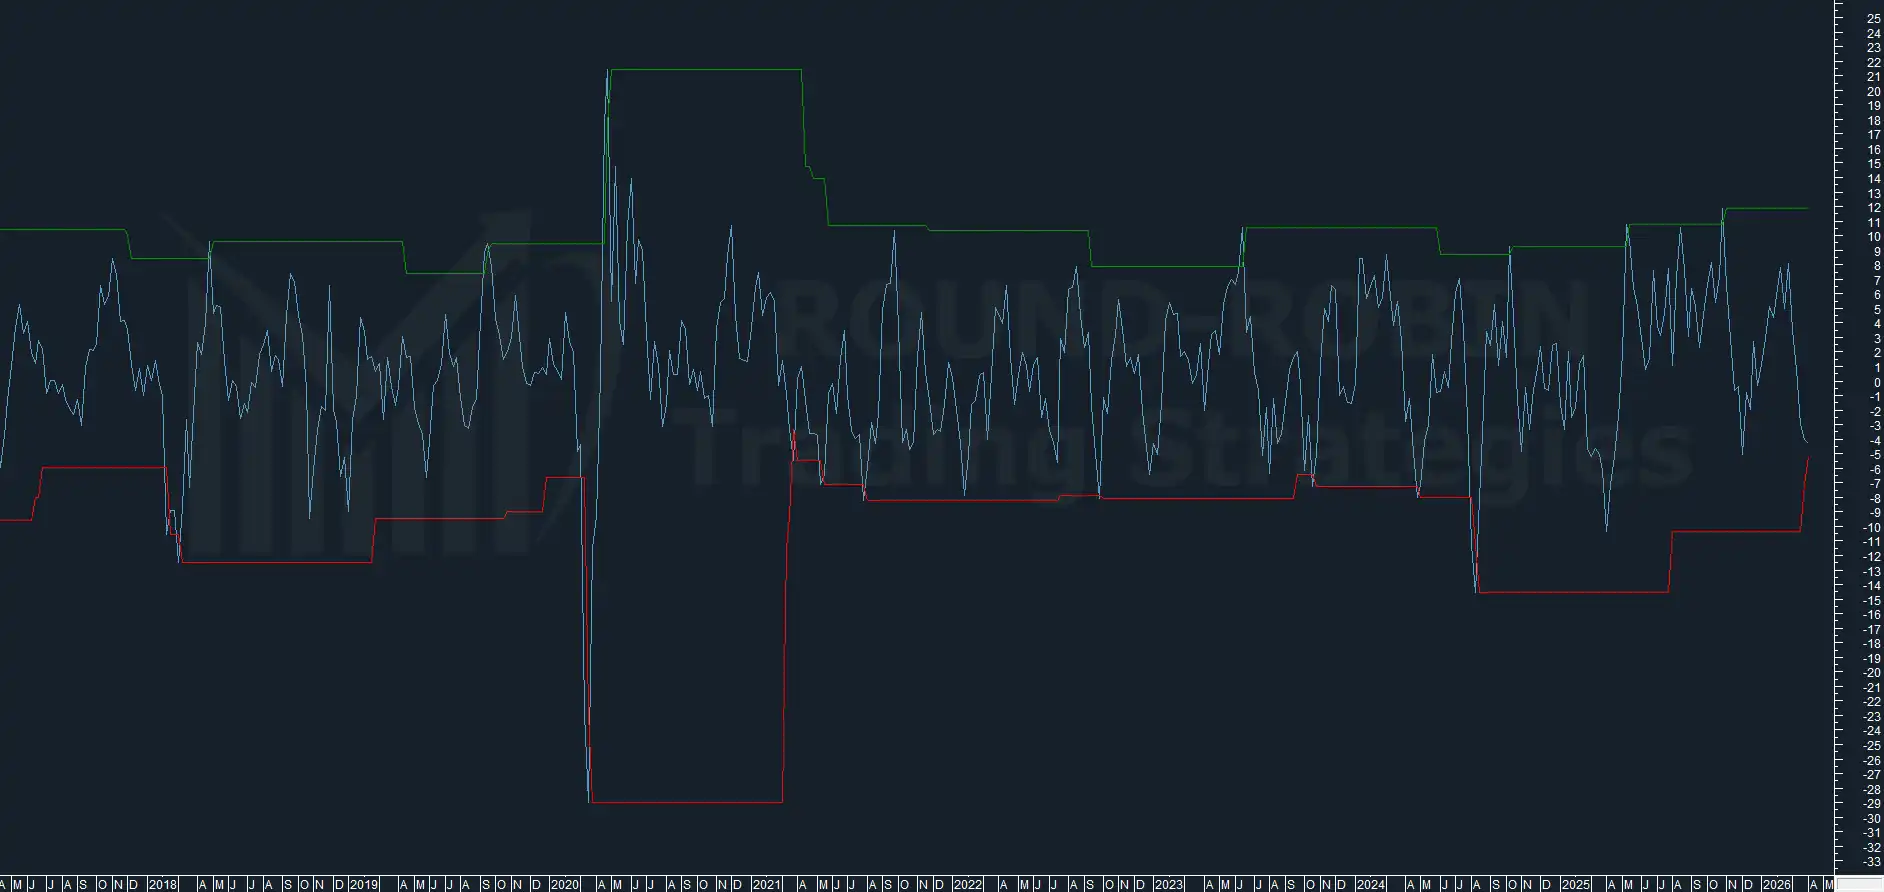
chart: Nikkei225 – BCP3 weekly
In March the BCP3 showed an upside swing of 3,500 points, a level reached only three times during this bull market. We noted that all those swings ended with an extended retracement and suggested a decline exceeding 6%.
From the record close at 58,850.27 to the weekly low at 50,558.91 the Nikkei lost 14.08%. The BCP3 delivered.
The indicator has now reached the previous downside extreme, with the lower band tightening. There may be marginal room for a further push toward the lower band, but the difference is minimal: the swing has essentially done what it needed to do.
In March the BCP3 was the strongest argument for the bears. Today it is no longer bearish: the excess swing it measured has been consumed.
Conclusions
The position is long, with entry at the weekly close of 53,123.49. The stop loss is set on a weekly close below 50,500, and the minimum target is 56,000, which corresponds to the 61.8% Fibonacci retracement and the first target identified by our system. The risk/reward ratio is approximately 1:1.10.
A weekly close above the MA10W would confirm that the positioning trade turns into a breakout. Below that level, the trade remains valid but without the directional push from the bulls to accelerate toward the target.
Leave a Reply