


Pattern Spotted is our format where we analyze patterns and configurations as they appear in the markets.
This week we discuss Gaps, with a focus on weekly ones and daily ones only when truly significant.
Gaps have always exerted a special, almost mythological fascination on many traders.
Yet, after more than thirty years of market experience, I have learned that the most widespread narrative about gaps is often more dangerous than their actual presence on the chart.
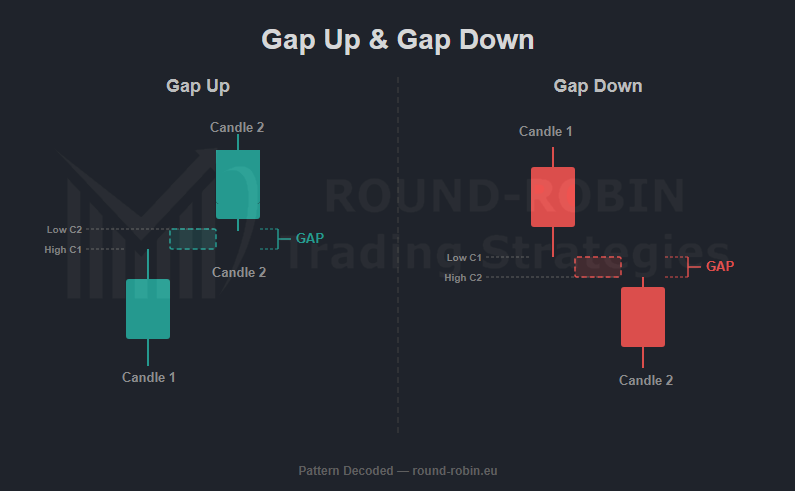
chart: Gaps
Before diving in, two necessary premises.
- I prefer weekly gaps. Daily ones are too frequent, often noisy, and lead to overestimating events of little structural relevance. A weekly gap instead implies that something important happened while markets were closed for several days: the market reacted — or overreacted — to a concrete event.
- I do not use volume to classify gaps. In complex systems volume can play a role, but in simple analysis I have never seen a clear statistical edge from volume, not even in major trends. The narrative “high-volume crash = disaster” vs “bargain hunting at discount prices” is always correct… ex post.
1. Common Gap
It is the most “quiet” gap and — paradoxically — the one that can cause the most damage if the trader treats it as an automatic opportunity.
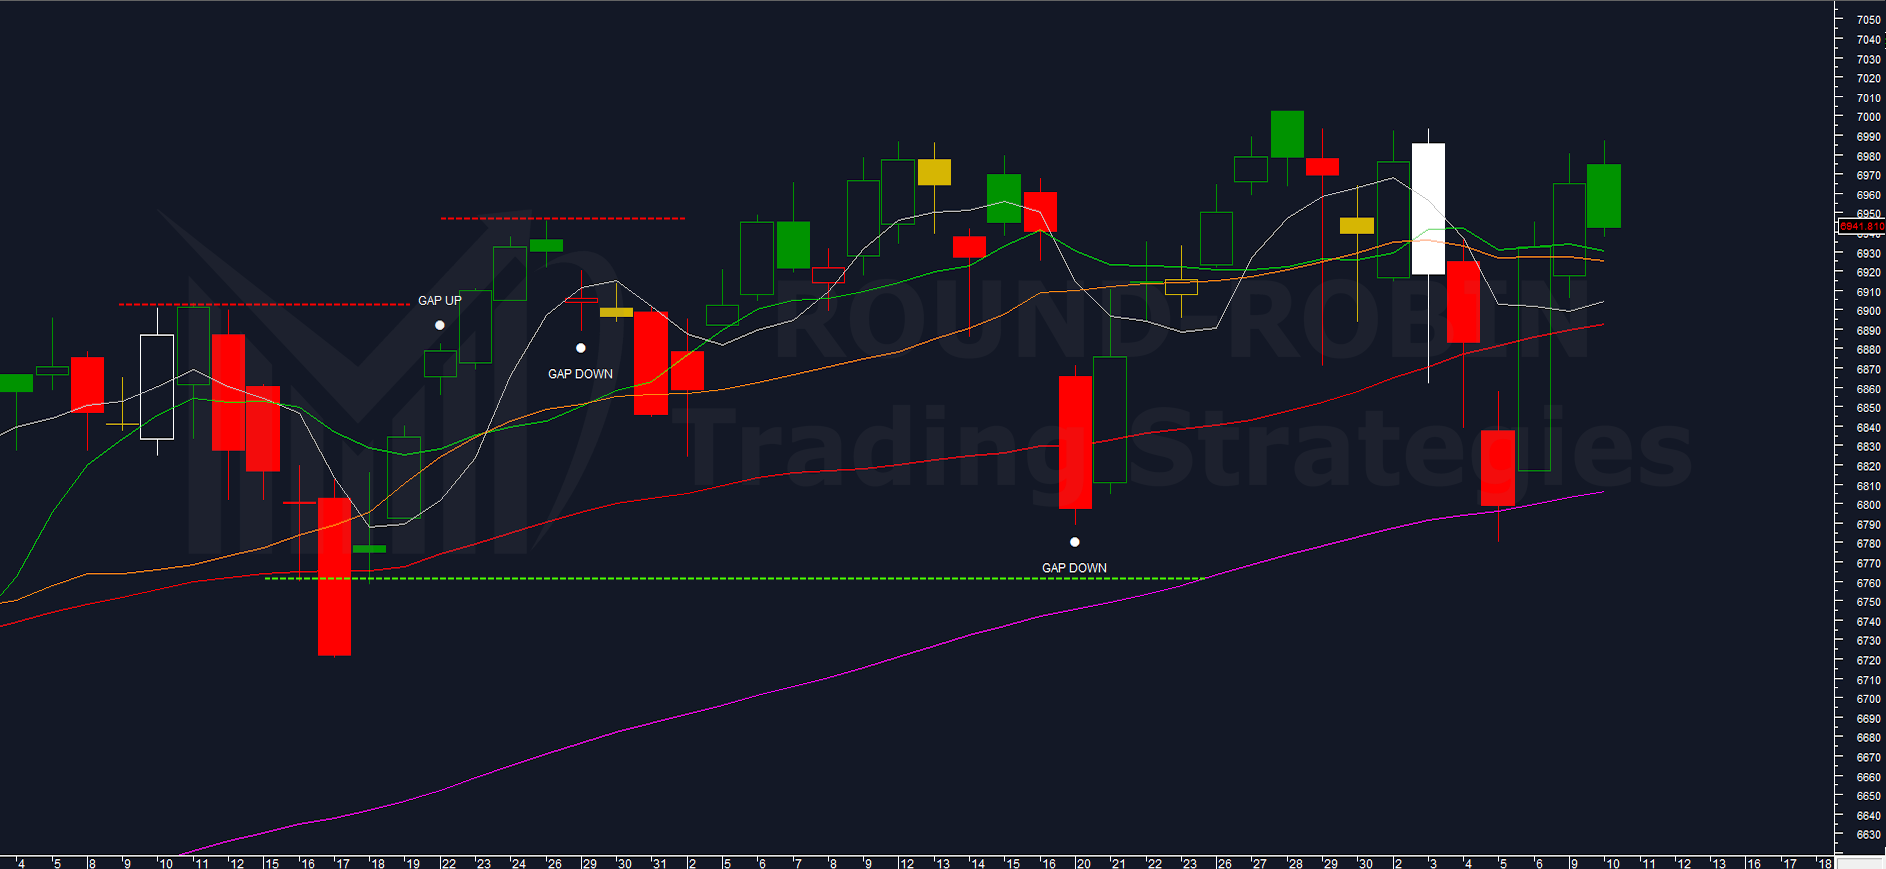
From the weekly S&P500 chart it is clear that the index is in a broad sideways range at highs.
Three common gaps appear: one gap up and two gap downs.
The first gap up is wide, but it does not break any previous relative high.
The candle has a tiny body compared to recent averages. It slightly over-extends the MA5 but without clear signals from either fast or slow moving averages. No relevant momentum indicator for the timeframe gives a bullish confirmation.
Status quo unchanged → common gap.
Beginner’s voice: “So short, it’s bound to close almost for sure.”
Here is the “almost” that can blow up an account.
To trade a common gap you always need a concrete price action signal (which in this case only arrives when the gap is already almost closed).
What can we use a common gap for?
- not adding to long positions
- protecting existing long positions
- reducing net long exposure
These are not trivial pieces of information.
The second gap down is even more trivial: gap from the high, virtually non-existent body, fully contained within the previous days’ range. Nothing. Yet it took five days to fill it. The idea “gap down = buy” is therefore at best reckless.
The third (the second gap down) looks “gigantic” in context.
Beginner’s voice: “This can’t be a common gap! Look at that gap and look at the body.”
Indeed, if the next candle had not closed above the high of the gap candle, it would have been harder to classify it right away.
But it did not go below December 2025 lows and did not break the MA100.
Common gap confirmed.
I would have been ready to reclassify it only if subsequent candles had shown significant bodies breaking lows and the MA.
To trade gaps in the direction of their fill we need a price signal.
The axiom “gap down/gap up = buy/sell” is mathematically destructive when applied systematically.
2. Breakaway Gap
It is the gap that claims the most victims, not only financially but also psychologically.
Punting against its survival is an exercise that leads to deep and prolonged losses.
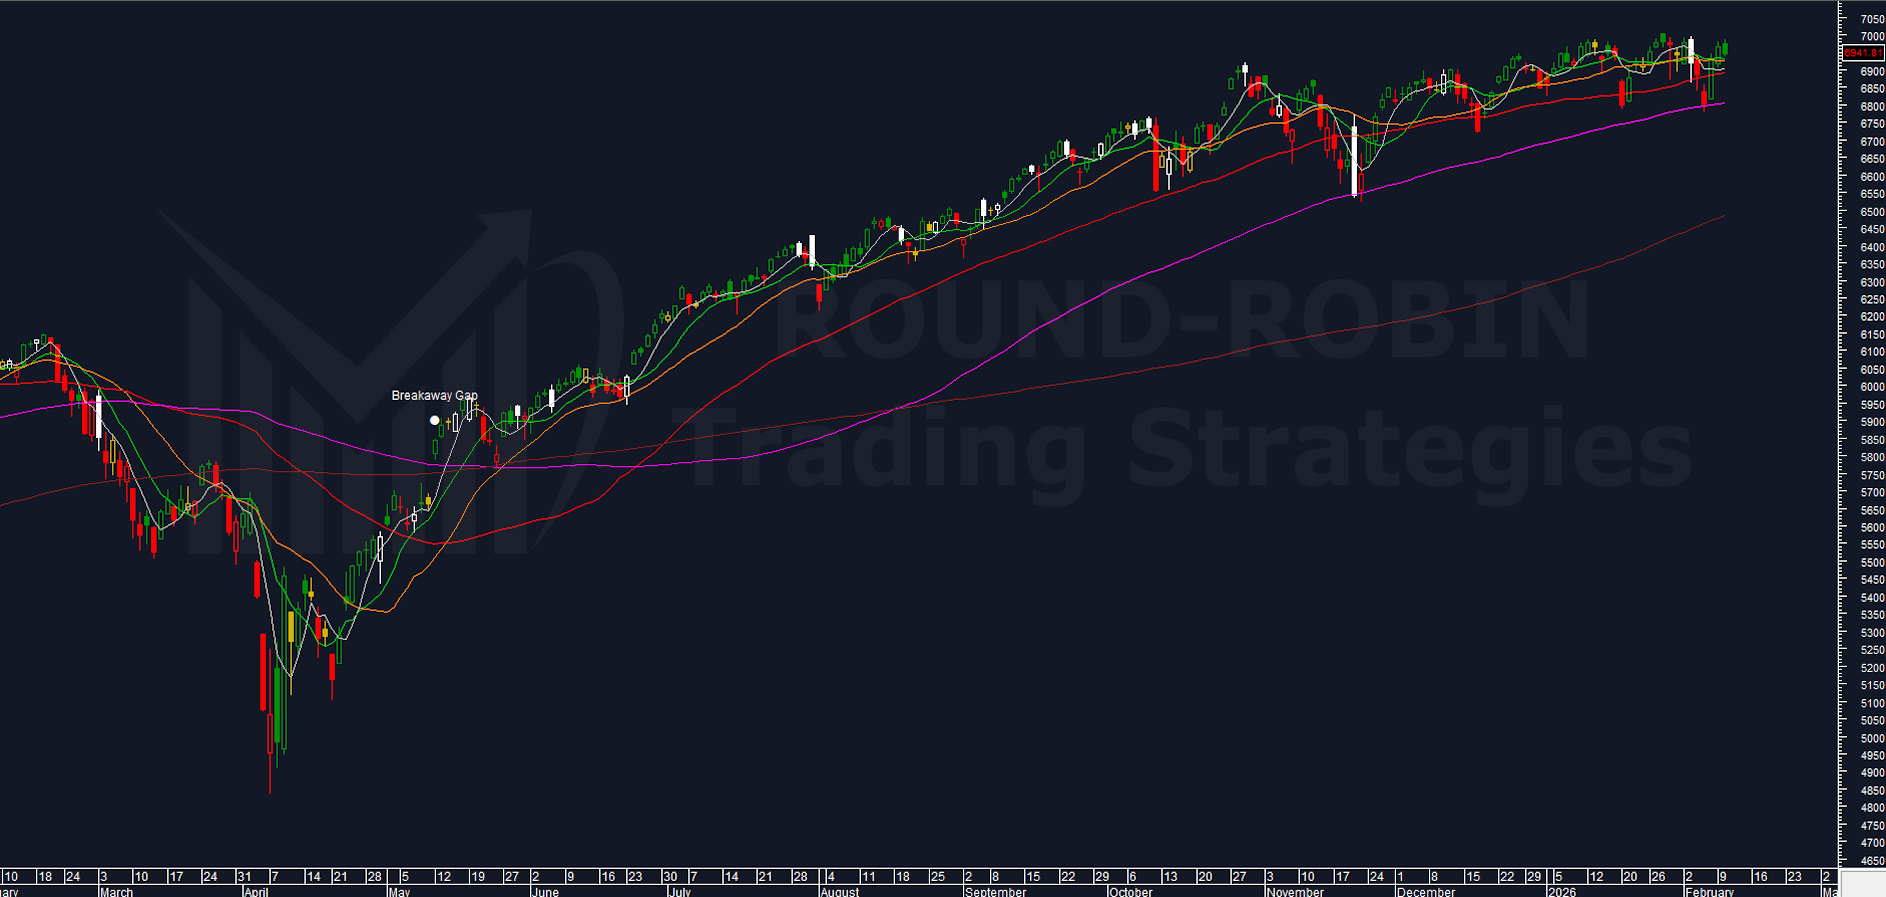
In the chart above we have the S&P 500 daily in May 2025 with a gap up that breaks the March relative high and — above all — the MA100 (the one that triggered the February-April drawdown).
A few days later it seems to fail, retests MA100 and MA200, bounces and resumes higher.
A little nugget for those with good pattern recognition skills: the bearish move broke MA100 and MA200, pulled back to MA200 and plunged; the bullish move broke MA100 and MA200 and pulled back again to MA100 and MA200. Same hands.
Nearly a year later: +1000 points.
The axiom “gap = it fills” proves unwise and devastating from every perspective.
Breakaway gaps can fill, sure.
Very often they do when the capital has already evaporated.
3. Measuring Gap (Runaway Gap)
The measuring (or runaway) gap is the one that has always created the most interpretive doubts for me.
That is why I codified it algorithmically: I don’t want to ask myself every time whether it is measuring or exhaustion.
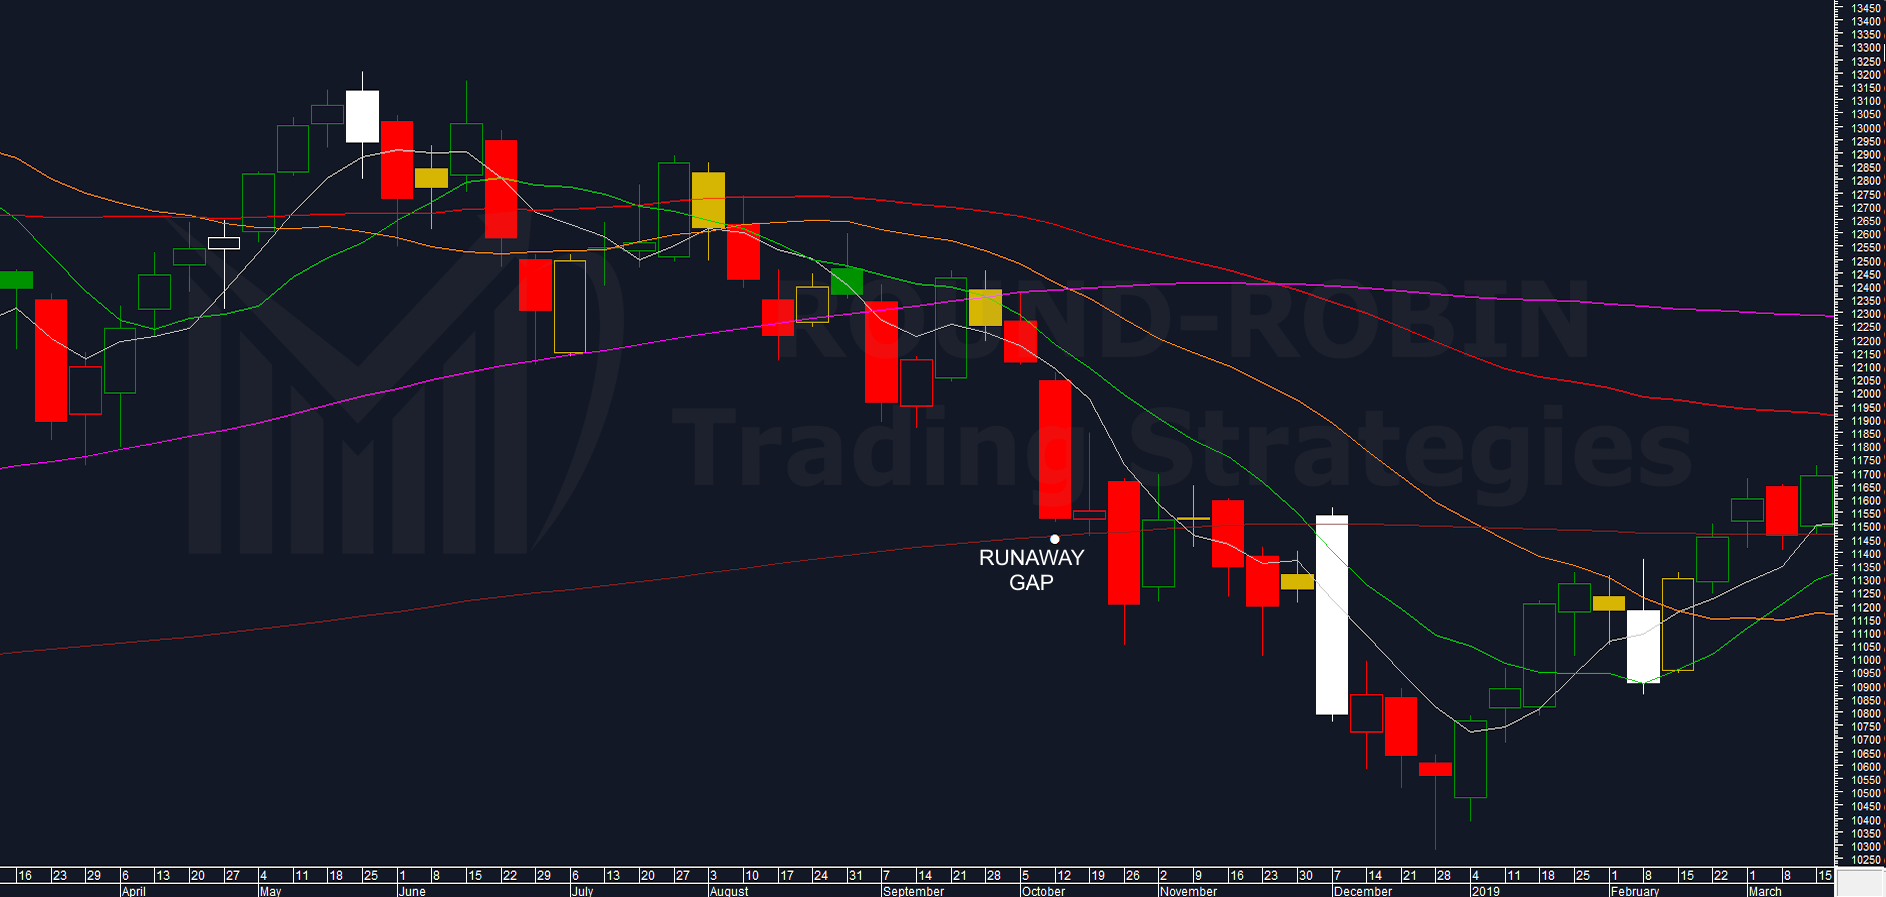
Let’s summarize with one requirement: if it is continuation it must show strength, therefore the candle body must be significant (as in the DAX weekly 2018).
Beginner’s voice: “Well, in this case it was obvious it was a measuring gap because there is a bear trend and it breaks the previous low.”
True, but not so obvious because there was little distance below the MA200W (key level since 2016 for this market).
The runaway gap performed perfectly, extending the decline for another three months.
For the record: it was filled only in April 2019 (six months later).
4. Exhaustion Gap
In my experience, unless accompanied by very strong contextual signals, the exhaustion gap does not mark the end of the trend, but a short-term pause.
It can easily be confused with the measuring gap, therefore I also use quantitative criteria for this type of gap.
The general guideline is the morphology requirement of the candle body: small and preferably with close below open.
Easy to translate:
- there is a strong trend
- there is FOMO
- a gap up forms at the high
- but at the end of the period price is near or even below the open
FOMO evaporated. All urgency to enter suddenly disappeared.
Never underestimate their danger: even these gaps, if not managed with risk-respecting money management, can hurt badly in the short term.
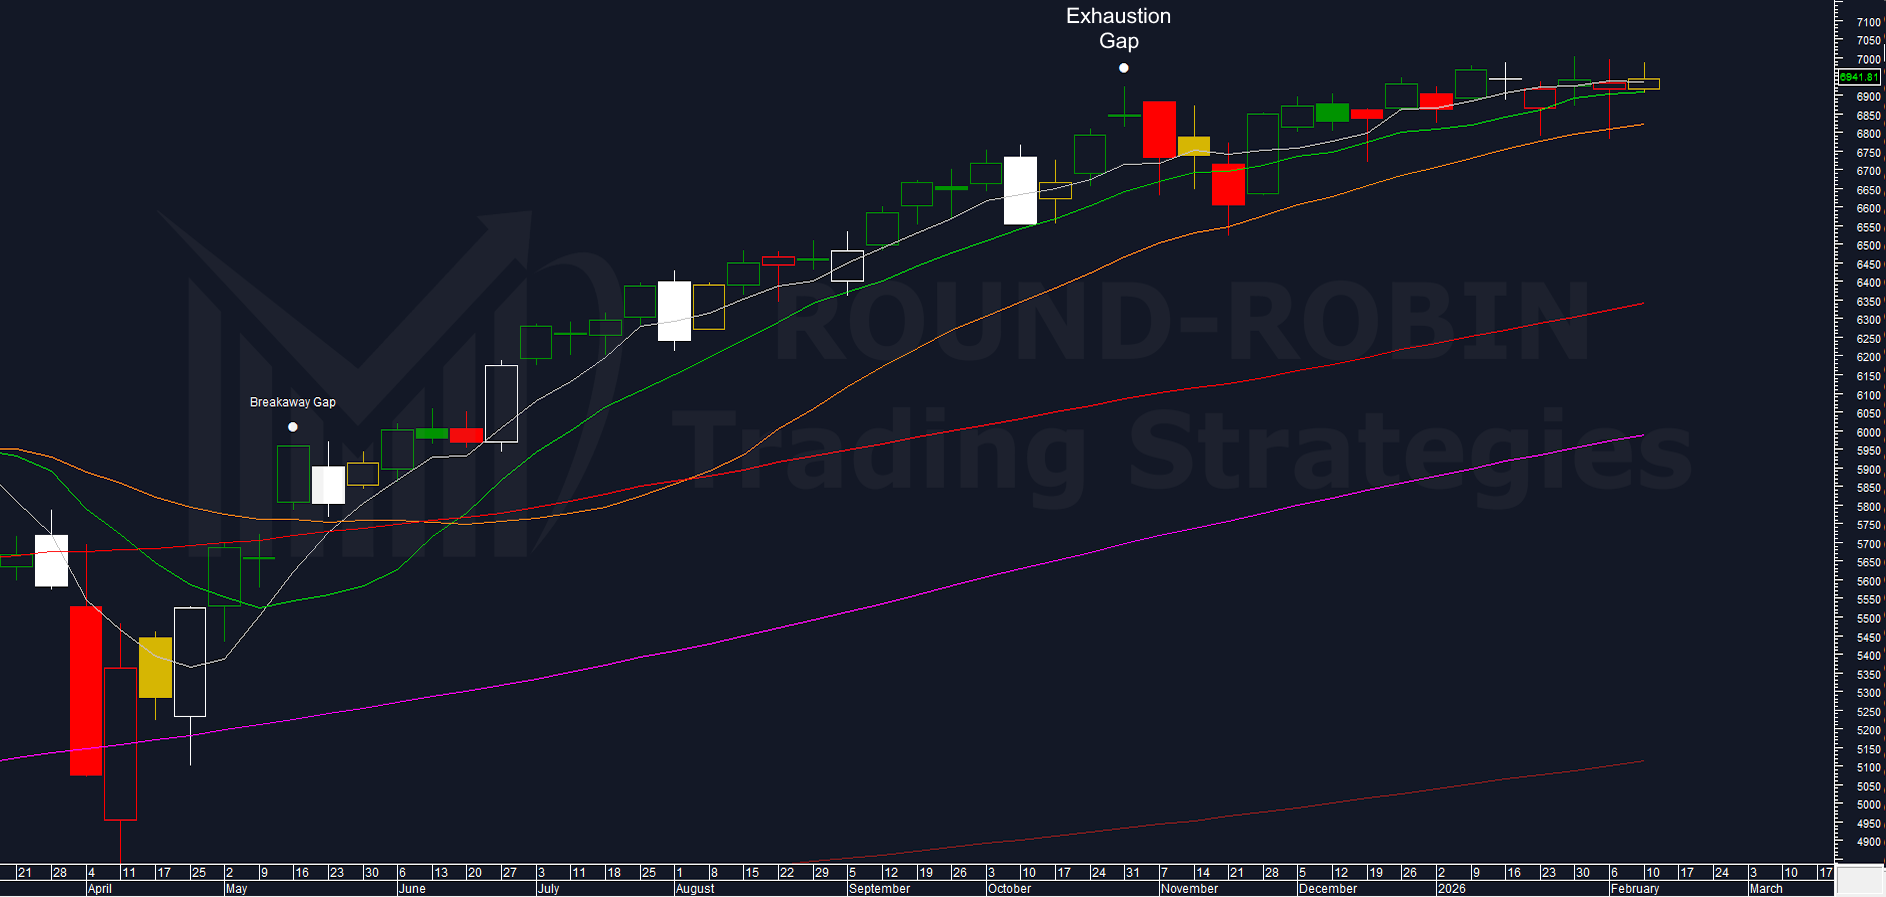
Clear example: S&P 500 weekly, Halloween 2025.
Gap up at all-time high, breaks previous high → cannot be common by definition.
But null body, no real extension.
FOMO evaporated.
One of the rare cases where attacking immediately (i.e. the next candle) against the gap makes sense, with rigorous money management.
In the specific case there was a favorable risk-reward ratio (expected win / expected loss) just under 2.
The money management I use when trading in the direction of an exhaustion gap fill is the following:
- Stop loss at the high of the gap candle
- If the gap fills, move stop loss to breakeven
- If it reaches a level or relevant moving average and fails to break it, exit on trailing stop
I never choke potential profit: the gap fill is to be considered the minimum target.
This type of gap could also signal a trend reversal, so I always try to ride any possible wave.
In the specific case: gap filled, good downside move but recovered at week’s end.
The following week breakeven stop was at risk.
The third week finally tested, with bull victory, the MA20W (true driver of the bullish waves in this bull market since 2020, as shown in our posts on the S&P500 index) and exit on trailing stop.
Conclusion
Gaps carry a dangerous magic, a precarious balance between myth and reality.
The temptation to apply simple rules (“gap down buy”, “gap always fills”) is very strong. But it is demonstrable with a simple trading system that these simplifications destroy capital over the medium term.
Gaps are not automatic signals. They are information.
Used with discipline, they help avoid adding at the wrong moment, protect capital, reduce exposure when needed.
Sometimes they even offer high-quality trades, but only if you don’t believe the legend.
Verify it yourself on your charts and your markets.
Applying textbook rules vs a more selective price-action-based approach.
The equity line will tell you the truth.
Leave a Reply