


Weekly tracking of the Italian benchmark index.
Why do we do this? Check out our strategy page.
My proprietary DBBT indicator identifies misalignments between current price and expected technical levels on major indices.
Every week, we put the FTSE MIB in our crosshairs.
The hunt is on.
Another positive week for the Italian index, new long-term highs – but no price signal to confirm a breakout. A seemingly healthy uptrend: let’s see if it really is.
Bulls vs Bears
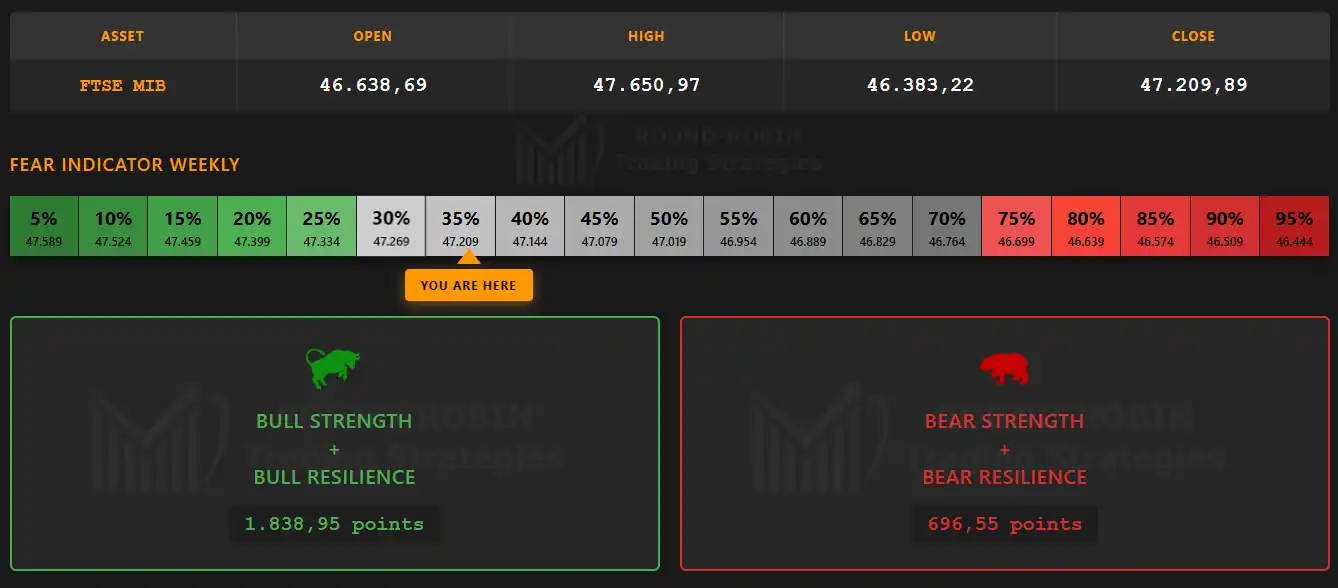
infographic: FTSE MIB weekly – Bulls vs Bears
The Italian index closes another positive week at +1.59% – enough to mark a new long-term high and a new long-term high weekly close, but not enough to call it a bullish breakout with a price signal. Another week totally bullish.
The Big Picture
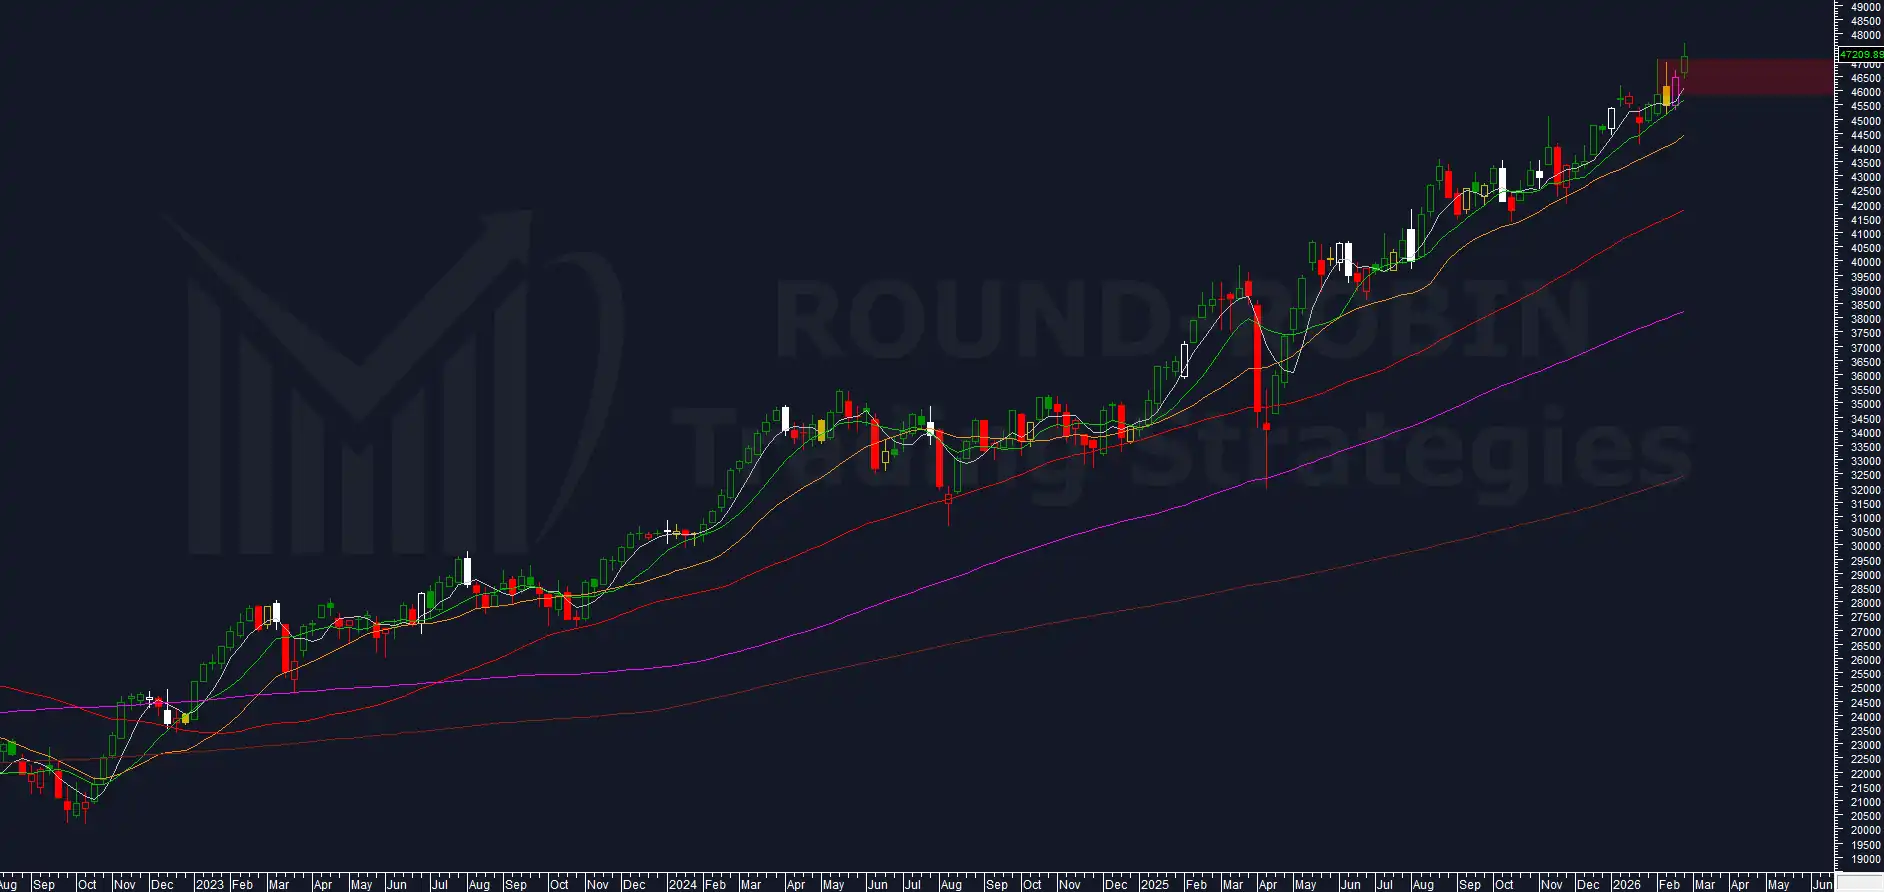
chart: FTSE MIB weekly
The weekly chart shows us that the close sits slightly above the upper shadow zone from 2 and 3 weeks ago, and it also shows bull overextension relative to the MA5W, but a meaningful break must come with a price signal – which we don’t see here.
All moving averages are still rising and aligned from fastest to slowest.
In this phase it looks like a seemingly healthy uptrend.
Let’s dig deeper to see if that’s really the case.
Volatility Indicator
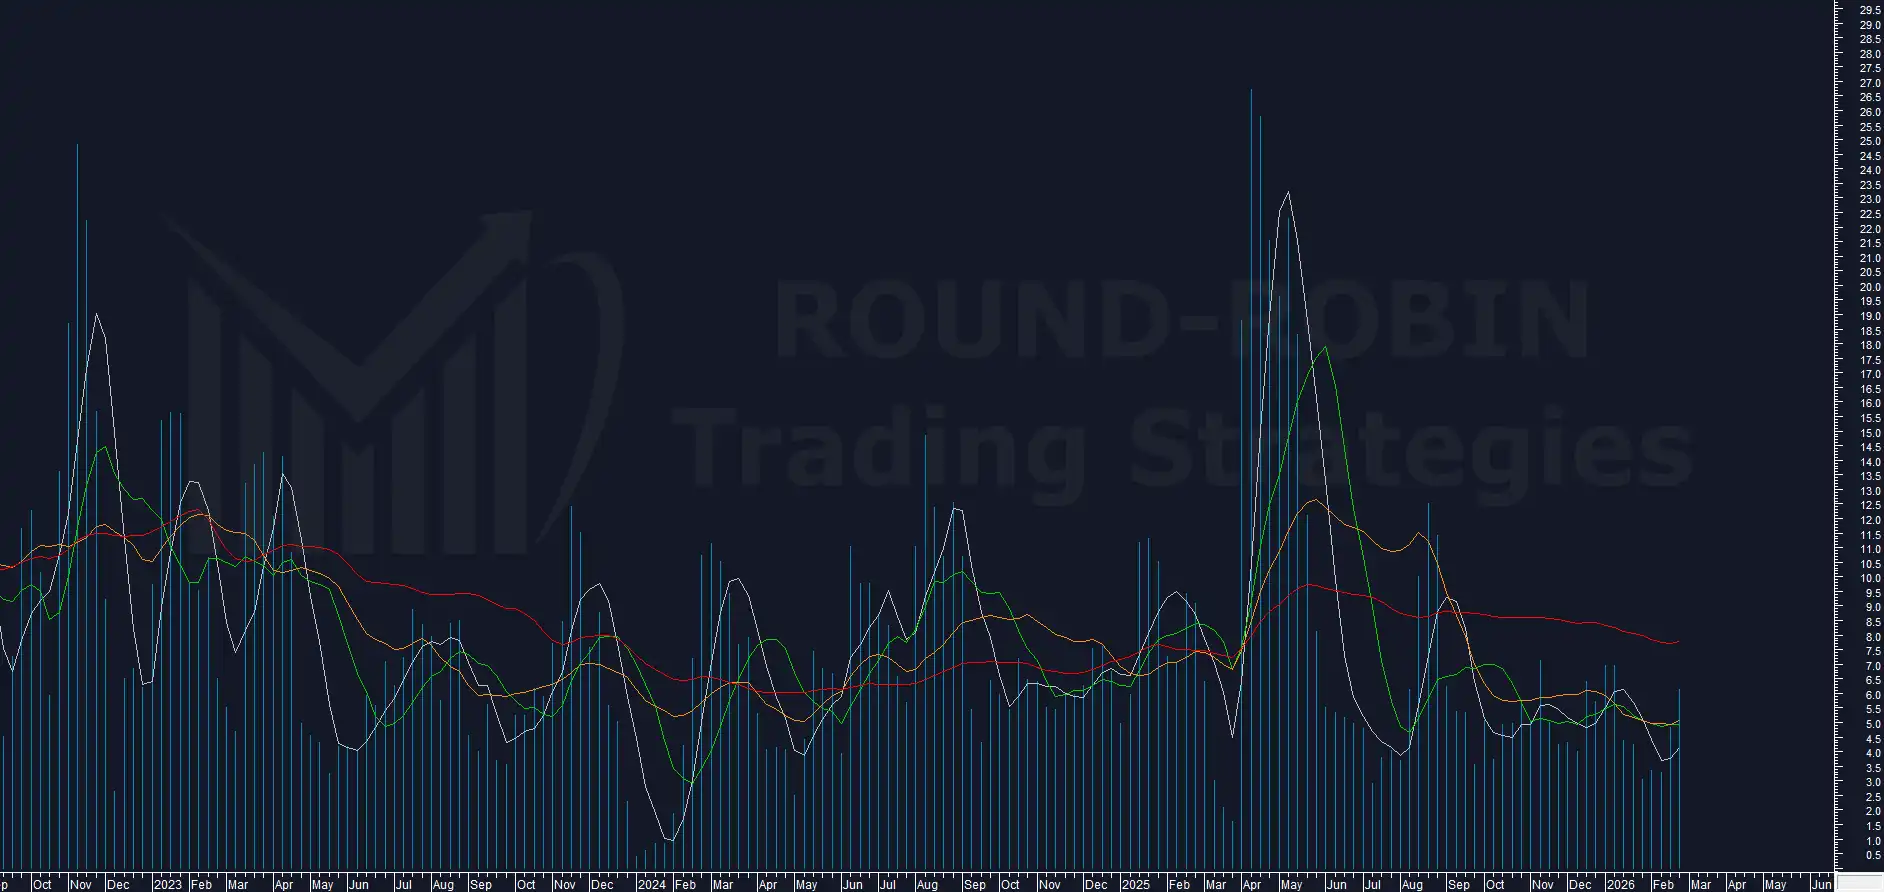
chart: FTSE MIB – proprietary Volatility Indicator
Nothing new here: volatility remains compressed.
This week at 6.16% we see an uptick, but it needs immediate confirmation to understand whether a trend – bull or bear on the index – is about to begin.
If next week it reaches and surpasses its MA50W (red line) at approximately 7.8%, there’s a good chance we’ll know which side to open a trade on.
RSI
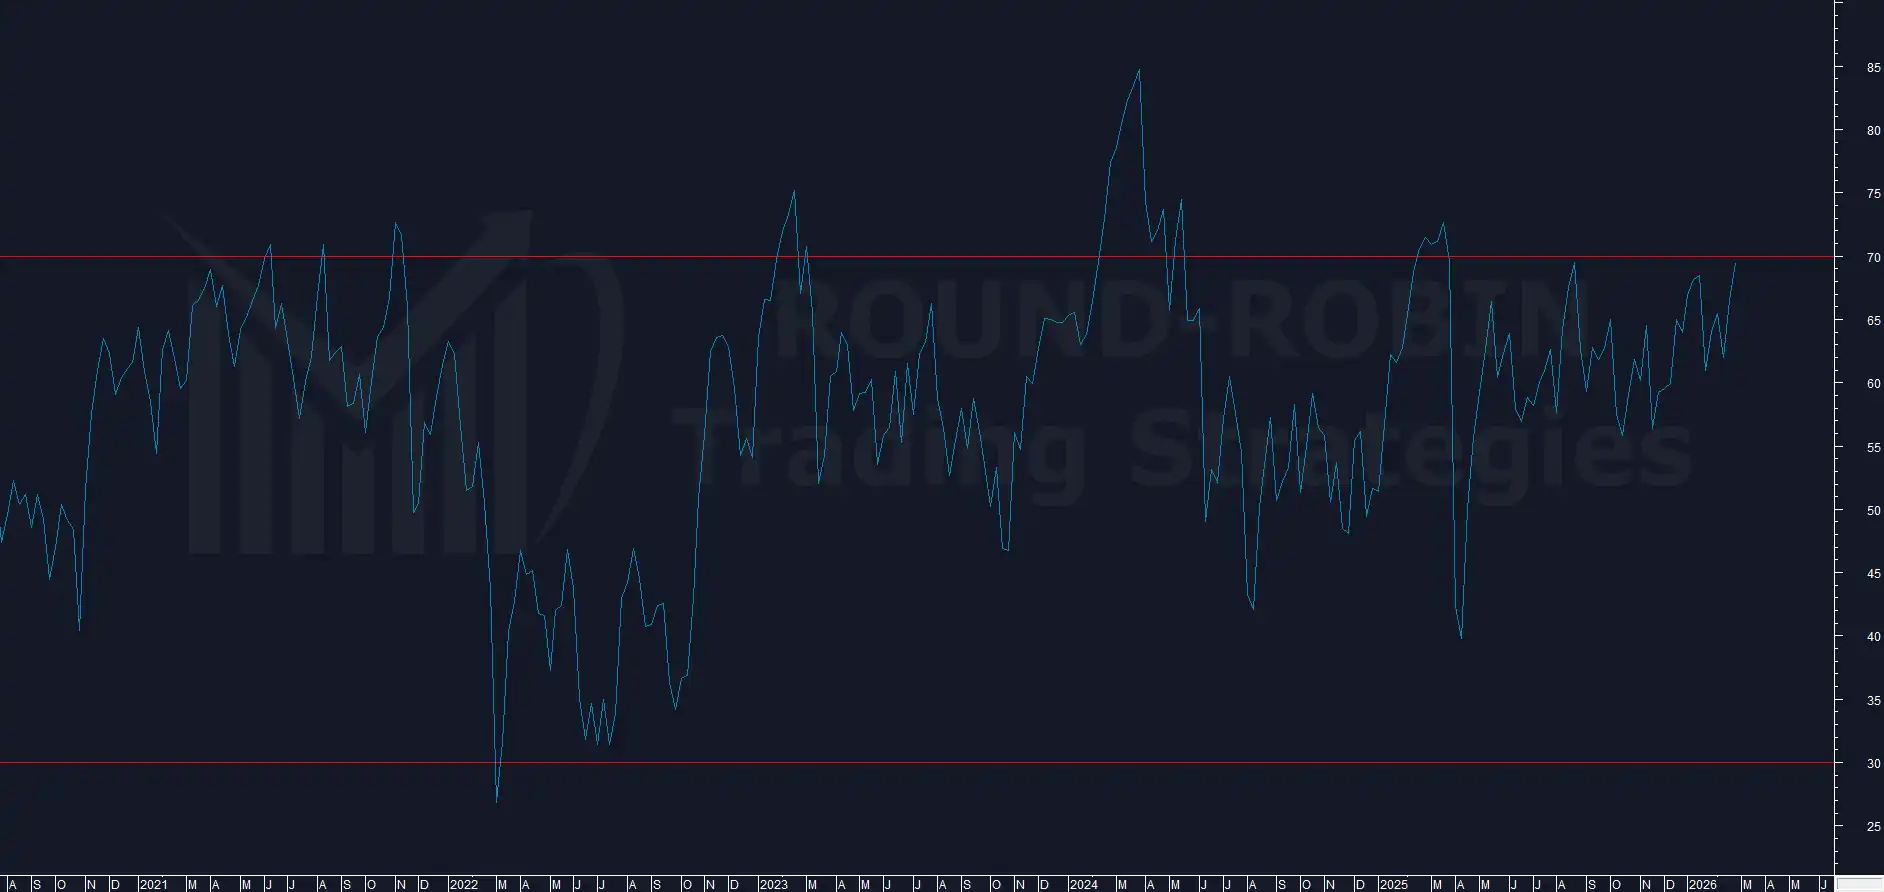
charts: FTSE MIB – RSI weekly
RSI has reached the warning levels we flagged in previous episodes.
For almost a year, weekly RSI has failed to reach overbought territory – and when it did, a sharp correction followed.
The expectation is that what we’ve seen over the past 12 months repeats itself.
RSI should reject from here and the index should at least consolidate.
This level doesn’t tell us whether a decline is likely – it tells us how unlikely a further rally is.
If instead the rally were to continue, we’d have RSI in overbought and – almost certainly – a strong price signal confirming the breakout above previous highs.
Daily
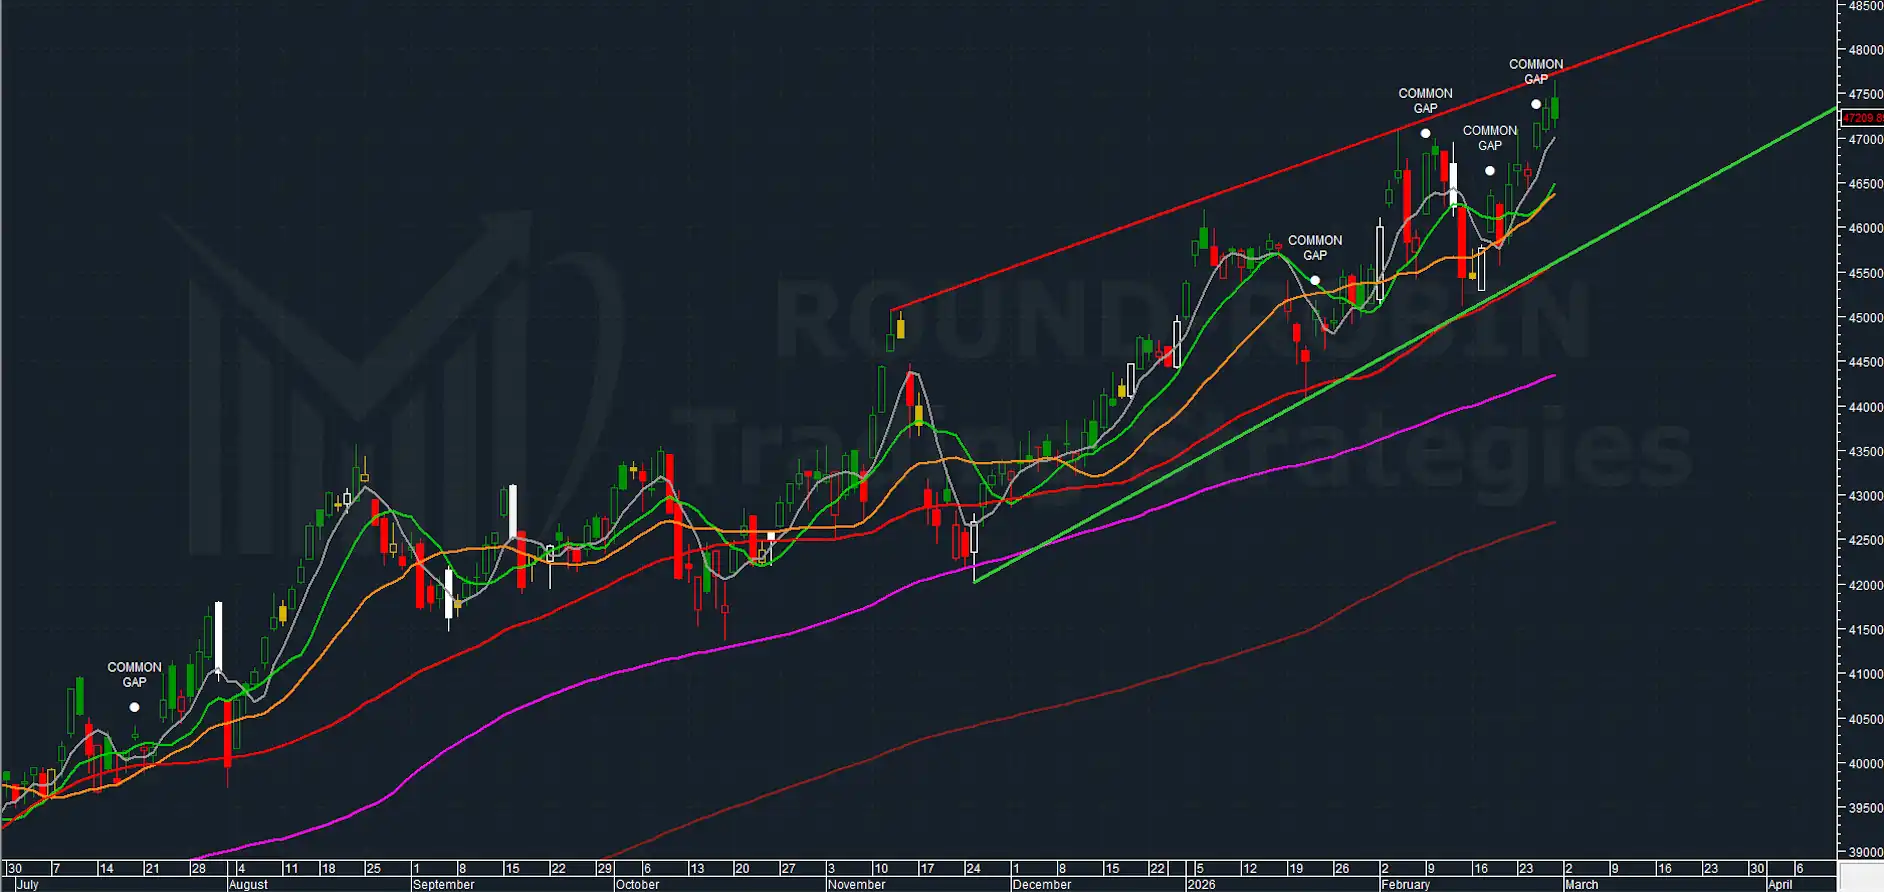
chart: FTSE MIB daily – Rising Wedge
One thing you should never do is try to identify a trend on a higher timeframe using a lower one.
In this case we’re not trying to make the FTSE MIB daily dictate the fate of the FTSE MIB weekly – we’re using it purely as a support tool, in case indications emerge that align with the weekly.
The daily is clearly contained within a rising wedge which, as we saw in Pattern Spotted, is a pattern with a very low reliability rate.
We have the fourth common gap since the start of 2026.
The previous three were closed immediately within the same week.
This latest one has survived and will at least make it through the weekend open.
What to expect?
The elements to consider are:
- common gap
- upper rejection from the wedge
- negative Friday close
- Friday close below open
The almost inevitable consequence is that the gap will be filled as early as next week.
It doesn’t always work this cleanly, but there’s no point overcomplicating things – this is what the current trend is telling us.
Conclusion
The index continues its ascent, but however healthy it looks, it seems driven more by inertia and the absence of bears rather than by conviction that prices are still attractive to buy.
The highly probable fill of the common gap at 46,742, opened on February 25th, would erase this week’s progress and could push the FTSE MIB back to the lower boundary of the wedge.
If that were accompanied by rising volatility (which according to our indicator started this week), we’d have good odds of getting a price signal on the weekly as well.
Bullish breakouts without the gap filling are not to be ruled out, but with the evidence we have so far, such a move should be short-lived and fully reabsorbed – the same indications coming from a potential rally in the S&P 500 (as analyzed in our dedicated articles on the American index).
Soon only members will access this content. Subscribe free.
Leave a Reply