


Pattern Spotted is our format where we analyze patterns and configurations as they appear in the markets.
This week we discuss the Rising Wedge – one of the most abused and overused patterns in technical analysis history.
How little this pattern is worth – when applied by the book – has already been demonstrated by modern literature on the subject and by this week’s Pattern Decoded.
As always, let’s look at some real cases in detail.
EUR/USD
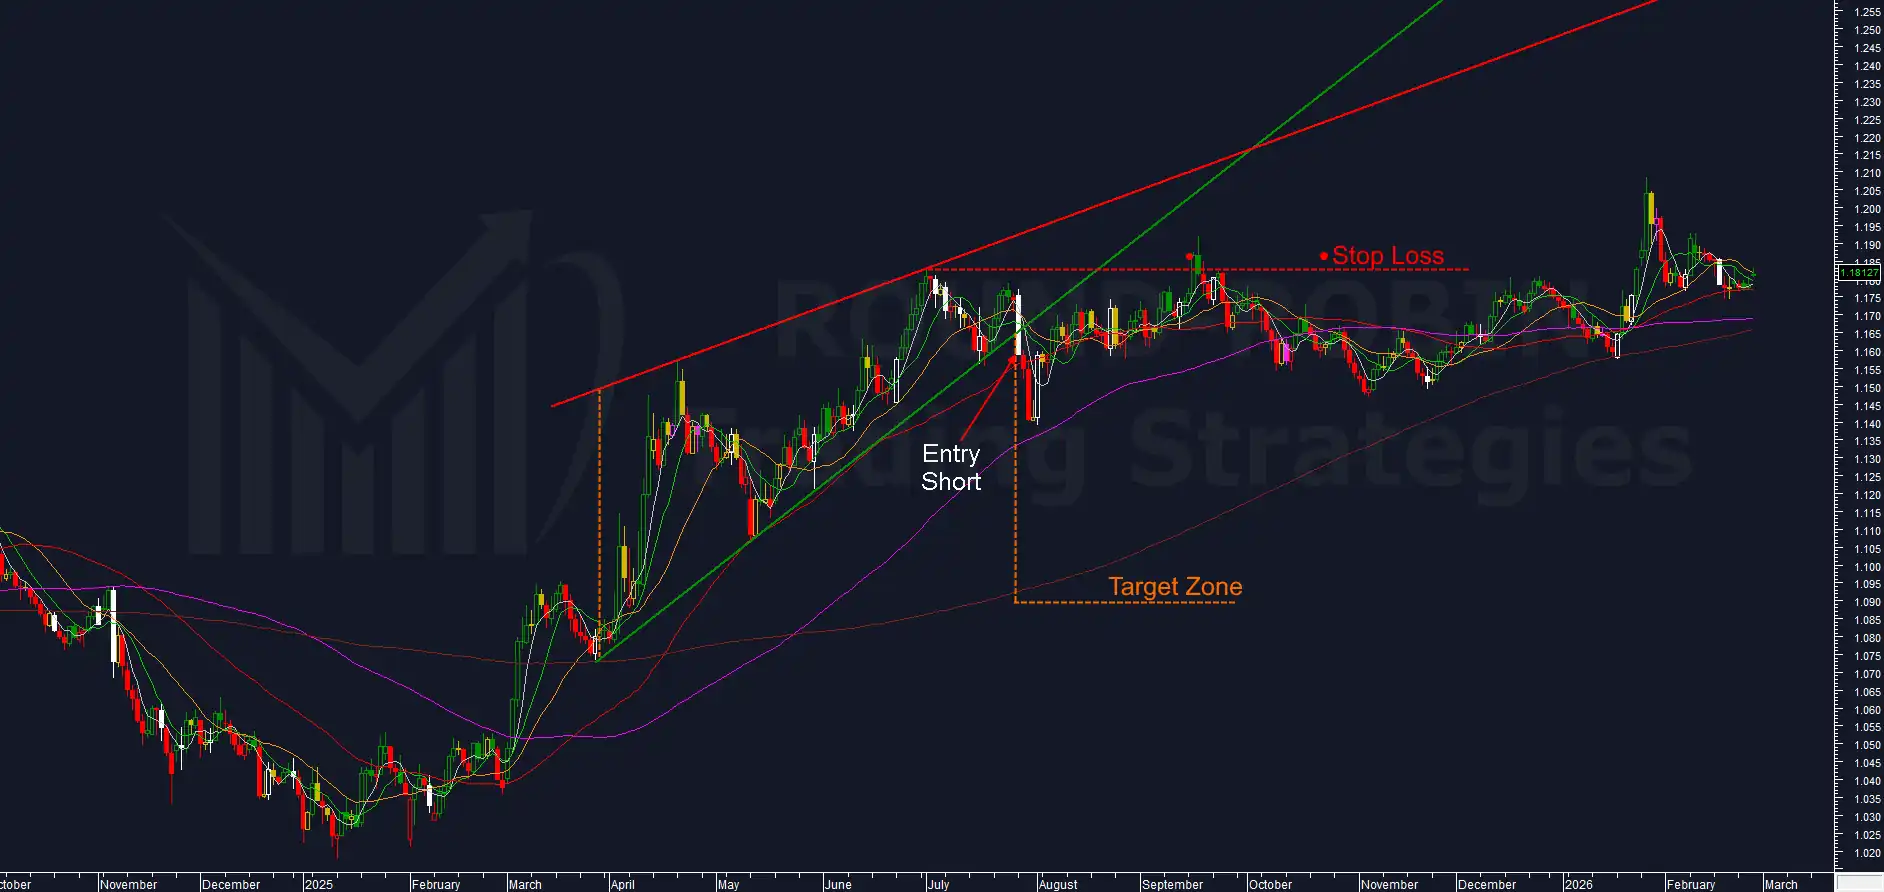
chart: EUR/USD daily – Rising Wedge
From March 2025 to July 2025, the daily chart showed rising lows and rising highs – but the highs were climbing at a shallower angle.
The lower trendline (green) touches three points.
The upper trendline (red) touches two.
The setup requirements are met.
A large candle breaks the green trendline and triggers the short entry.
Perfect – on paper.
On social media, whenever a setup like this appears, the crowd screams for everyone to run for the exits – spreading the certainty that a swift, devastating bear market is about to unfold.
We know that’s not true. It’s been demonstrated.
This chart proves it once more.
Prices accelerated further to the downside only for the session after the break, then began climbing back – all the way to the September stop loss.
An unlucky stop, yes – hit by a narrow margin.
But it would have been hit anyway, even if months later, because by February 2026 prices had pushed well beyond. Instead the target zone was never even approached.
What went wrong?
From my perspective, this was a low-probability trade from the start.
If we look at how the bull market originated, two elements stand out in March 2025:
- Break with a price signal of the MA100W
- Break and throwback with a price signal of the MA200W
Deduction: at least one of these two would trigger a bullish reaction.
If it’s the MA200W – fine, because the MA200W “coincidentally” sits right at our target zone.
But if the MA100W is what started the whole move, then you’re heading into serious trouble.
Which is exactly what happened.
Beginner’s voice: “So in the EUR/USD case, it would have been enough to wait for the MA100W break to trade?”
Partially true:
- The break is a necessary but not sufficient condition.
- The MA100W needs to be broken with a price signal – not by inertia, as eventually happened in October/November 2025. That break occurred on an already flat MA100W, without a single candle delivering a real signal of strength.
- Even if the break had occurred with conviction, the risk/reward ratio would have collapsed – because the expected target (the MA200W) had meanwhile moved much closer to the MA100W.
A note: in January 2026, it was precisely the MA200W that triggered the new bullish impulse.
As we always emphasize: what starts a trend – whether an oscillator, an indicator, or a price signal – is often the very thing that will later sustain it or put an end to it.
EUROSTOXX 50
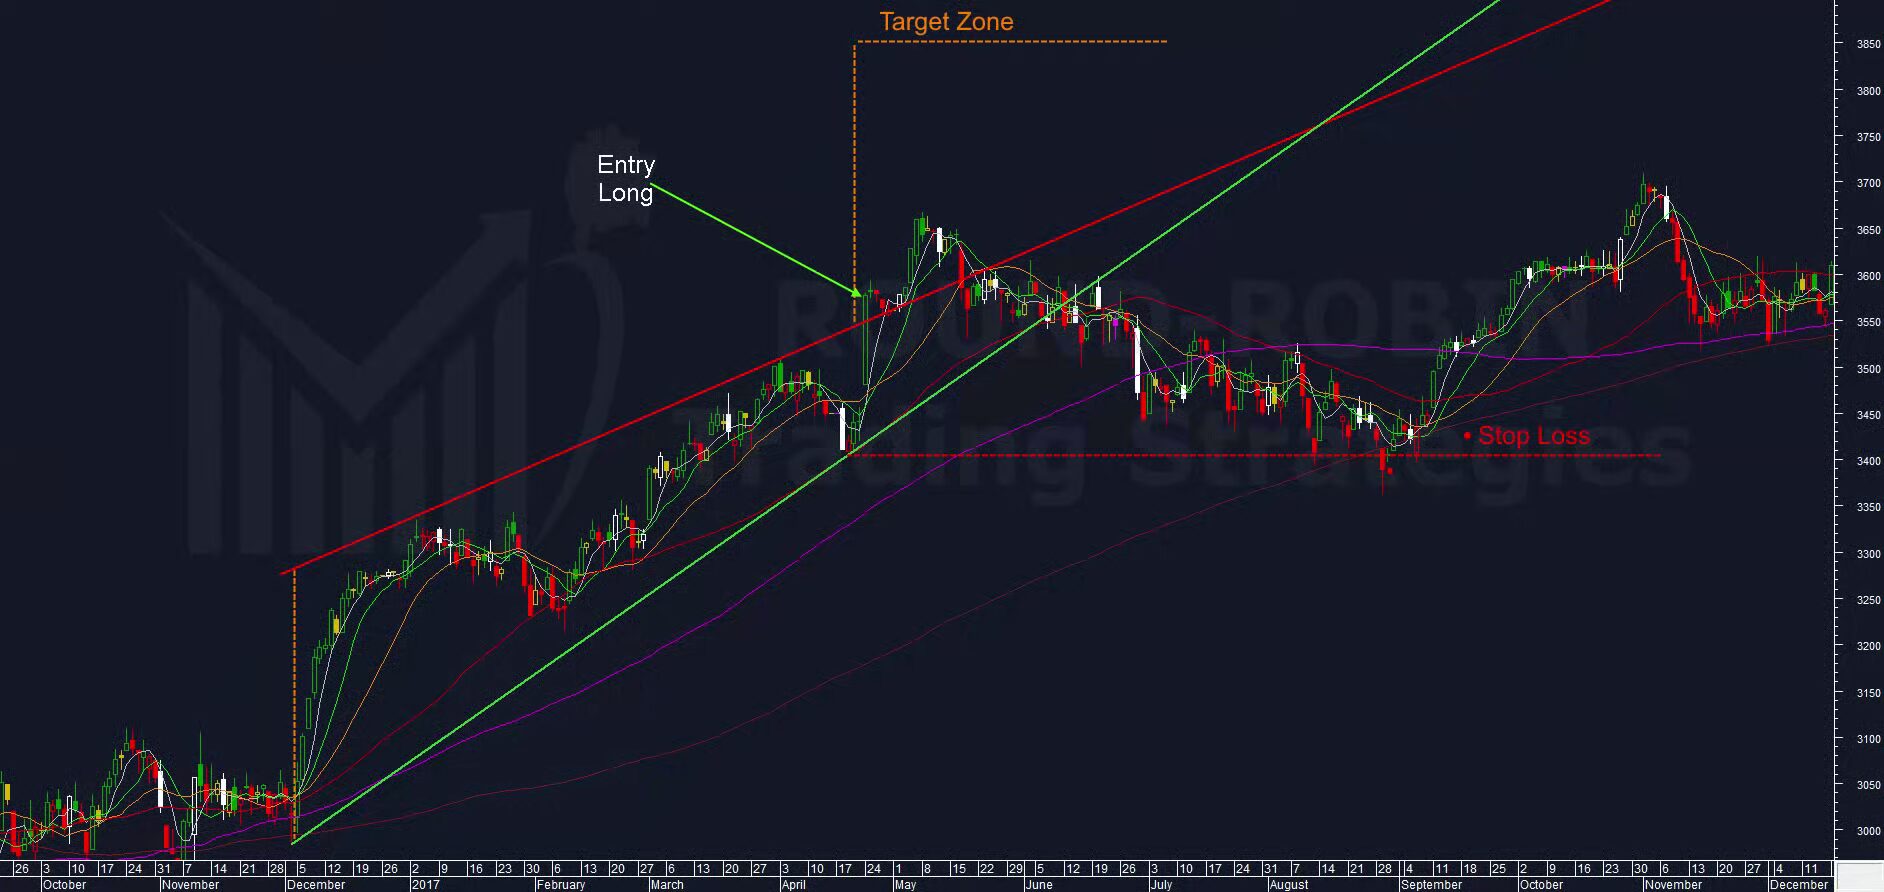
chart: Eurostoxx50 daily – Rising Wedge
Another failure – this time with an upside breakout.
This was a textbook signal for the Rising Wedge.
Upside break of the upper trendline with a massive bullish candle – a strong price signal.
Immediate throwback.
Immediate bullish wave.
Three sessions after the throwback, I challenge anyone to believe this wedge would fail miserably.
We know that post-throwback success probabilities are high.
There were no other apparent reversal signals.
Yet gradually, session after session, the initial sprint was first absorbed, then cancelled.
Anyone holding the position would have gone straight into a loss.
Note: here too, the stop loss was hit with surgical precision – just like in the EUR/USD case.
Silver – Daily
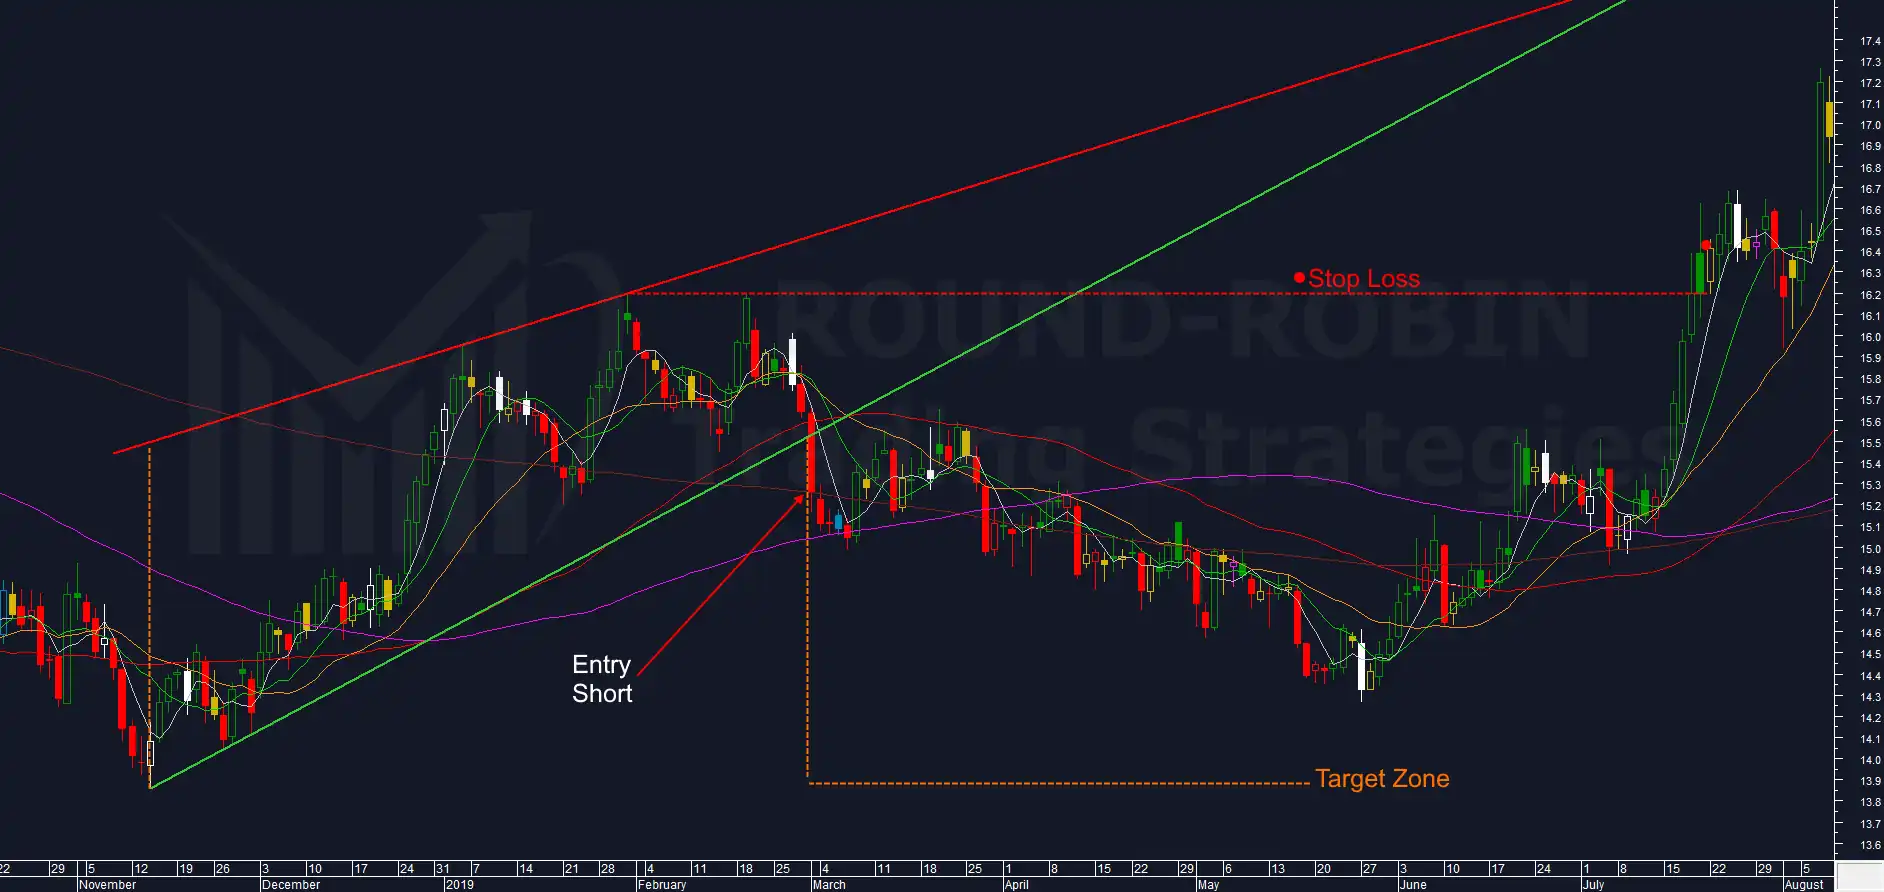
chart: Silver daily – Rising Wedge
Another clean Rising Wedge.
A beautiful break candle.
And a slow, infinite bear market that will never arrive at the target.
Beginner’s voice: “OK, we get it – the Rising Wedge doesn’t work. No point showing another failure on a different asset. There must be winning cases too.”
There are winning cases.
But on major assets – indices, commodities, forex – the statistical results are even worse than what Bulkowski showed across 1,400 American stocks.
I included this case specifically for discretionary traders.
A system almost always has a time expiry: if it doesn’t reach the target (or the stop loss) within a reasonable timeframe, the algorithm closes the trade.
If – as with Silver – a daily price signal arrives and after three months you’re still not at target (even if close), you have one certainty: you’re no longer trading that price signal.
You’re trading something else – often a hope. Look at Silver here: prices are reacting to moving averages – both as resistance and as support.
FTSE MIB – Daily
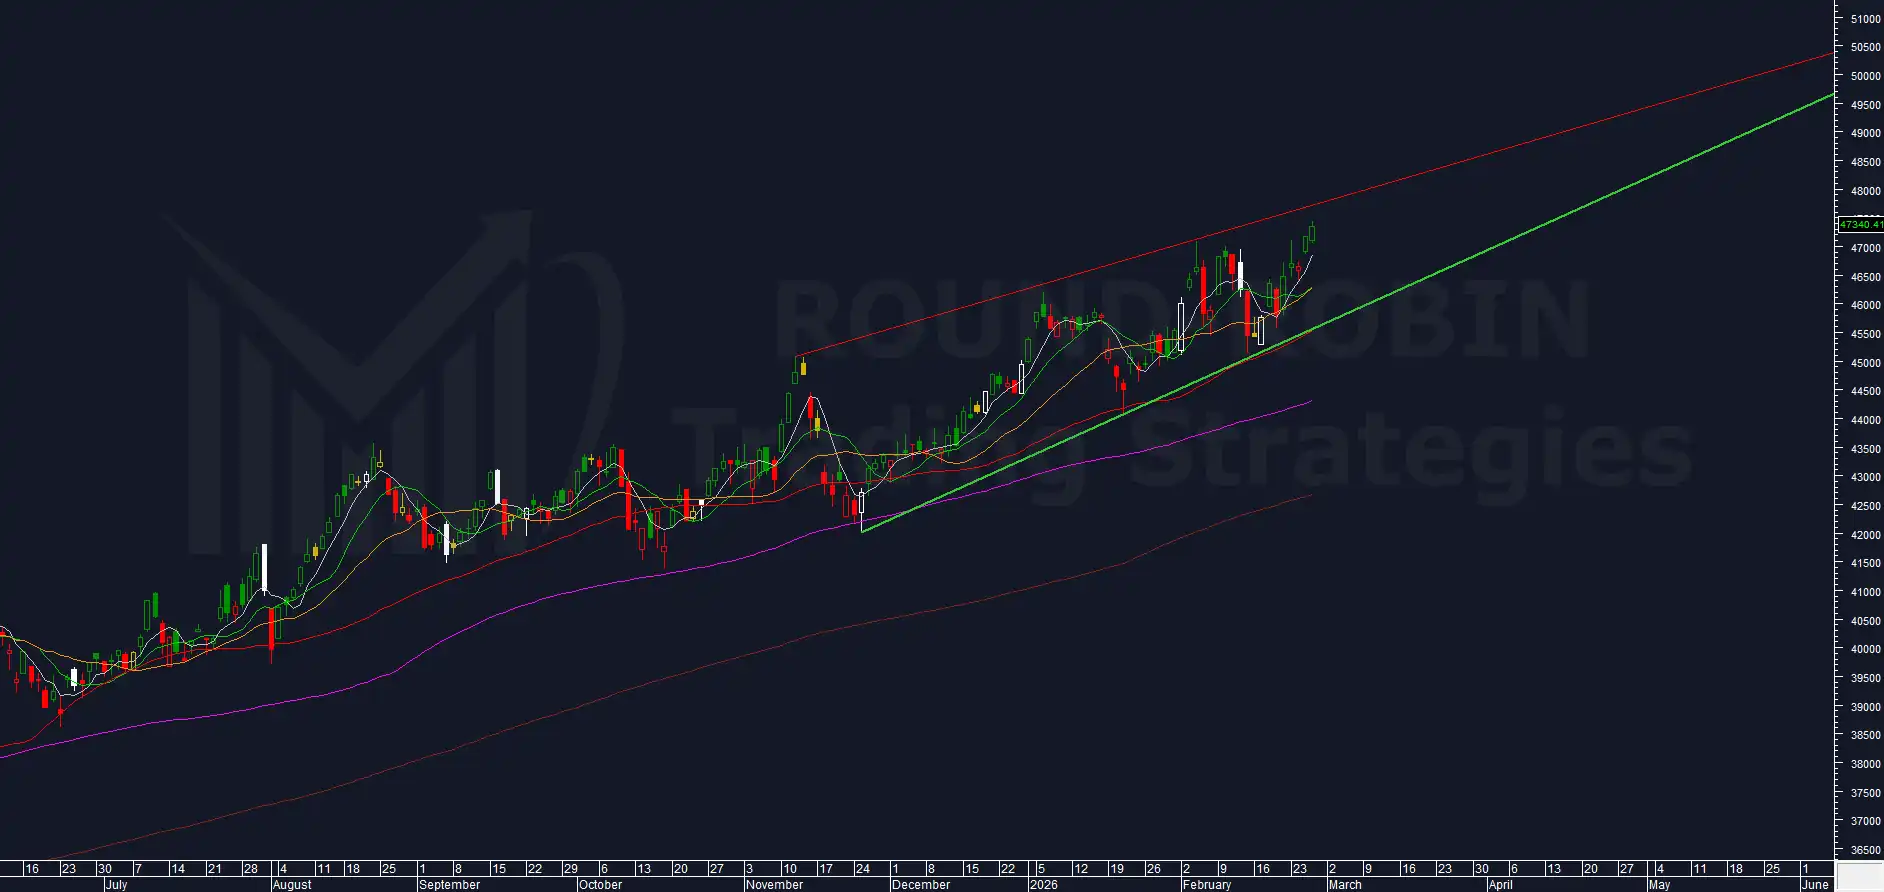
chart: FTSE MIB daily – Rising Wedge
To prove I have no bias against this pattern, let’s take one that has just formed on the FTSE MIB daily.
The wedge is set to exhaust itself around June, so it’s reasonable to expect a break of one of the two trendlines between April and May at the latest.
In the previous session, the FTSE MIB printed what appears to be a common gap.
If we’re identifying it correctly, the upper trendline should hold once more and push prices back down.
But if it is indeed a common gap, then even an eventual upside break could turn out to be yet another failure of this pattern.
In case of a downside break, pay close attention to the MA100 (purple).
If it sits too close to the break point, the trade will have a poor risk/reward ratio.
The reason is straightforward: since June of last year, the FTSE MIB has consistently reacted to its 100-day moving average.
Will this be yet another Rising Wedge failure on an index?
We’ll keep monitoring it and will update this situation in our weekly studies on the Italian index.
Conclusion
The Rising Wedge remains the most misunderstood pattern in technical analysis.
On major assets, the results are even more discouraging than those documented across American equities.
The breakdown fails more often than it succeeds.
The breakout to the upside, while statistically superior, is no guarantee either.
Drawing two converging lines and placing a trade is not a strategy.
It’s a coin flip – or worse.
The Rising Wedge needs context: moving averages, price signals, risk/reward discipline, and – for discretionary traders – a time expiry.
Without these, you’re not trading a pattern.
You’re trading a belief.
Leave a Reply