


Quick observations on the charts that caught our eye this week.
This week’s flash covers EUROSTOXX50, S&P 500, Nikkei 225 and DAX.
Gold and Silver remain flat with no relevant changes and are not updated.
The EUROSTOXX50 closes at +30 points on the week, with a sharply expanding range that fails to produce direction.
The S&P 500 closes its fifth consecutive week higher: +168 points (+2.33%).
The Nikkei 225 prints a +5.38% gain in a week reduced to two sessions due to holidays.
The DAX closes the gap down on the February 27 low, but the upper shadow tells the story of a decisive bearish reaction at the highs.
Let’s dig a little deeper.
⚡ EUROSTOXX50
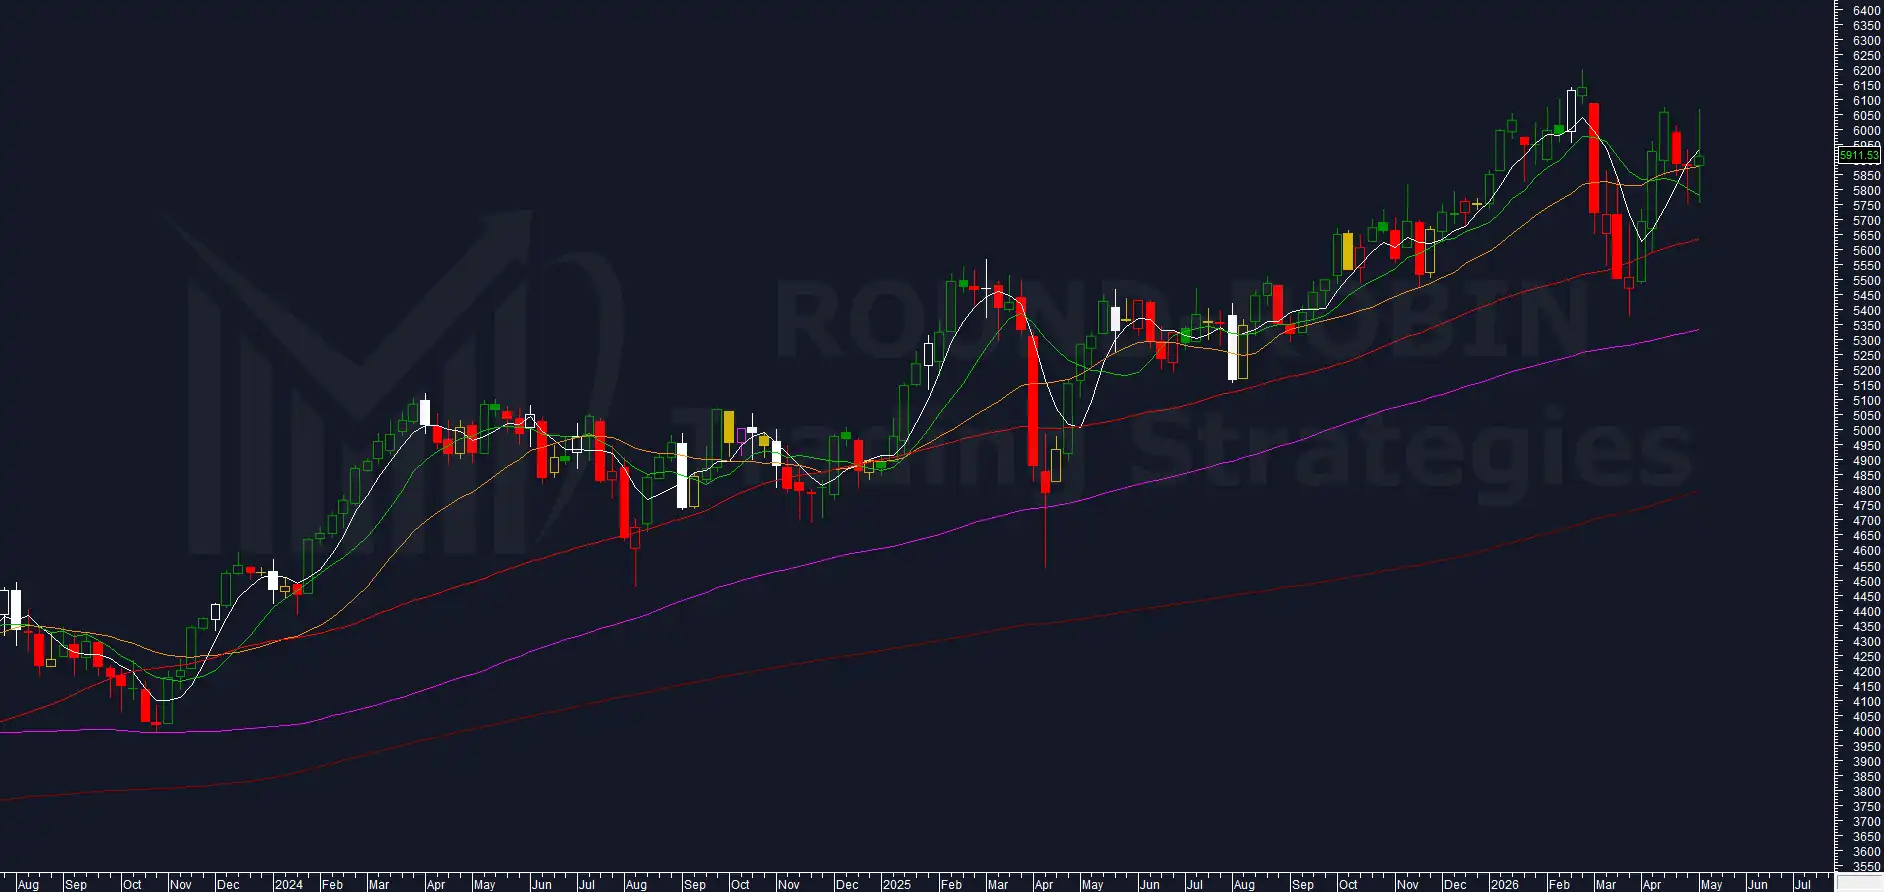
chart: Eurostoxx50 weekly
In last week’s Charts Flash the system was Short with lower highs and lower lows for the second consecutive week. Price had tested below the MA20W and MA10W during the week before recovering both at the close.
This week the structure changes: higher highs and higher lows. Price uses the MA10W as support and holds above the MA20W.
The candle body is slim: just +30.02 points from the prior week, a minimal advance that contrasts with a sharply expanding weekly range.
The wide upper and lower shadows tell the story of a market that explored both directions with conviction, without committing to either. The weekly close is 5,911.53.
The system remains Short. This week’s extremes could prove significant in shaping the near-term trend.
⚡ S&P 500
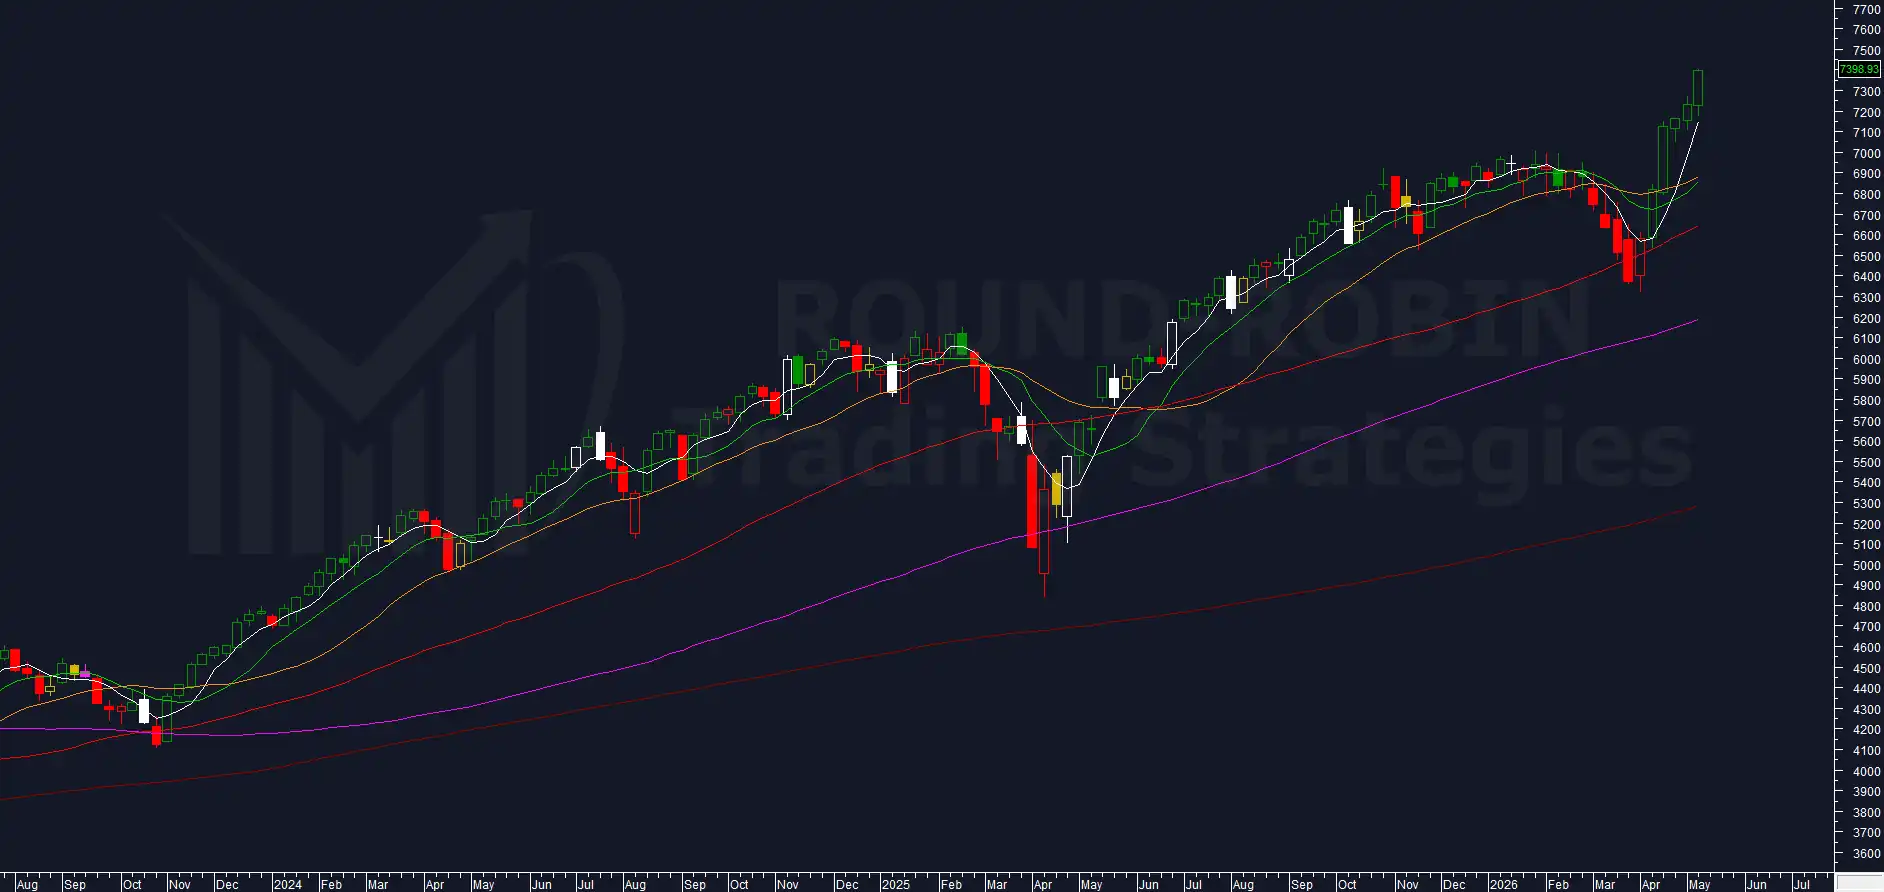
chart: S&P500 weekly
In last week’s Chart of the Week the system was Short on historical excesses, with the overextension above the MA200W at 34.94% and a parallel with the year 2000 still open. The loss stood at approximately 65 points and the market was at a crossroads.
The crossroads resolved to the upside. Fifth consecutive week of higher highs and higher lows, weekly close at 7,398.93, up 168.81 points (+2.33%).
The break above the early-2026 highs is now real: no longer a compressed advance, but a genuine extension that pushes price to levels that challenge the bearish setup.
The overextension above the MA200W rises to 35.74%, matching the 2026 highs.
The system’s short is paying the price and is approaching the stop loss. Unless the coming week shows clear bearish presence, the exit is imminent.
⚡ NIKKEI 225
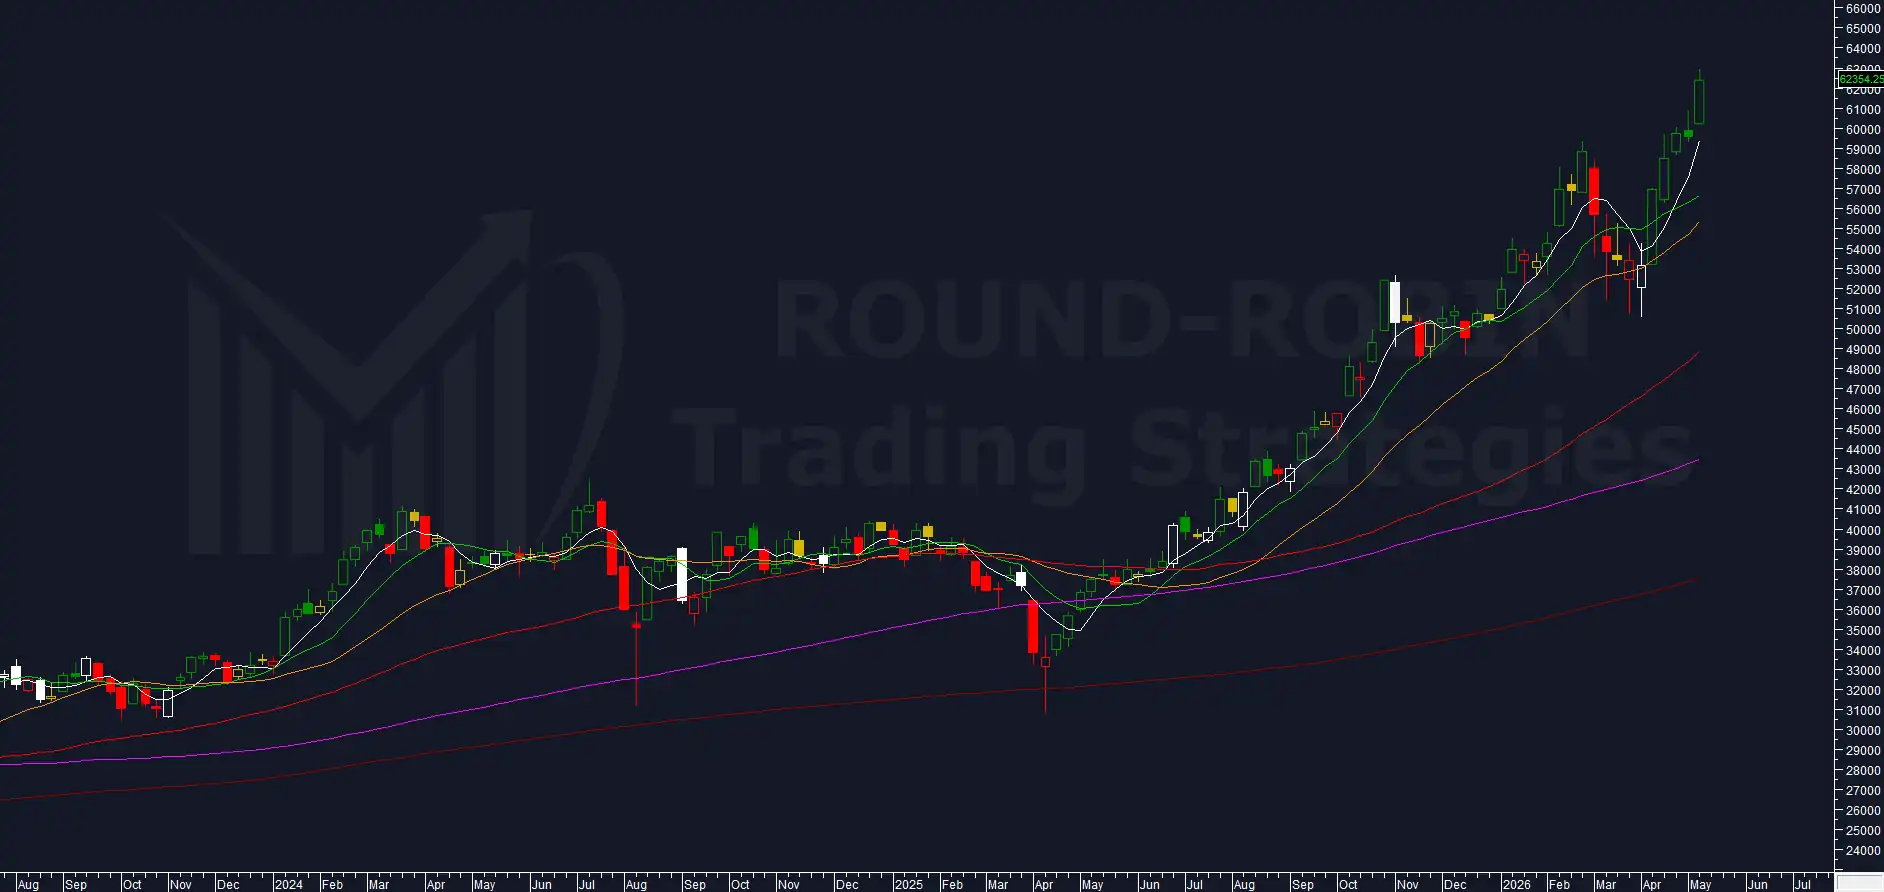
chart: NIKKEI weekly
Last week the Japanese index had set a new all-time intraday high at 60,903.95 without managing to confirm it on the close, ending the week in negative territory with a bearish body. The overextension above the MA200W stood at 58.62%, an all-time record.
This week the picture reverses entirely. A shortened week — three days of national holidays — with the Nikkei opening on Thursday with a 5.6% rally and printing a candle of exceptional bullish strength.
Sixth consecutive higher high and a new all-time record, fifth week of higher highs and higher lows. The weekly close is 62,713.65, up 3,200.53 points (+5.38%).
The overextension above the MA200W reaches 60.39%: a new all-time record, above 60% for the first time ever. The gap between price and the long-term moving average is in uncharted territory.
The system is approaching the stop loss. The coming week will likely be decisive.
⚡ DAX
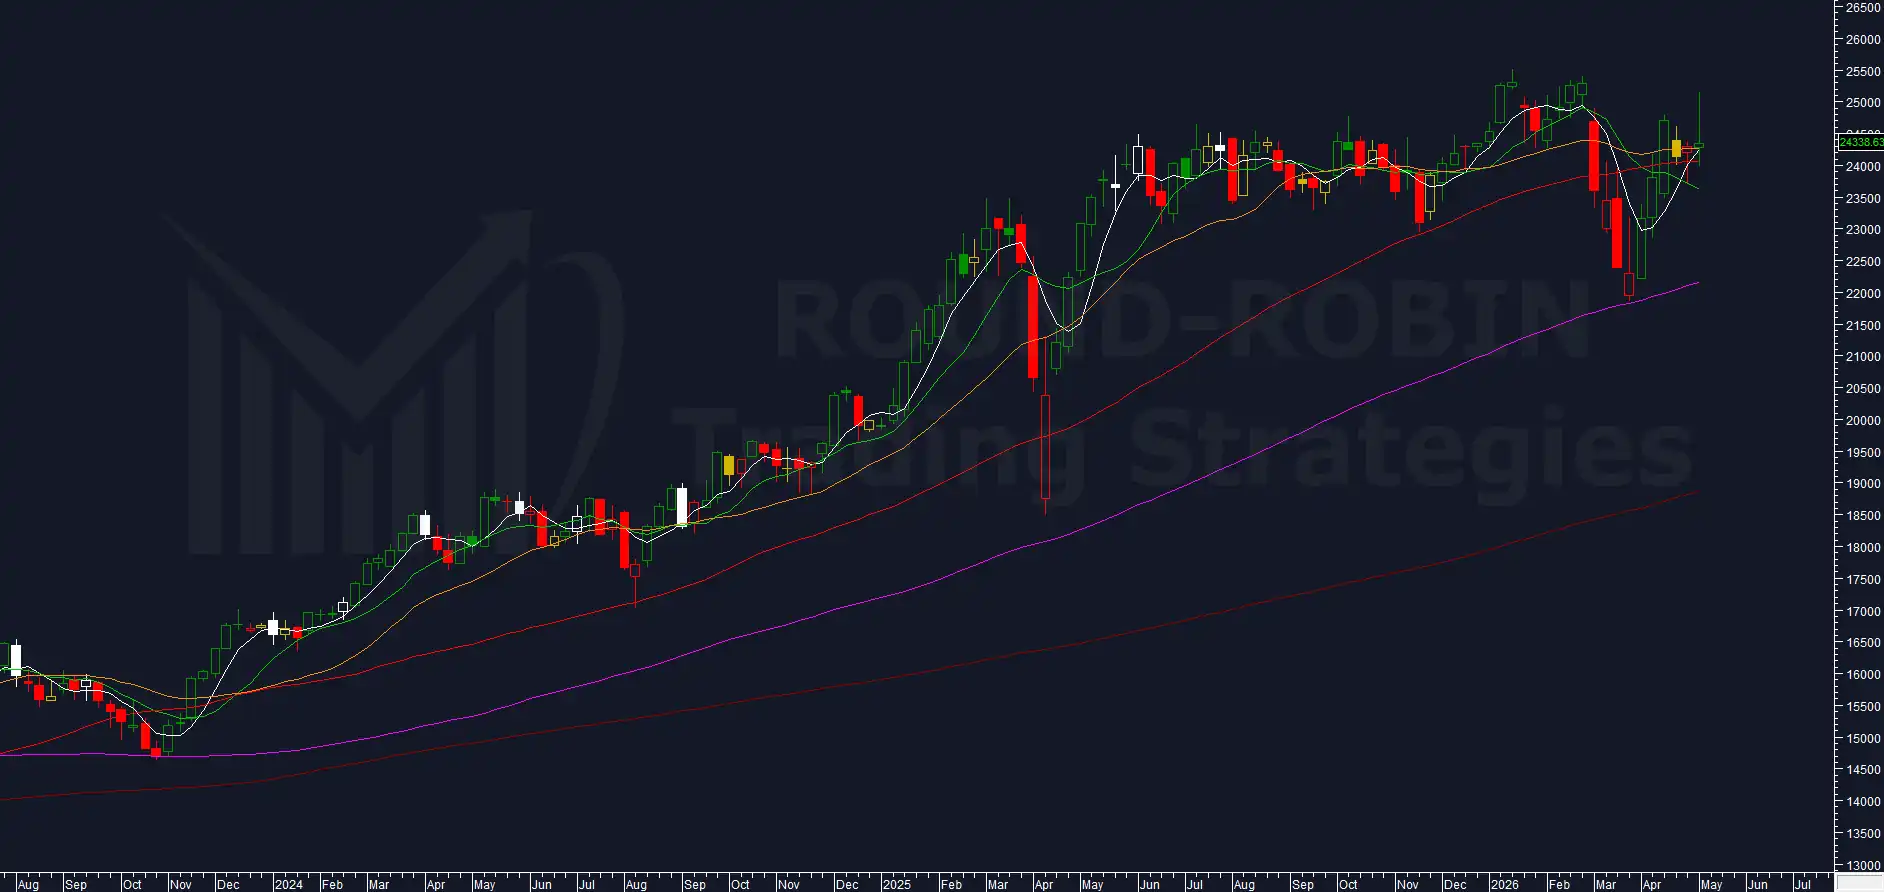
chart: DAX weekly
In last week’s Charts Flash the system was Short with a bearish structure — lower highs and lower lows — but a bullish body. There was room for a bullish swing, but it was expected to be limited.
The swing materialised: higher highs and higher lows, with a weekly extension sufficient to close the gap down on the February 27 low.
The upper shadow is long and pronounced — even more so than on the EUROSTOXX50. The weekly high stands as a bear intervention zone of clear significance.
The weekly close is 24,338.63, up 46.25 points: a modest advance relative to the overall weekly excursion.
The system remains Short.
Leave a Reply