


A weekly appointment with the most watched charts in the world.
Last week’s Chart of the Week was dedicated entirely to the S&P 500, with a bull high volatility reading not seen since March 2000 and a system entering short on historical excesses.
This week the market responded: a new ATH on both the high and the close.
Meanwhile the Fed held rates unchanged, confirming the wait-and-see stance already seen in the prior meeting.
No surprises on the macro front, no capitulation on the technical front.
The market keeps climbing.
Bulls vs Bears
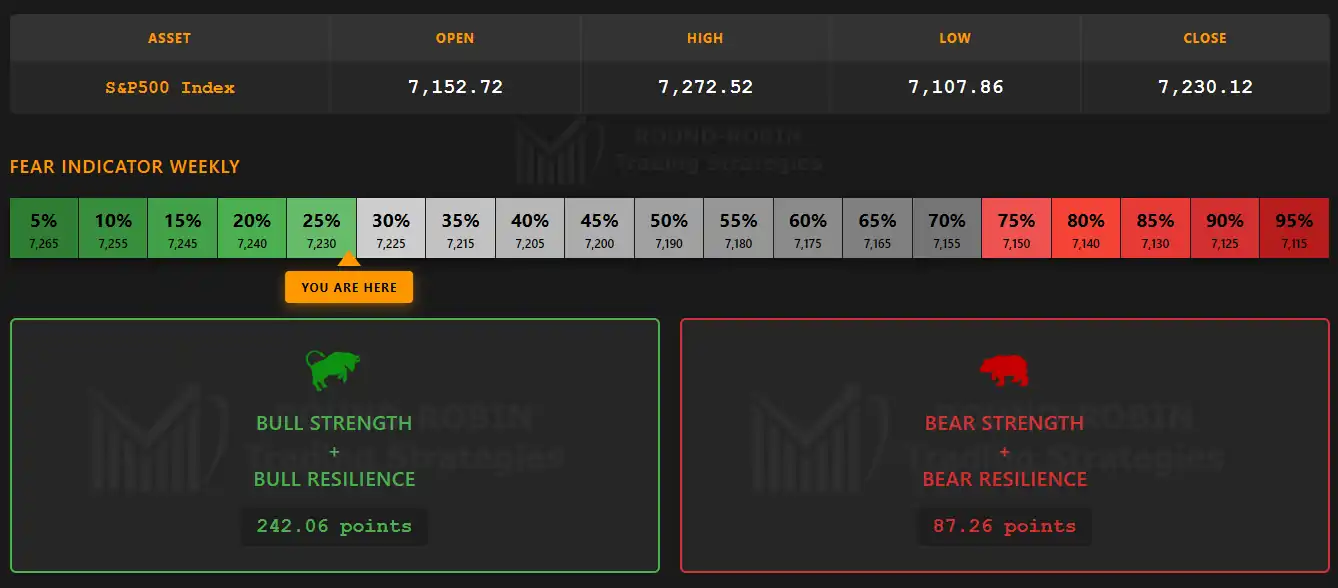
infographic: S&P500 weekly – Bulls vs Bears
A slight continuation, consistent with the prior two weeks.
242 bull points against 87 bear, Fear Indicator at 25%.
A market advancing without pushing, with a weekly range that does not tell the story of a convinced breakout.
The Big Picture
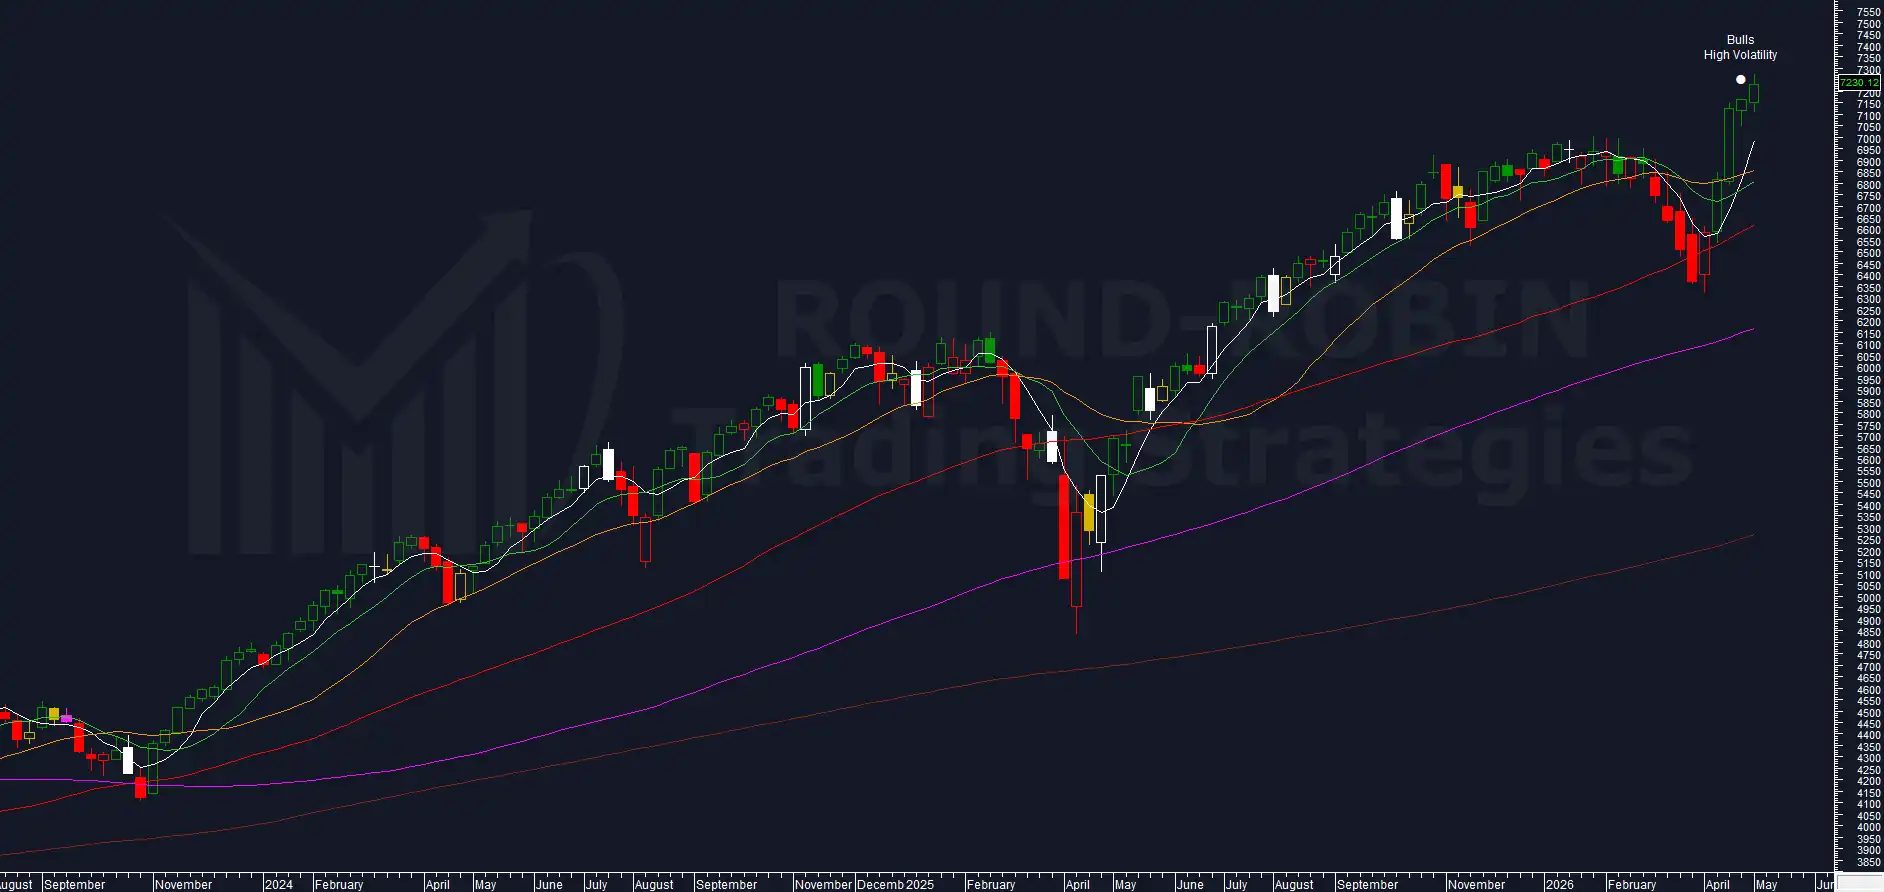
chart: S&P500 weekly
Weekly close at 7,230.12.
Fourth consecutive week of higher highs and higher lows.
While it is true that the last two weeks have seen only a modest advance, the S&P 500 has printed a new ATH on both the high and the close: a fact that cannot be ignored.
The MA10W remains below the MA20W: the moving averages have not yet recovered from the bearish cross generated by the March correction.
The MA5W has developed an inclination that is difficult to sustain, dragged higher by the V-shaped recovery of recent weeks.
Overextension Above MA200W
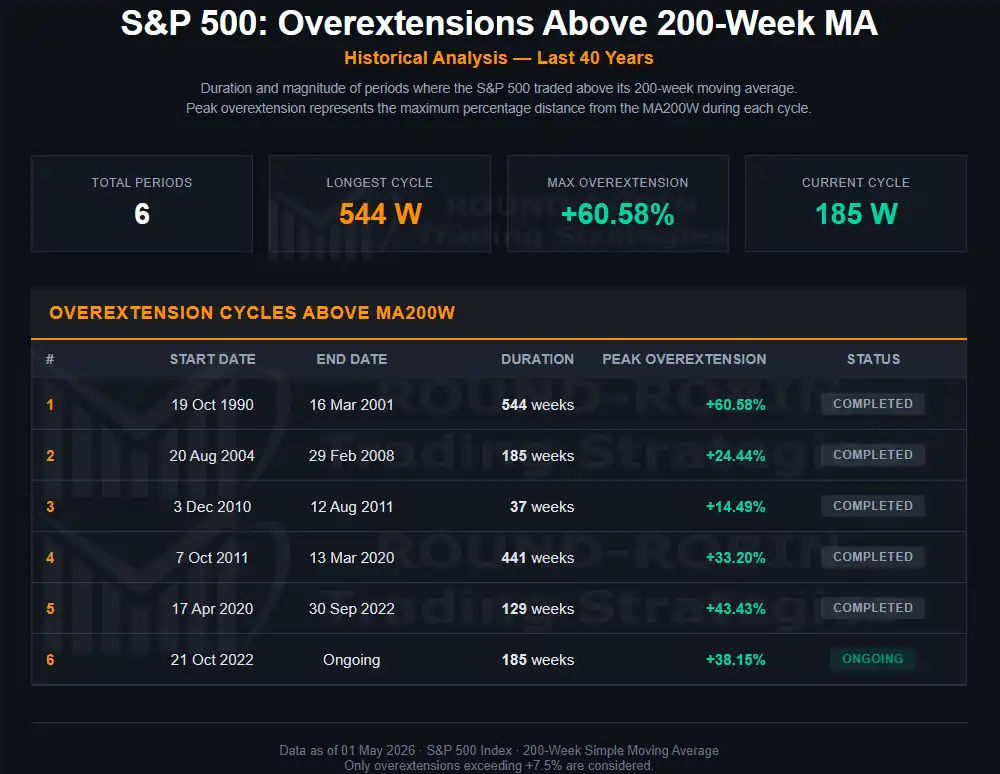
Table: S&P 500 Overextension Cycles Above MA200W (1990-2026)
Week 185 of the current cycle. The overextension above the MA200W edges slightly higher to 34.94%.
The implications remain unchanged from the previous analysis: the V-shaped recovery has reversed the compression that was progressing cycle after cycle toward historical mean reversion, pushing the overextension back above 30% and toward the 2025 peak of +38.15%.
Volatility Indicator
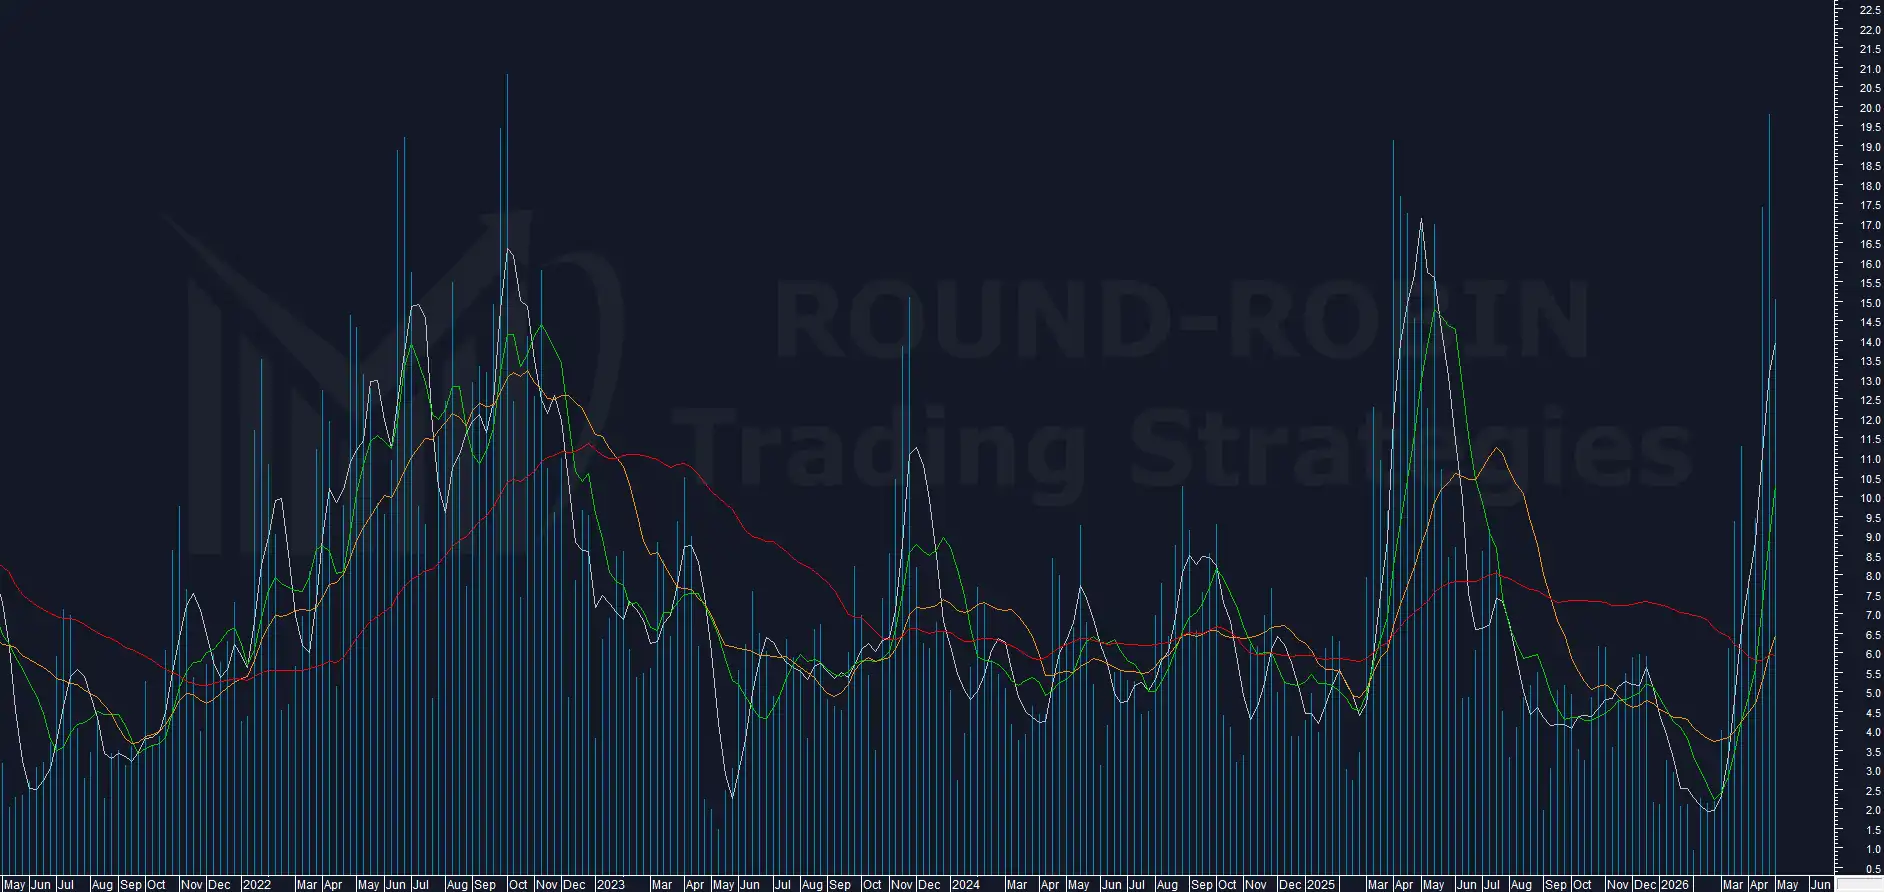
chart: S&P500 – Volatility Indicator
The peak flagged in the previous analysis is confirmed: the indicator drops to 15.08%.
A reading in contraction, but still elevated.
The weekly range stands at 2.32%, below all fast and slow moving averages: the market is not generating breadth, it is advancing in compression.
BCP3
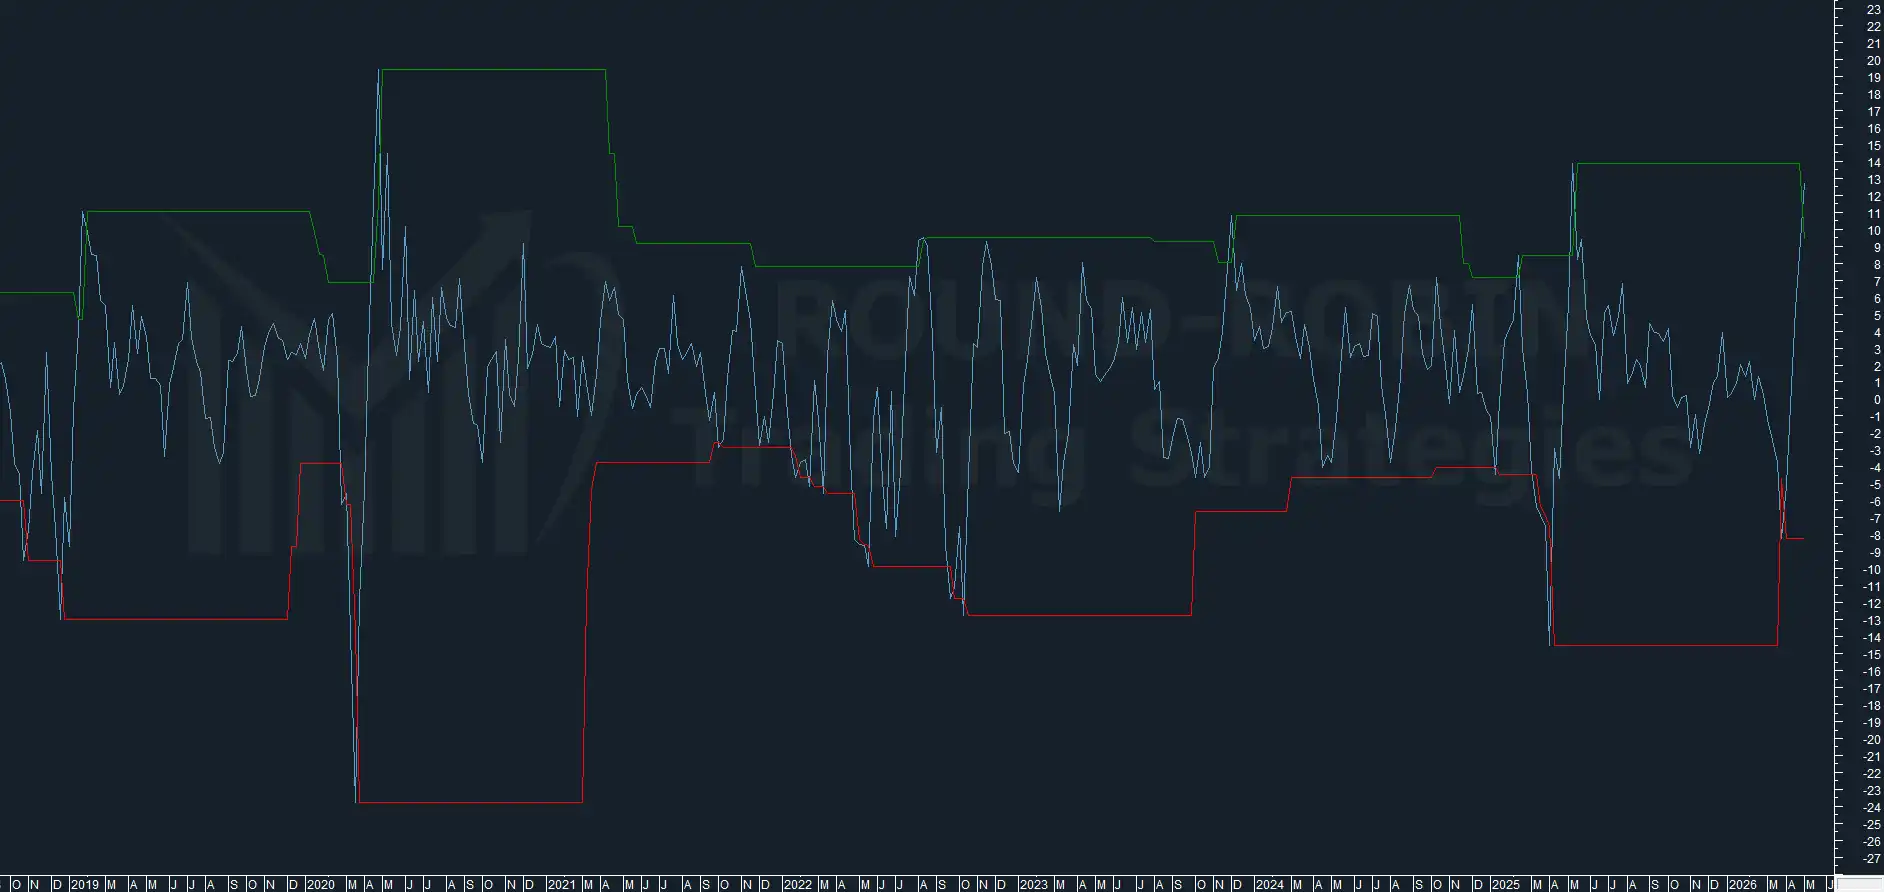
chart: S&P500 – BCP3
As expected, it reaches the peak of this bull swing: 12.73%.
The second highest reading of the past five years, exceeded only by the 13.86% registered in May last year.
One more extreme added to an already crowded table.
The 2000 Parallel
The parallel with the 2000 bulls high volatility break remains valid.
No correction has materialized, but this cannot yet be called a true continuation: two weeks of compressed advance following a violent break of the all-time high do not constitute sufficient strength to invalidate the toppish setup.
In 2000 the market took several weeks before revealing its real direction.
We are still in that window.
Conclusion
The system is carrying a loss of approximately 65 points.
Nothing compromised: this is the cost of an early entry on historical excesses, without waiting for a price signal.
The same pattern played out on Silver and Brent Crude Oil: early entry under pressure, then the price signal arrived with enough force to make the original entry optimal.
Whether this trade will follow the same path is not something we can know.
The market is at a crossroads: what comes next will leave no room for interpretation.
Leave a Reply