


Weekly monitoring of the Italian benchmark index.
Why do we do it?
Check our strategy page.
My proprietary DBBT indicator identifies misalignments between current price and expected technical level on the main indices.
Every week, the FTSE MIB is in our crosshairs.
The hunt is on.
After two consecutive weeks of indecision at the highs, the FTSE MIB regains momentum and prints both a new weekly high and the best close of the current move. The catalyst comes from the banking sector, which carries structural weight on the Italian index. On Sunday June 7th Intesa Sanpaolo, alongside BPER, launched a public exchange offer on MPS that effectively blocked the previous merger proposal Banco BPM had put forward on the Sienese institute. The deal envisages a break-up of MPS, with BPER absorbing the commercial network and Intesa retaining the stake in Mediobanca and the 13% holding in Generali. In the background remains UniCredit, still focused on the offer for Commerzbank which closes on June 16th. The combined effect kept the entire banking sector in motion for five consecutive sessions.
The opening of the week, however, was negative. On Monday the market opened with a gap down versus last week’s close of 49,896.82 and during the session it dropped to 49,342.44, setting the weekly low. From Tuesday the picture changed: an immediate rebound towards the 51,240 area, two sessions of consolidation above 50,000 and, on Friday, a second gap, this time on the upside, with a new weekly high at 51,645.87 and a close at 51,497.21.
The weekly candle therefore qualifies as an outside weekly to the upside, with a lower low than the previous week, a clearly higher high and a close at the highest levels of the entire move. The corrective scenario described last week did not materialise: the system took a stop loss on the short position. Let’s look at what the indicators are telling us.
Bulls vs Bears
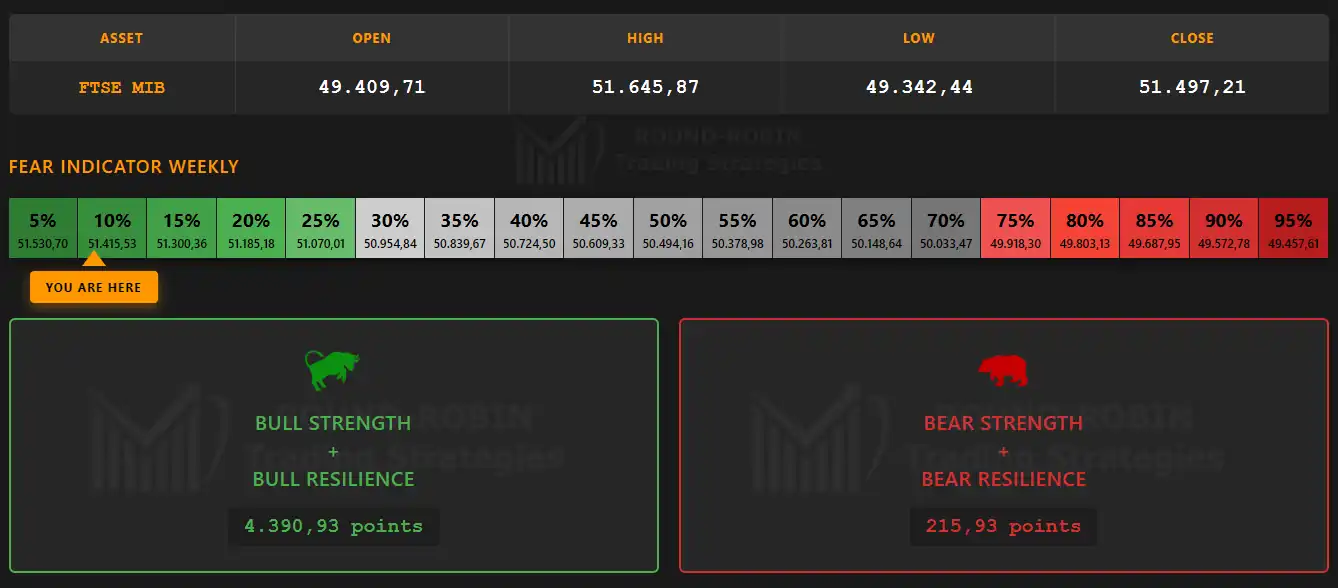
infographic: FTSE MIB weekly – Bulls vs Bears
The Fear Indicator sits in the deep green zone, at the level that the scale identifies as maximum bullish pressure on the risk perception side.
The ratio between aggregate bulls and bears strength is heavily skewed in favour of the bulls. Almost the entire technical weight of the week is concentrated on the long side, with bears reduced to a marginal presence relative to the force expressed by the bullish side.
The internal structure is consistent with the price action. New weekly highs, a close at the highest levels of the move and a sentiment indicator in the extreme green zone build a picture without divergences between price and participation indicators.
The Big Picture
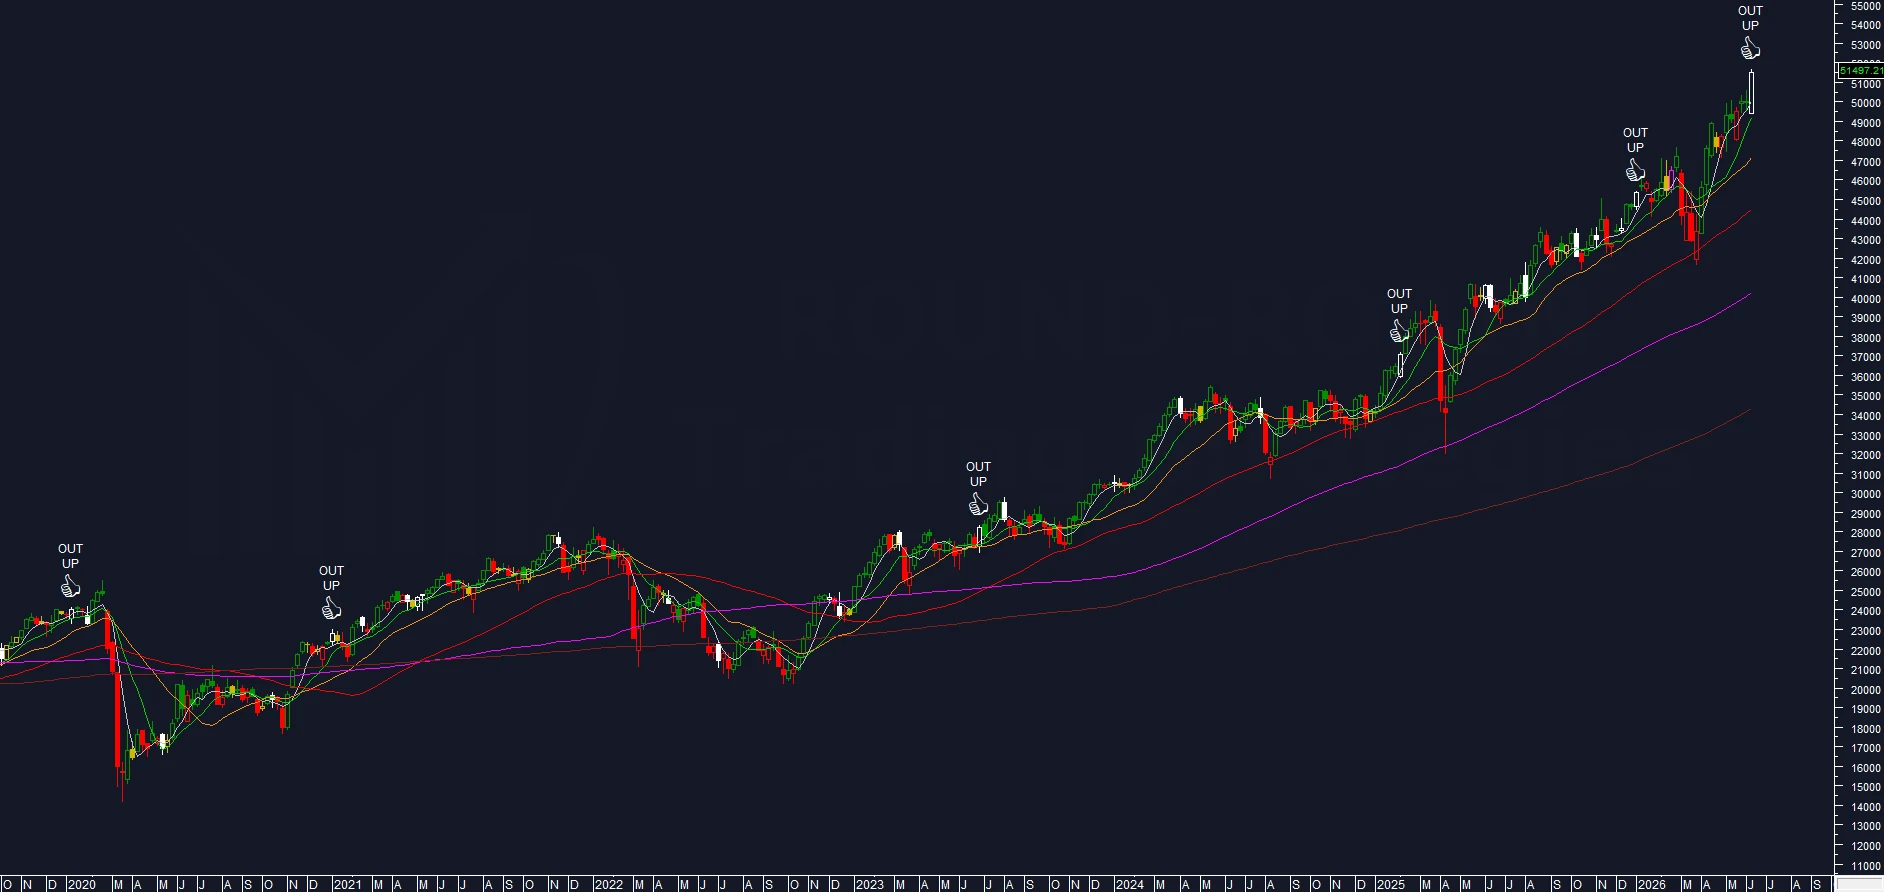
chart: FTSE MIB weekly
The week produced an outside weekly to the upside. On the price action side it is the most coherent structure with the continuation of the primary trend: a low that breaks below the previous one, a high that exceeds it and a close at the highest levels of the entire move. Monday’s session, with the gap down and the test of the weekly low at 49,342.44, marked the moment of maximum bearish pressure. From that level the market resumed without giving up ground again.
Price remains in overextension relative to the MA10W for the ninth consecutive week. It is a rare condition that historically identifies particularly solid trend phases.
The statistics on outside weeklies that appeared in analogous contexts from 2020 onwards confirm the picture. Every occurrence has been followed by higher highs in subsequent weeks, with one single exception: an inside week that then preceded a corrective phase. Extending the observation to the last twenty years the pattern keeps a favourable statistic, alternating full buy signals with phases of holding the previous highs before the start of a decline.
The moving averages remain aligned from the fastest to the slowest, all with a positive slope. The MA200W moves above 34,000 and now sits above the lowest close recorded during the April 2025 sell-off. The MA100W rises to 40,227 and keeps approaching progressively the 2026 yearly low set at 41,616.11.
The primary trend remains bullish.
On the operational side, the system took a stop loss on the short position and exits flat. At least one more week of readings will be needed before the technical picture can deliver new signals.
Volatility Indicator
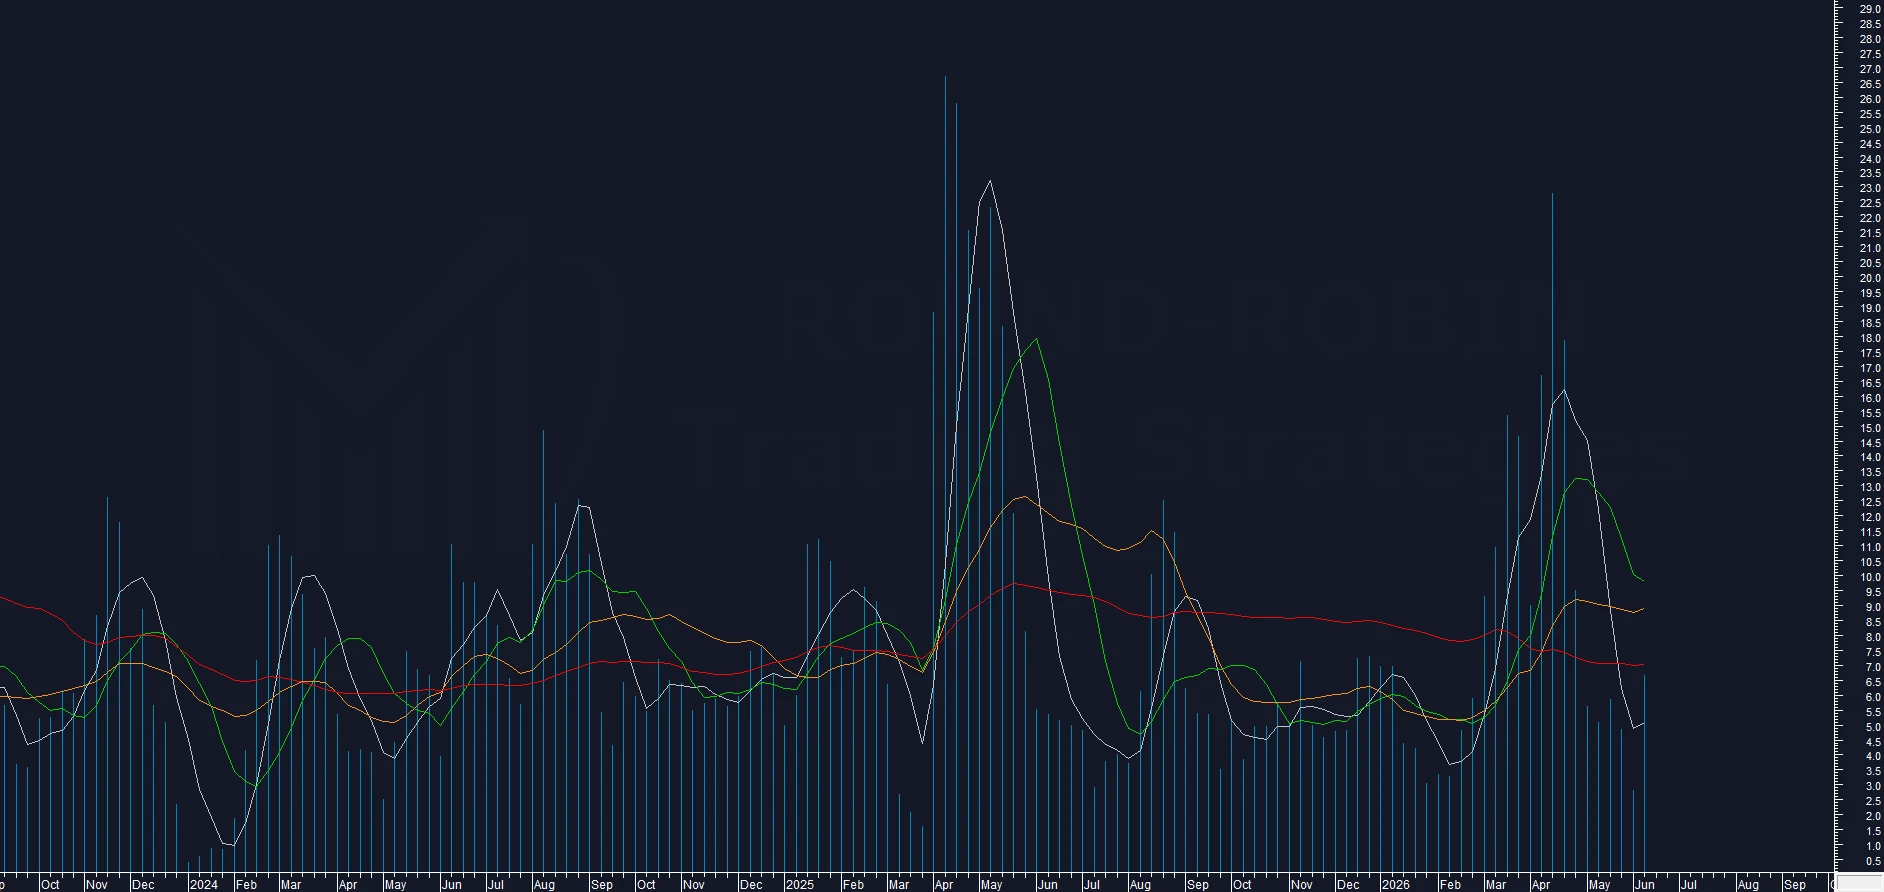
chart: FTSE MIB weekly – Proprietary Volatility Indicator
The volatility indicator climbs back to 6.70%. It moves above the MA5W but stays below all the other averages. A first hint, nothing particularly relevant.
Read together with the range expansion and the outside weekly, the move is consistent with the exit from the contraction phase of the previous month.
Range Weekly %
The weekly range rises to 4.66% and moves above all the moving averages of the indicator, from the MA5W to the MA50W.
It is the first week of clean expansion after a series of contracting readings. The simultaneous break of all the averages of the indicator confirms the change of phase on the directional activity side.
Read together with the outside weekly and the recovery of the Volatility Indicator, the message is consistent: price, volatility and range tell the same story.
BCP3
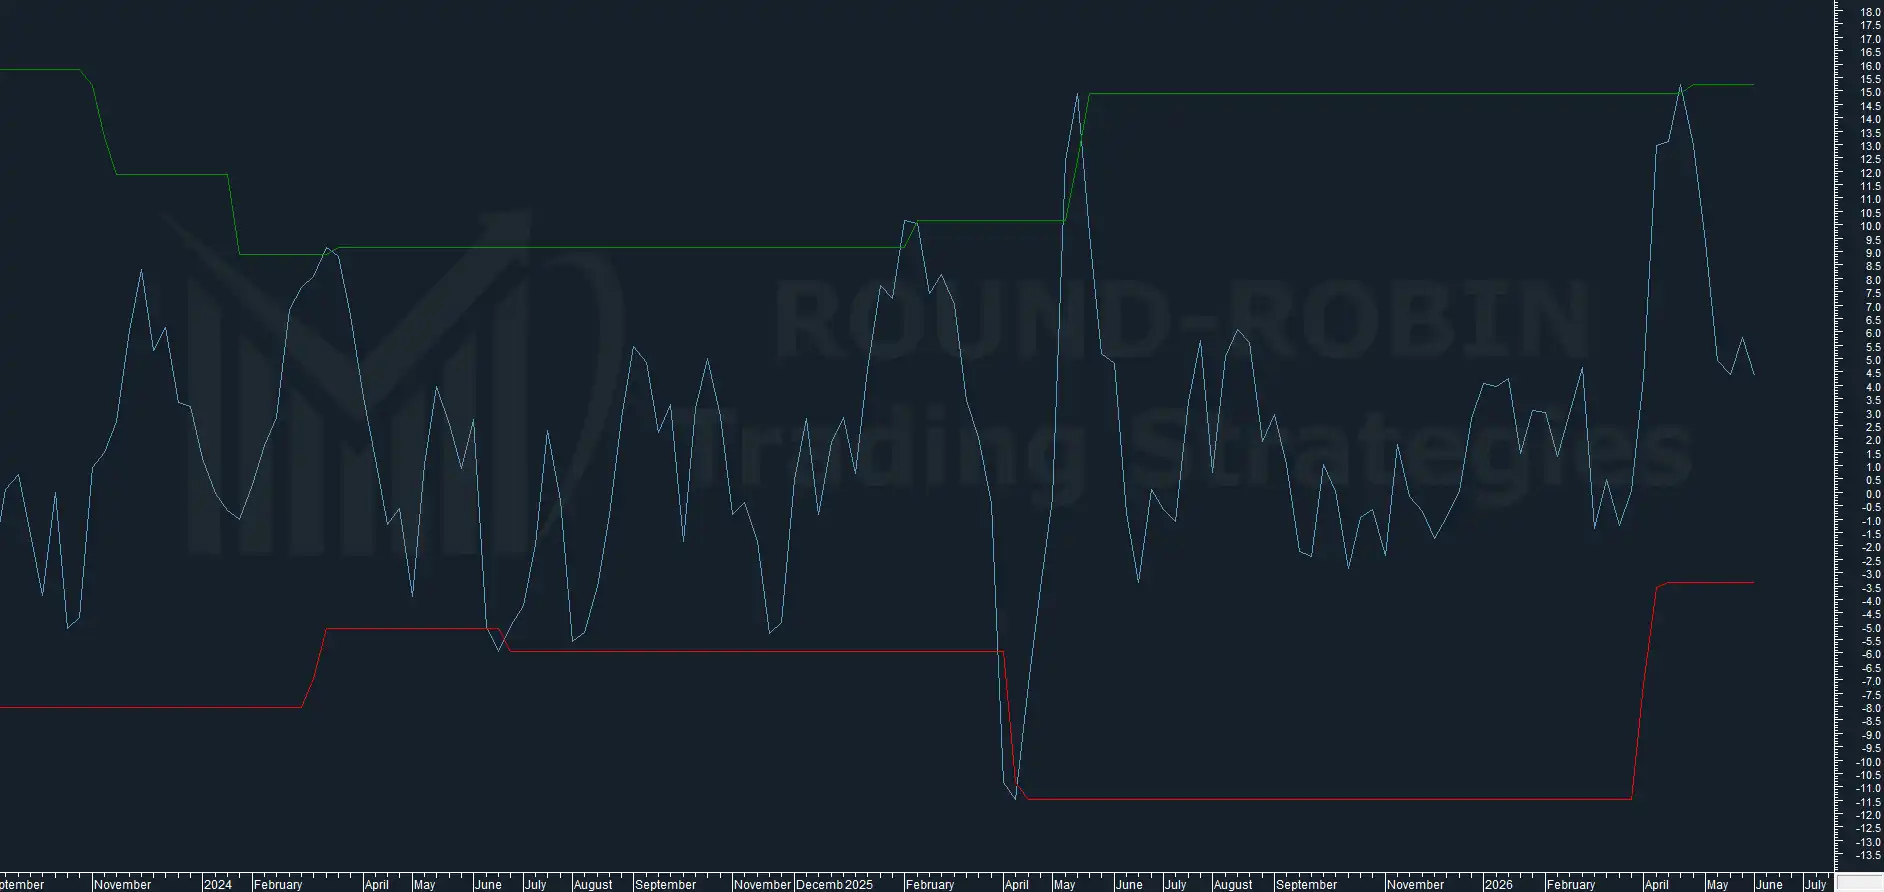
chart: FTSE MIB – BCP3 weekly
The BCP3 hooks back up, forming a new bullish hook after the one already cancelled last week.
The observation of the previous weeks still holds: historically the birth of a new mature bullish swing requires a full descent of the indicator below zero. Without that intermediate step a hook hardly translates into an operational buy signal.
The BCP3 therefore remains the only element not aligned with the continuation picture drawn by price, range and volatility.
Conclusion
The BCP3 was not enough to keep the system on the short side. The week produced only a stop loss, not an operational reversal to long. At least one more reading will be needed before the technical picture can deliver new signals.
From a quantitative standpoint the picture has changed significantly. The outside weekly at the highs, the MA10W holding with price in overextension for nine weeks, the range expansion above all the averages of the indicator and the recovery in volatility build a combination that has historically been consistent with further highs in the following weeks.
The only relevant divergence remains the BCP3, which keeps failing to confirm the move. For now it is the only element of caution within a context that, for the rest, has gone back to showing continuation characteristics on the upside.
On the flows side, the banking sector keeps being the main engine of the index. The calendar of the coming sessions is full: Tuesday June 16th the Banco BPM board meeting, the official closing of the UniCredit offer on Commerzbank and the first formal steps on the Intesa-BPER tender offer on MPS. These are events capable of moving price independently of the technical picture.
An indirect confirmation comes from the comparison with the DAX, which over the same week recovered from the lows but closed negative, with lower highs and lower lows. While the FTSE MIB was printing new period highs, the German index could not hold the previous close. The difference in behaviour measures the specific weight that the banking theme had on Italy over these five days.
Leave a Reply