


After nine consecutive weeks of advancing closes and weekly range compressed to the year’s lows, this week the picture changes sharply.
The week reaches a new all-time intraweek high at 7,620.90. The rejection is immediate and decisive: the close at 7,383.74 falls below the open and below the previous week’s close, ending the streak of 9 consecutive weeks with a positive body. Bears step in with force.
Let’s dig into the details.
Bulls vs Bears
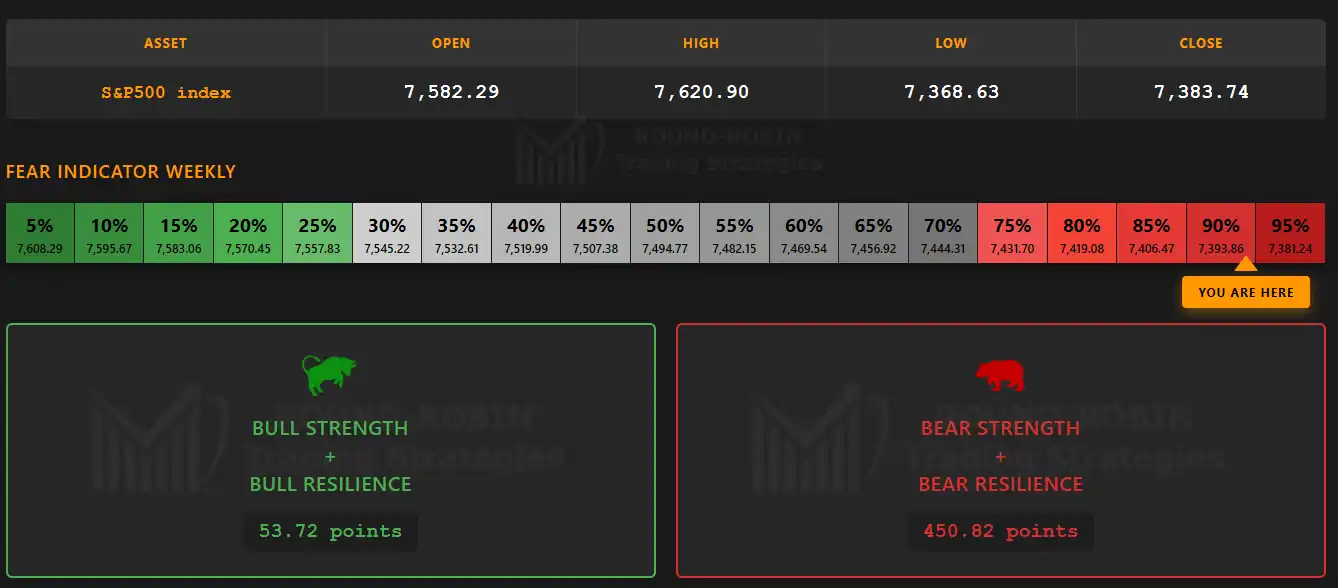
infographic: S&P 500 weekly – Bulls vs Bears
Bears dominate the week with a ratio above 8 to 1, reversing the picture from last week when bulls were in control with a similar but opposite ratio.
The Fear Indicator shifts into extreme panic territory. Selling pressure concentrated in Friday’s session, when the market accelerated lower without finding support.
The Big Picture
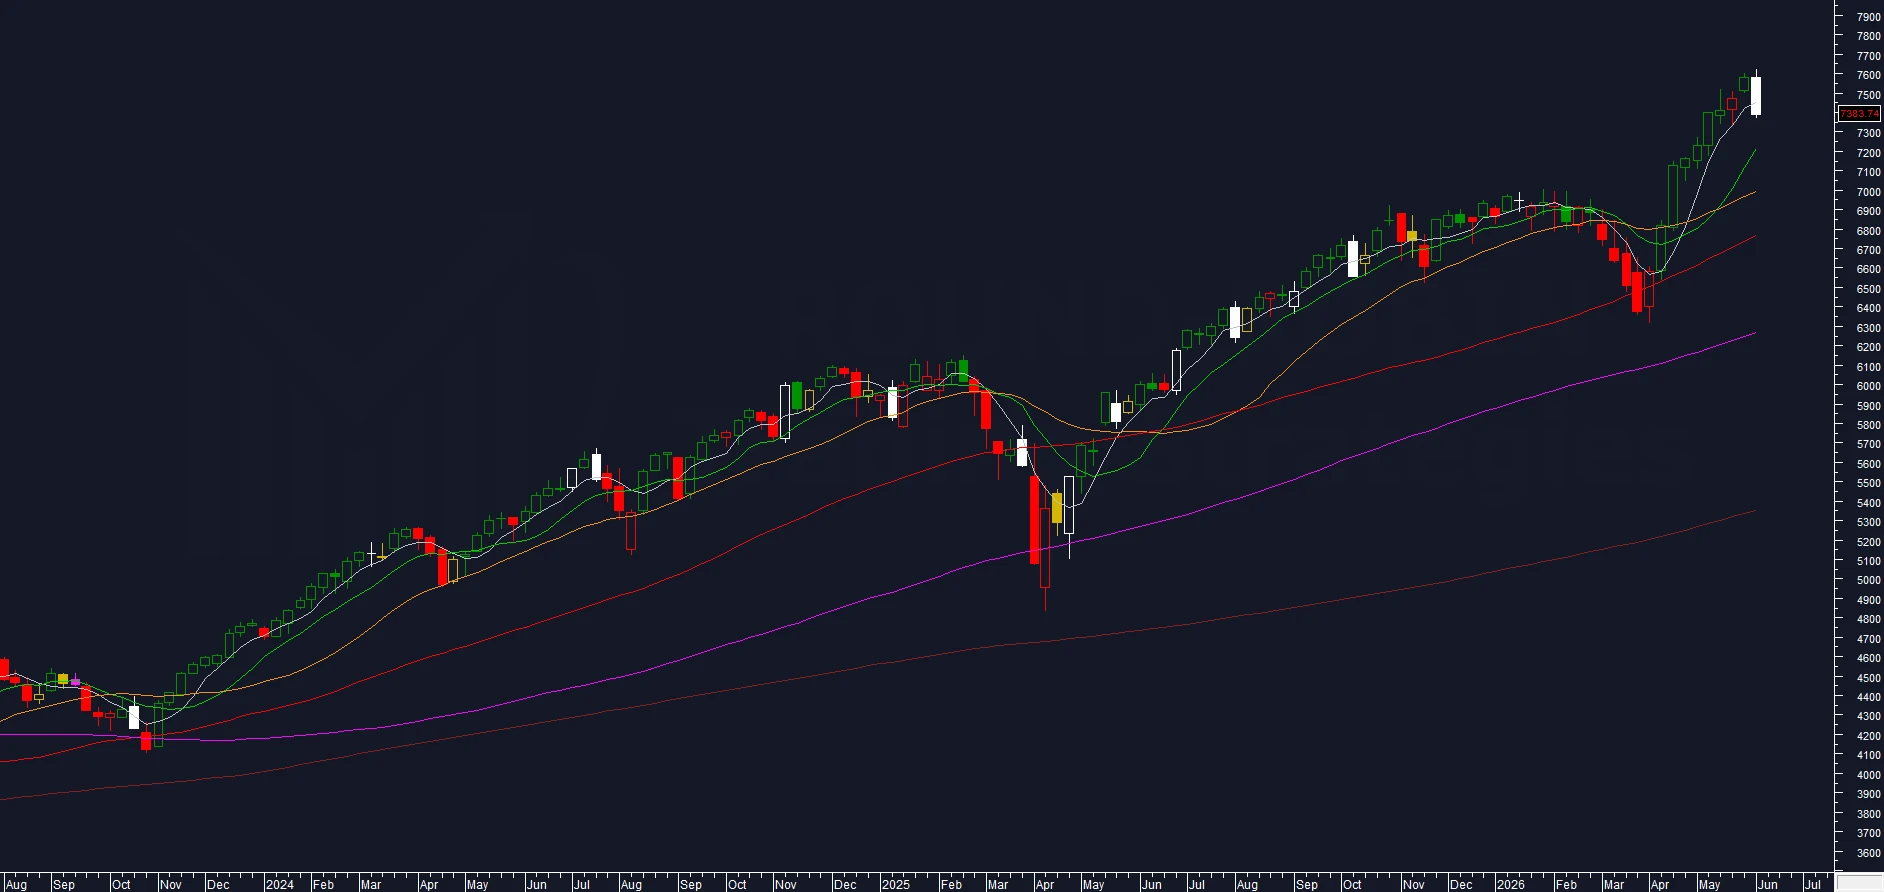
chart: S&P 500 weekly
The weekly candle is a bearish engulfing outside: the new all-time intraweek high at 7,620.90, rejected immediately, and a close at 7,383.74 below the previous week in both body and range. The MA5W is broken for the first time after 9 consecutive weeks above. This candle also ends the streak of 9 consecutive weeks with a positive body, which had matched one of the records of the last 25 years. The low at 7,368.63 holds the structure above the lows of two weeks ago: the move is relevant, but the sequence of higher lows is not yet broken.
On the statistical side: over the last three seasons, an equivalent pattern in a top area occurred 3 times. In two cases it resolved as bullish continuation; in July 2023, it instead marked the cycle high. The sample is limited and does not offer a clear directional reading.
The system had described this scenario as anticipated. The decline occurred and is visible. This is a first signal: confirmation requires additional material in the coming weeks.
Volatility Indicator
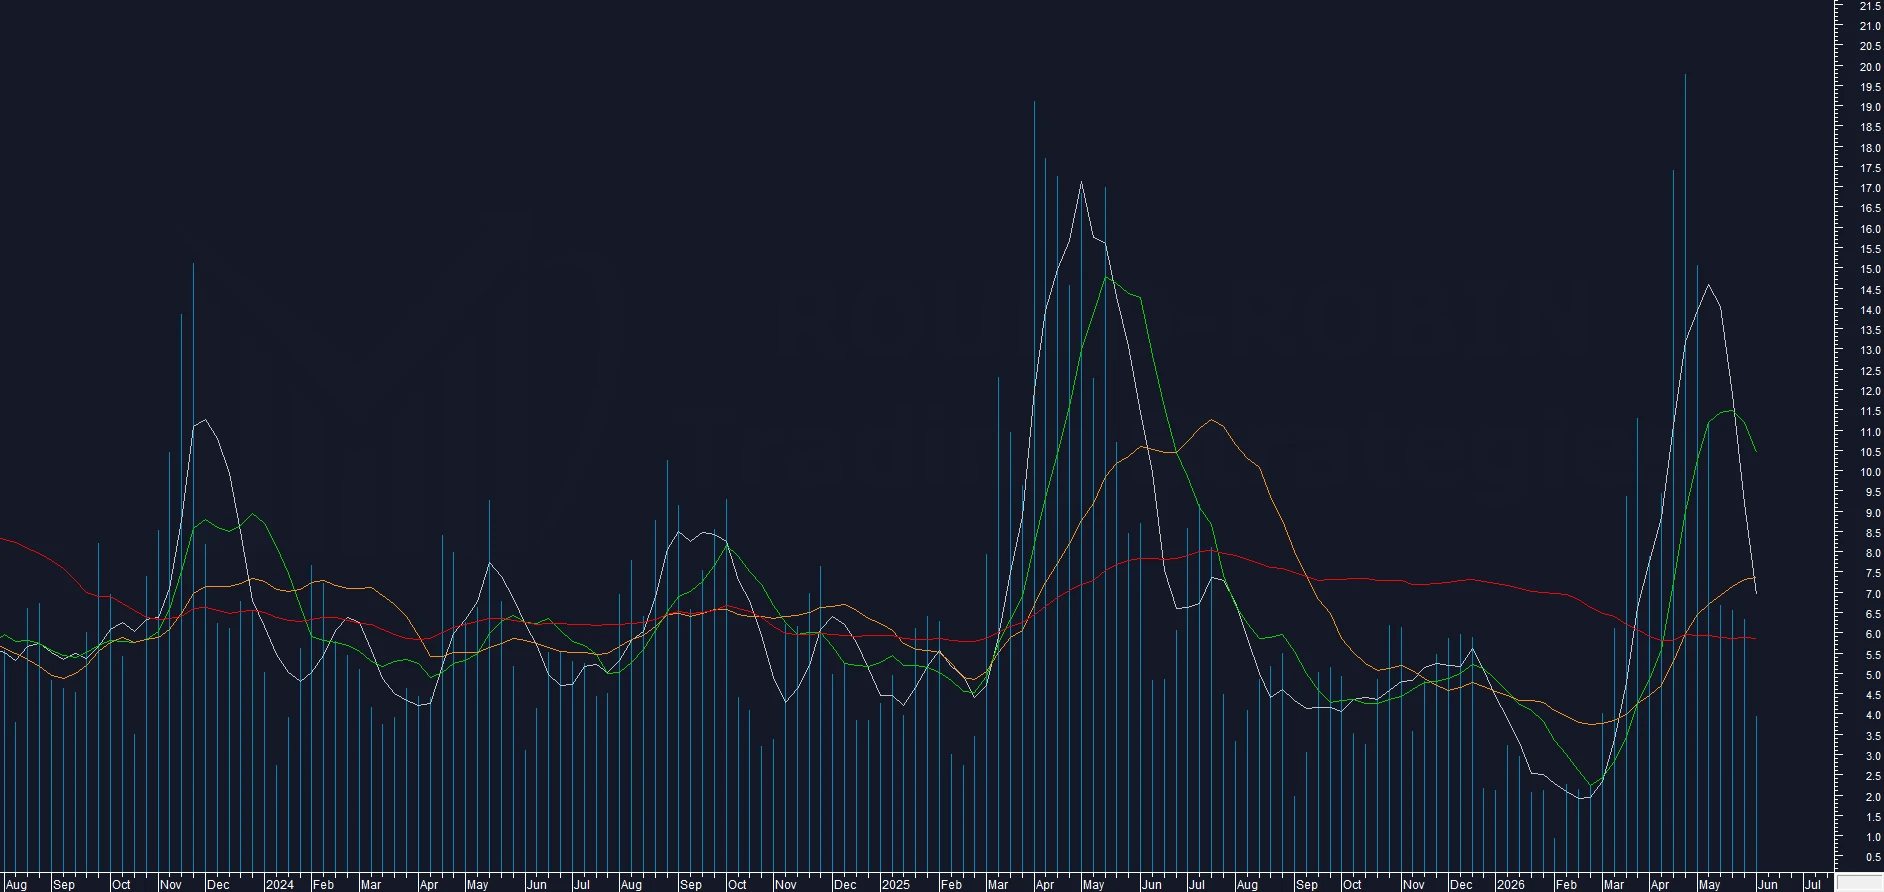
chart: S&P 500 weekly – Proprietary Volatility Indicator
The Volatility Indicator closes at 3.94%, still declining. The value has not yet reached the 2026 lows, but the drop accumulated over recent weeks has been consistent. The expansion of the weekly range has not yet transferred to the indicator.
Range Weekly%
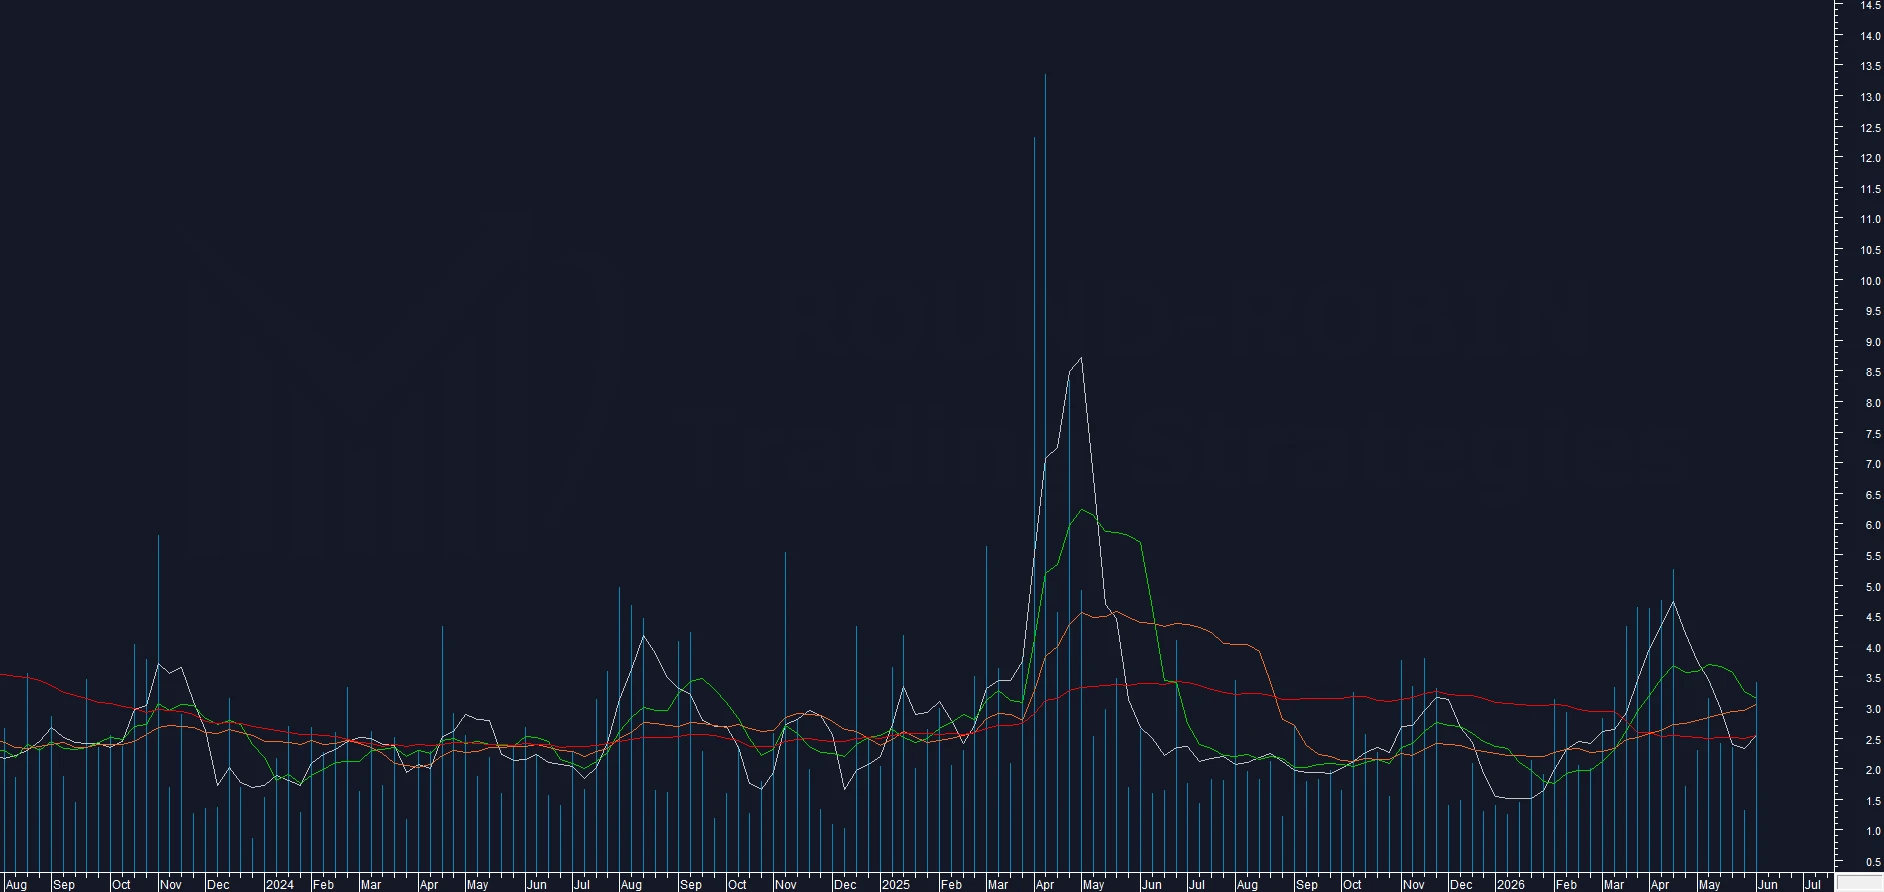
chart: S&P 500 weekly – Range %
The Range Weekly% rises to 3.42%, the highest reading in the last seven weeks. The MA5W on the indicator turns upward, but remains within the compression zone that characterized the preceding weeks.
The value stays below the March and April peaks. The recovery in weekly activity is underway, but the indicator’s rebound is in its early stages.
BCP3
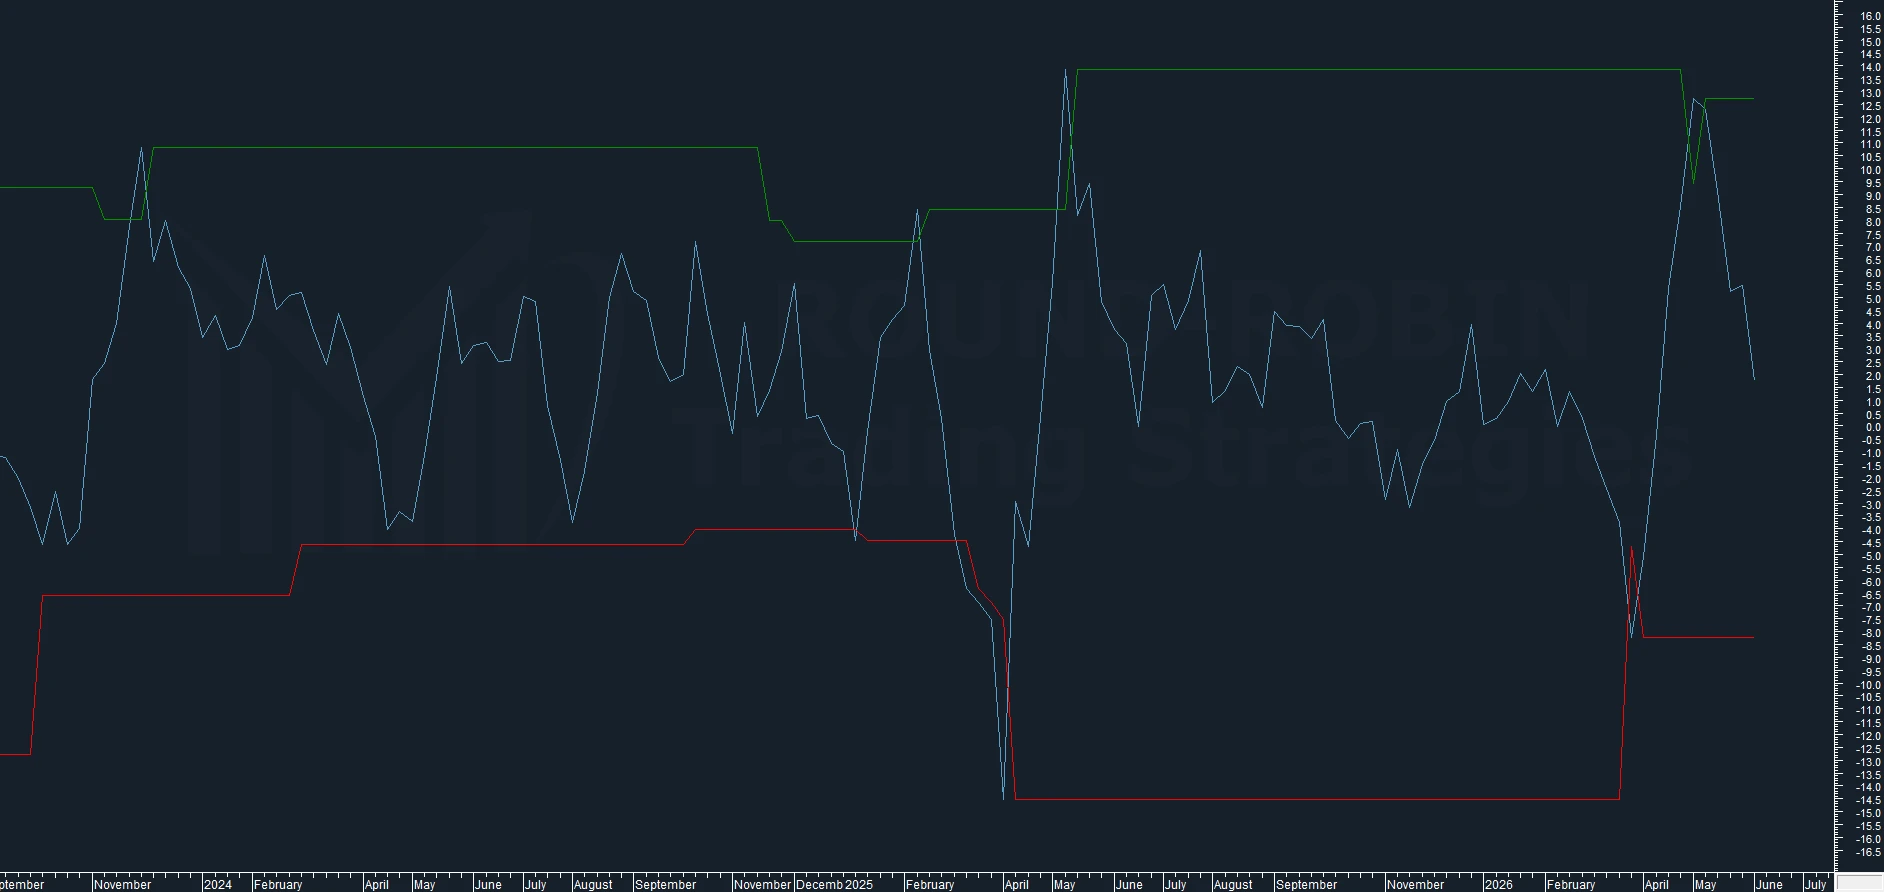
chart: S&P 500 weekly – BCP3
Last week’s reversal attempt is cancelled out. The bearish swing extended significantly, but the indicator closes still in positive territory, above zero. The remaining space before the swing completes with a move into negative territory remains wide.
Overextension MA200W
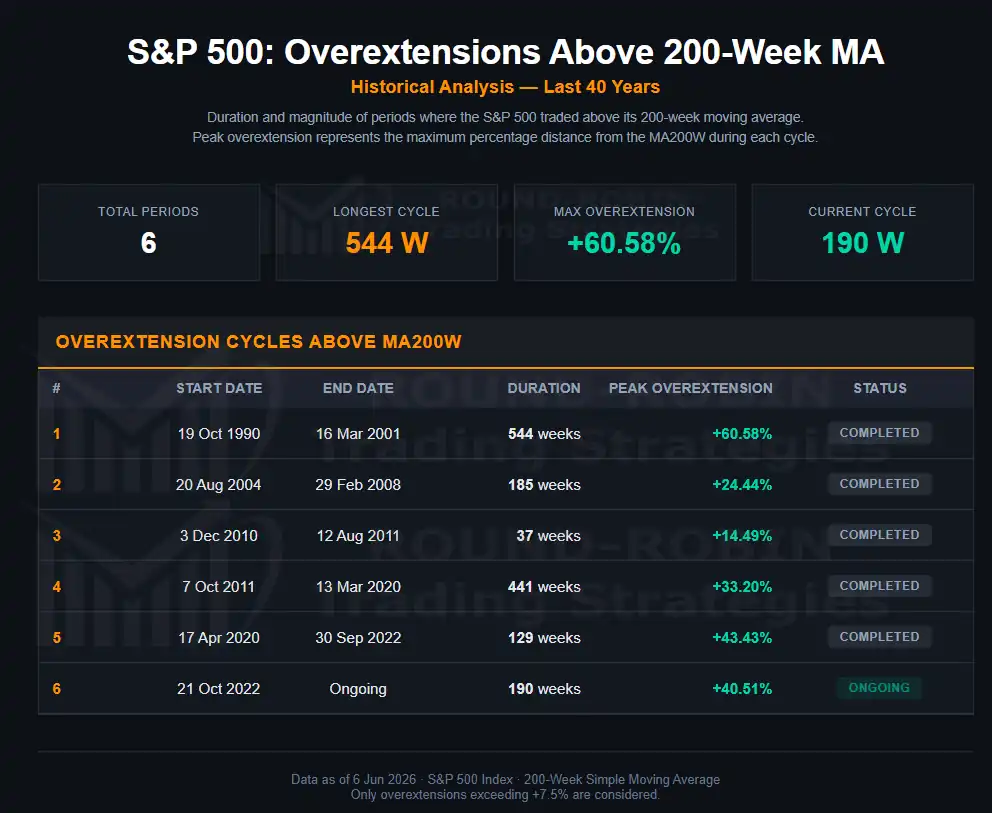
Table: S&P 500 Overextension Cycles Above MA200W (1990-2026)
The overextension above the MA200W retraces to 37.64%. The 40.51% printed last week could shape up as a significant local peak for the current cycle, but it is premature to draw conclusions from a single retracement reading.
Conclusion
The indicators have described a market in excess conditions for weeks. This week the price provided the first realignment signal: the bearish engulfing outside candle, the retracement in overextension, the extension of the BCP3 swing, and the pickup in Range Weekly% are all consistent with the reading the system has maintained for some time.
The distance from structural confirmation remains. The week’s low did not break the lows of two weeks ago, the BCP3 is still in positive territory, and the candle pattern has precedents that resolved as continuation. The Short position recovers ground for the first time after weeks of deterioration, but no exit trigger has been activated.
The coming weeks will show whether this week’s candle is the beginning of a broader pullback or whether the market absorbs the move and returns to test the highs.
Next week will offer a first discriminant. An inside week, which in the historical cases analyzed preceded bullish continuation, would significantly raise the probability of the move being absorbed. Lower highs and lower lows with a bearish close, on the other hand, would provide the first confirmation that the correction has begun.
Leave a Reply