


Quick observations on the charts that caught our eye this week.
This week’s flash covers Brent, EUROSTOXX50, DAX, Nikkei 225 and Bitcoin.
Brent collapsed on the back of the narrative of a possible USA-Iran deal and returned close to the April lows. EUROSTOXX50 printed a new weekly high and moved within striking distance of the yearly record. DAX gave up further ground and remained the laggard among European indices. Nikkei 225 tried to break down mid-week but rebounded with strength, closing near the historical highs. Bitcoin took a breath after last week’s dump with an inside week on the MA200W.
Let’s dig a little deeper to try to understand what next week has in store.
⚡ BRENT
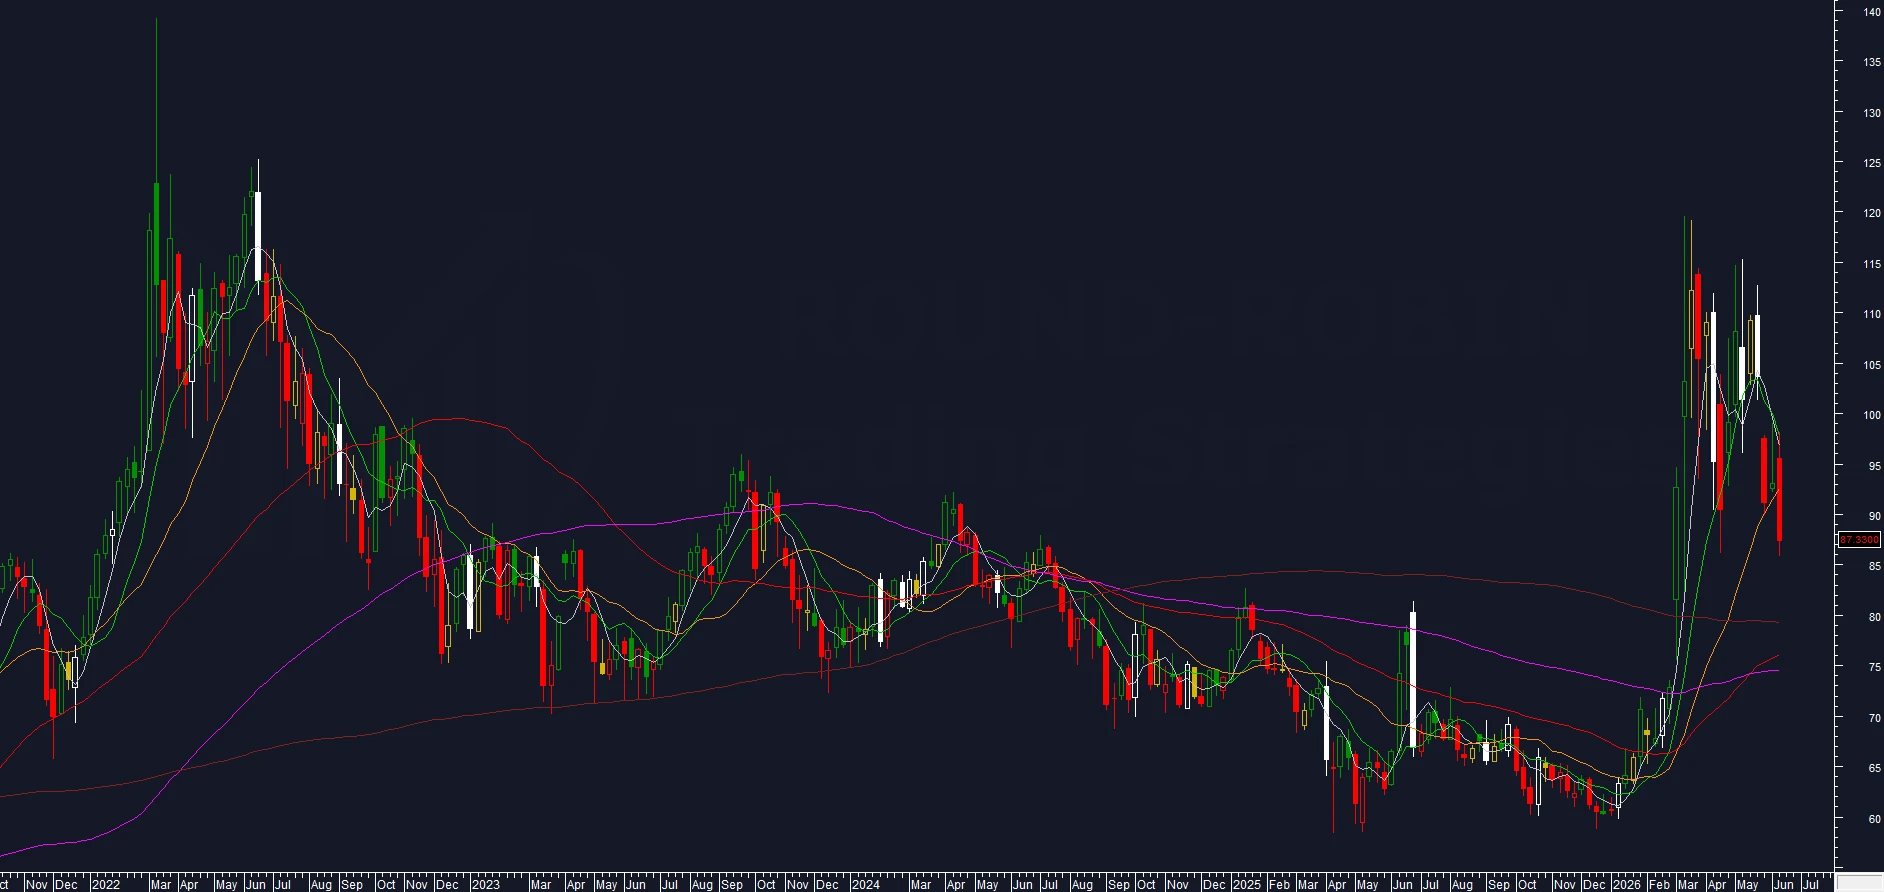
chart: BRENT OIL weekly
In last week’s Charts Flash the break of the MA20W was indicated as the first scenario in case of failure: path open towards the MA50W in the 75/80 area. The break has arrived.
The candle is unequivocal: open at 95.50, high at 98.08 touched on the open and never seen again, low at 85.80, weekly close at 87.33 just above the low of the April correction at 86.09. Deep negative body, close on the lows. The catalyst came from the narrative on the USA-Iran deal, which the market seemed to start pricing in more convincingly after weeks of waiting.
The Volatility Indicator exploded to 41.26%, exceeding the April and May peaks. The weekly range moved to 14.31%, a second directional confirmation of the move in progress.
The structure is consistent with the continuation to the downside. The definitive confirmation would come with a weekly close below the April low at 86.09: that break is needed to validate the breakdown on the long-term horizon.
The system entered Short.
⚡ EUROSTOXX50
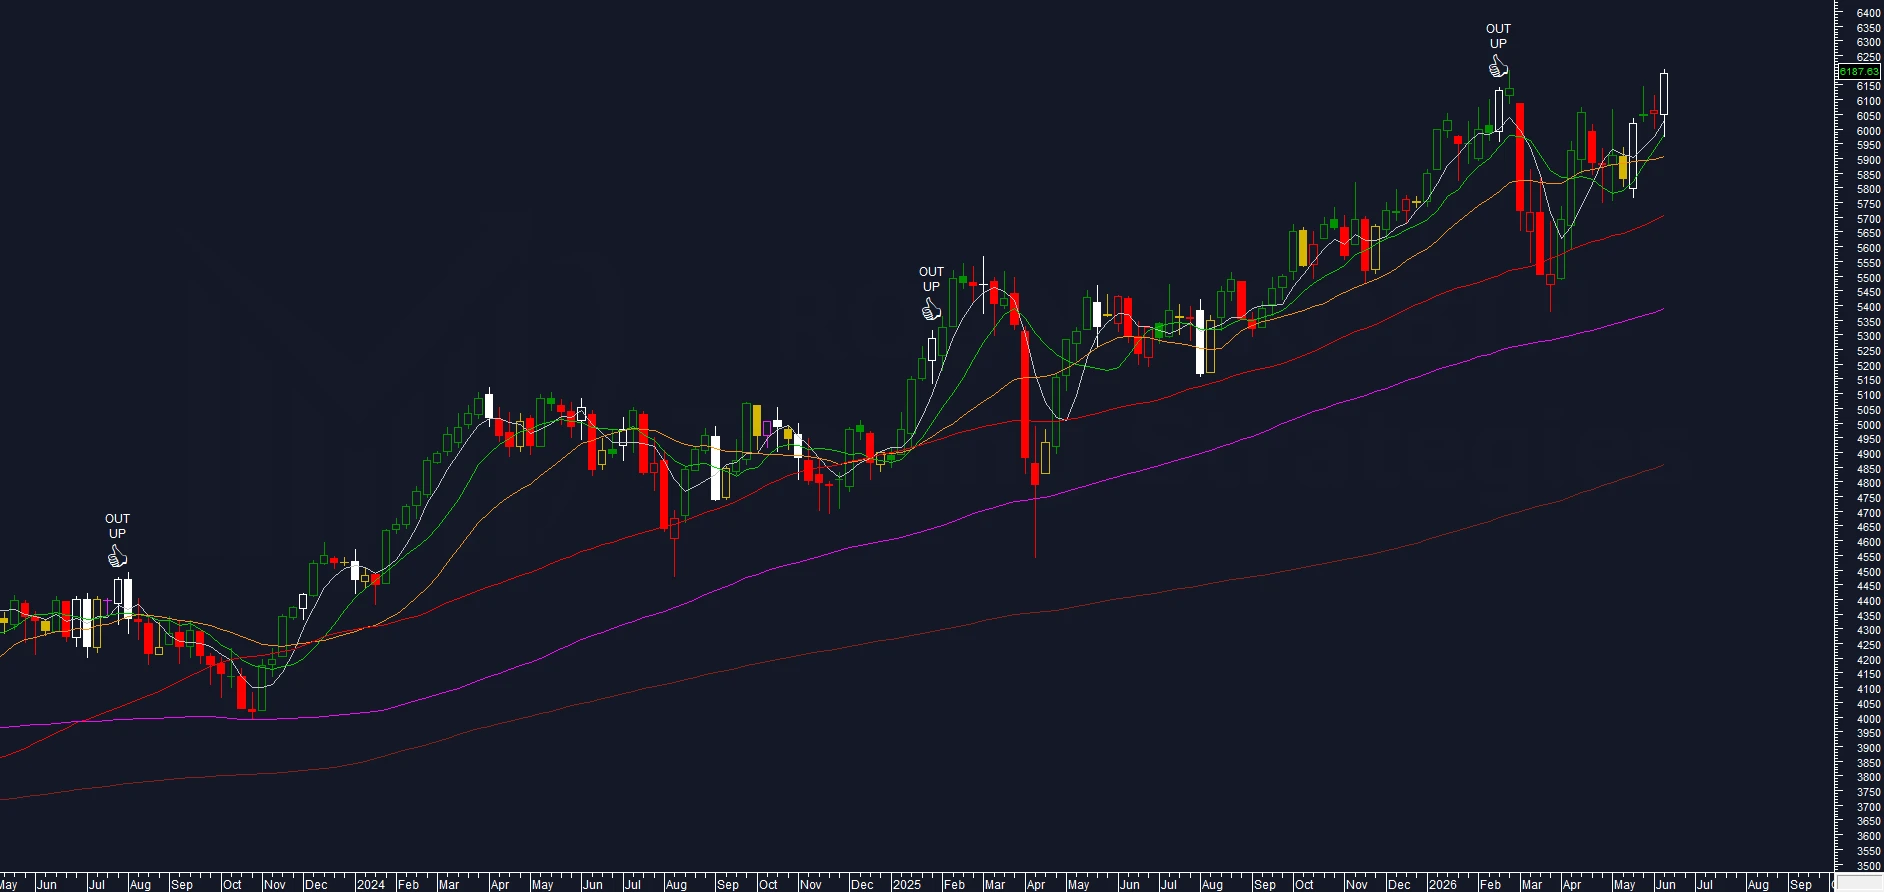
chart: EUROSTOXX 50 weekly
In last week’s Charts Flash the parallel with the February top was flagged as a possible setup, with lower highs and lower lows plus a negative body as the most likely scenario. The lower low has materialised, but inside a completely different structure.
Outside weekly to the upside. Open 6,049.79, high 6,202.40, low 5,972.12, weekly close at 6,187.63. The weekly high exceeded last week’s, the low broke below it, the close moved within a few points of the yearly high at 6,199.78. It is the first new weekly high after the March drop.
Volatility Indicator and range expanded in parallel. The combination of outside weekly, close at the highest levels of the entire move and indicators in expansion frames the picture as a possible prelude to the decisive bull break. Only the price signal is missing: a weekly close above 6,199.78 would give the operational confirmation to the setup.
The system stays Short but a few points away from the stop loss trigger. The outcome will depend on next week’s configuration.
⚡ DAX
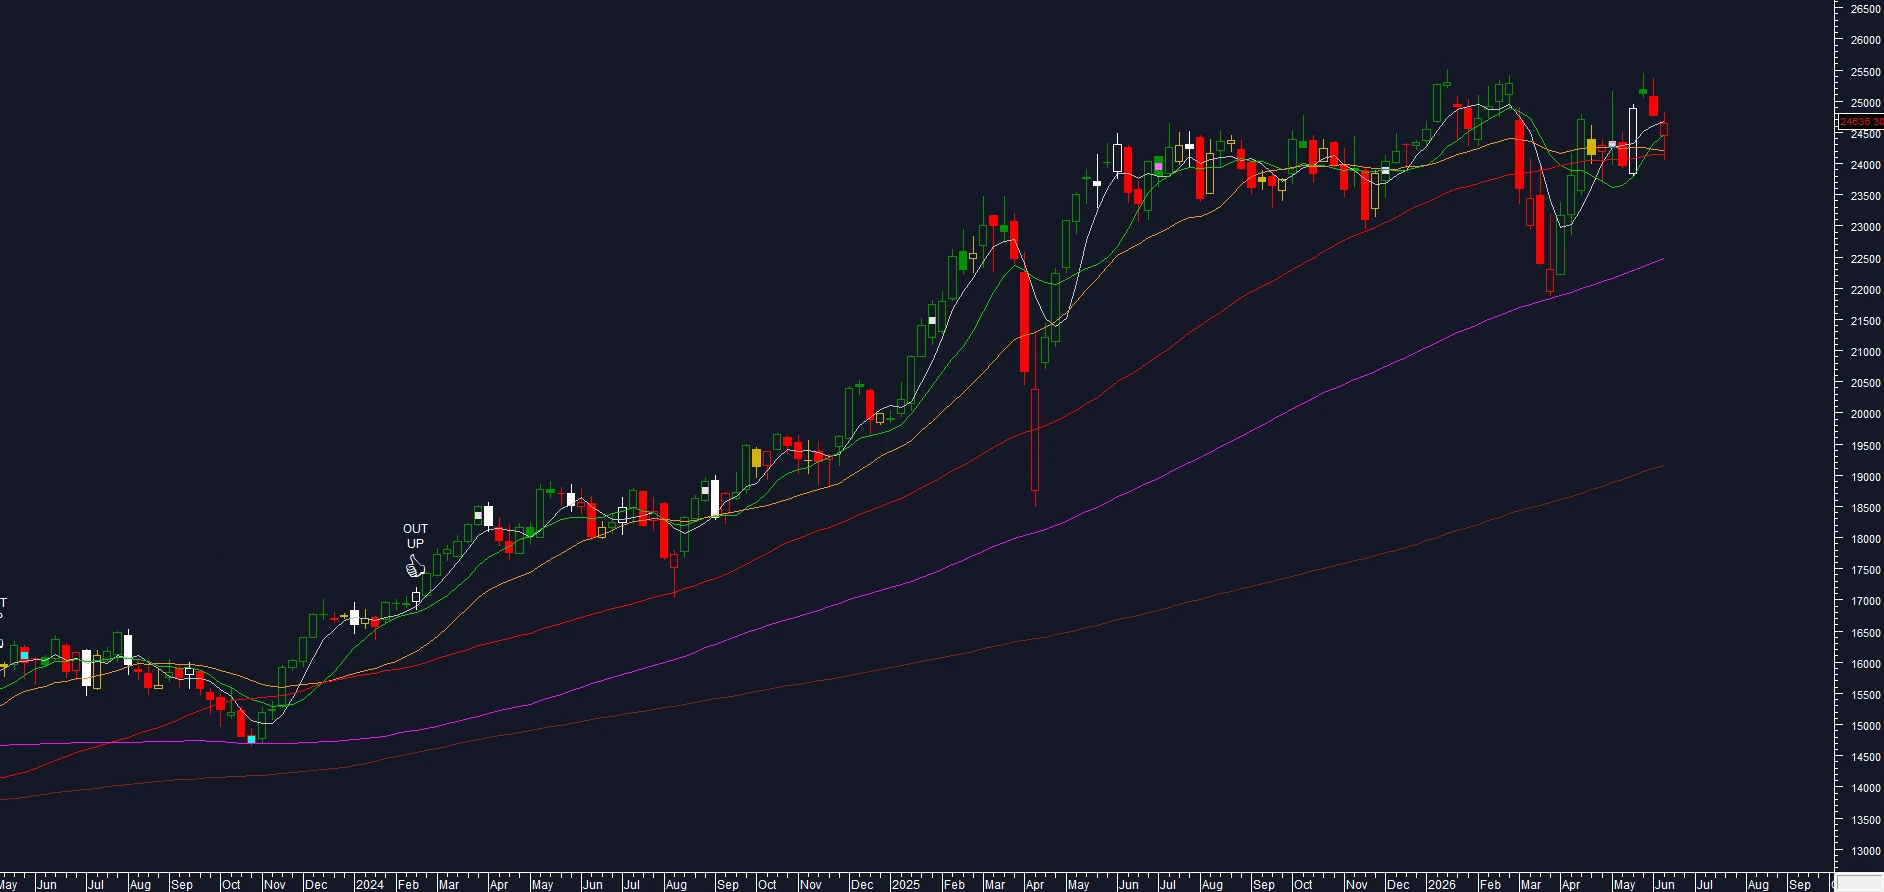
chart: DAX 30 weekly
In last week’s Charts Flash the DAX was closing at 24,759.05 with lower highs and lower lows, a 324-point negative body and weaker relative strength versus the other European indices. The system was keeping Short.
This week the move stopped on the MA50W. Open 24,447.32, low 24,043.52 touched mid-week, clean rebound off the MA50W, weekly close at 24,635.30. The candle is positive on the weekly open but negative versus last week’s close: the rebound was not enough to recover the lost ground.
The MA20W sits just above the MA50W and is approaching the bearish cross. The close landed below the MA5W, a technical weakness signal that leaves no room for bullish reads even in the presence of the rebound.
Volatility Indicator down and range up together told of a market unable to find direction: directional activity rose without the volatility structure following the move.
Relative strength stayed clearly weaker than EUROSTOXX50 and FTSE MIB. Both updated weekly highs and moved close to record territory, while the DAX stopped at a rebound off the first key average without any sign of a fresh start.
The system stays Short.
⚡ NIKKEI 225
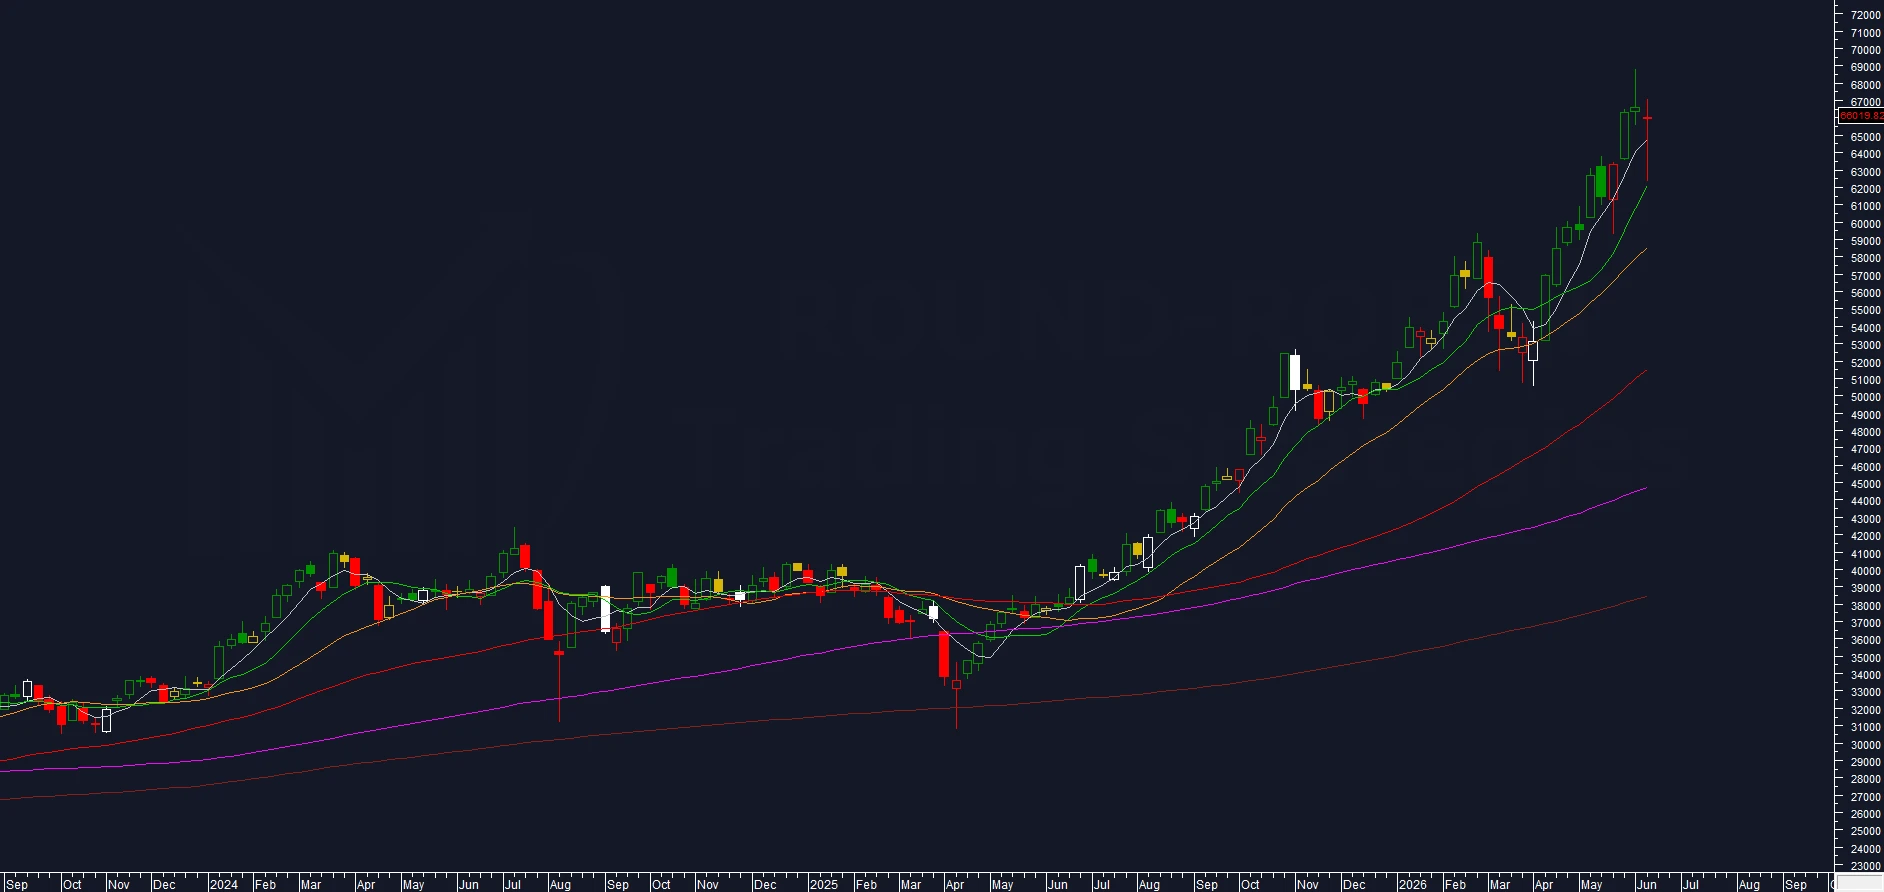
chart: NIKKEI225 weekly
In last week’s Charts Flash the Nikkei 225 was closing at all-time highs at 66,587.90 with a record upper shadow on the entire bullish leg and overextension above the MA200W at 71.25%. The system was re-entering Short with theoretical probabilities above 80%.
This week the start was negative. Open 65,947.56, price slid progressively to the weekly low at 62,335.75 touched on Thursday, moving below the MA5W. From there the market found a violent rebound off the MA10W, with a reaction structurally very similar to the one seen three weeks ago, which back then led to the explosion towards the new highs. The rebound brought price to 67,065.94 on the Friday weekly high, with a close at 66,019.82.
The candle is marginally positive on the weekly open, but stayed below last week’s close. The weekly close held above last week’s low: the bullish structure is not invalidated.
Volatility stayed at elevated levels. The weekly range produced a new spike, among the most relevant of the year, exceeding the one already seen three weeks ago. The intraweek decline had the sole effect of bringing the overextension above the MA200W down from last week’s record to 62%: still an extremely high reading.
The most likely scenario is an attack on the highs in the coming sessions. Next week’s configuration will tell whether and how the level will be tested or broken.
The system took a stop loss on the short position and exited flat.
⚡ BITCOIN
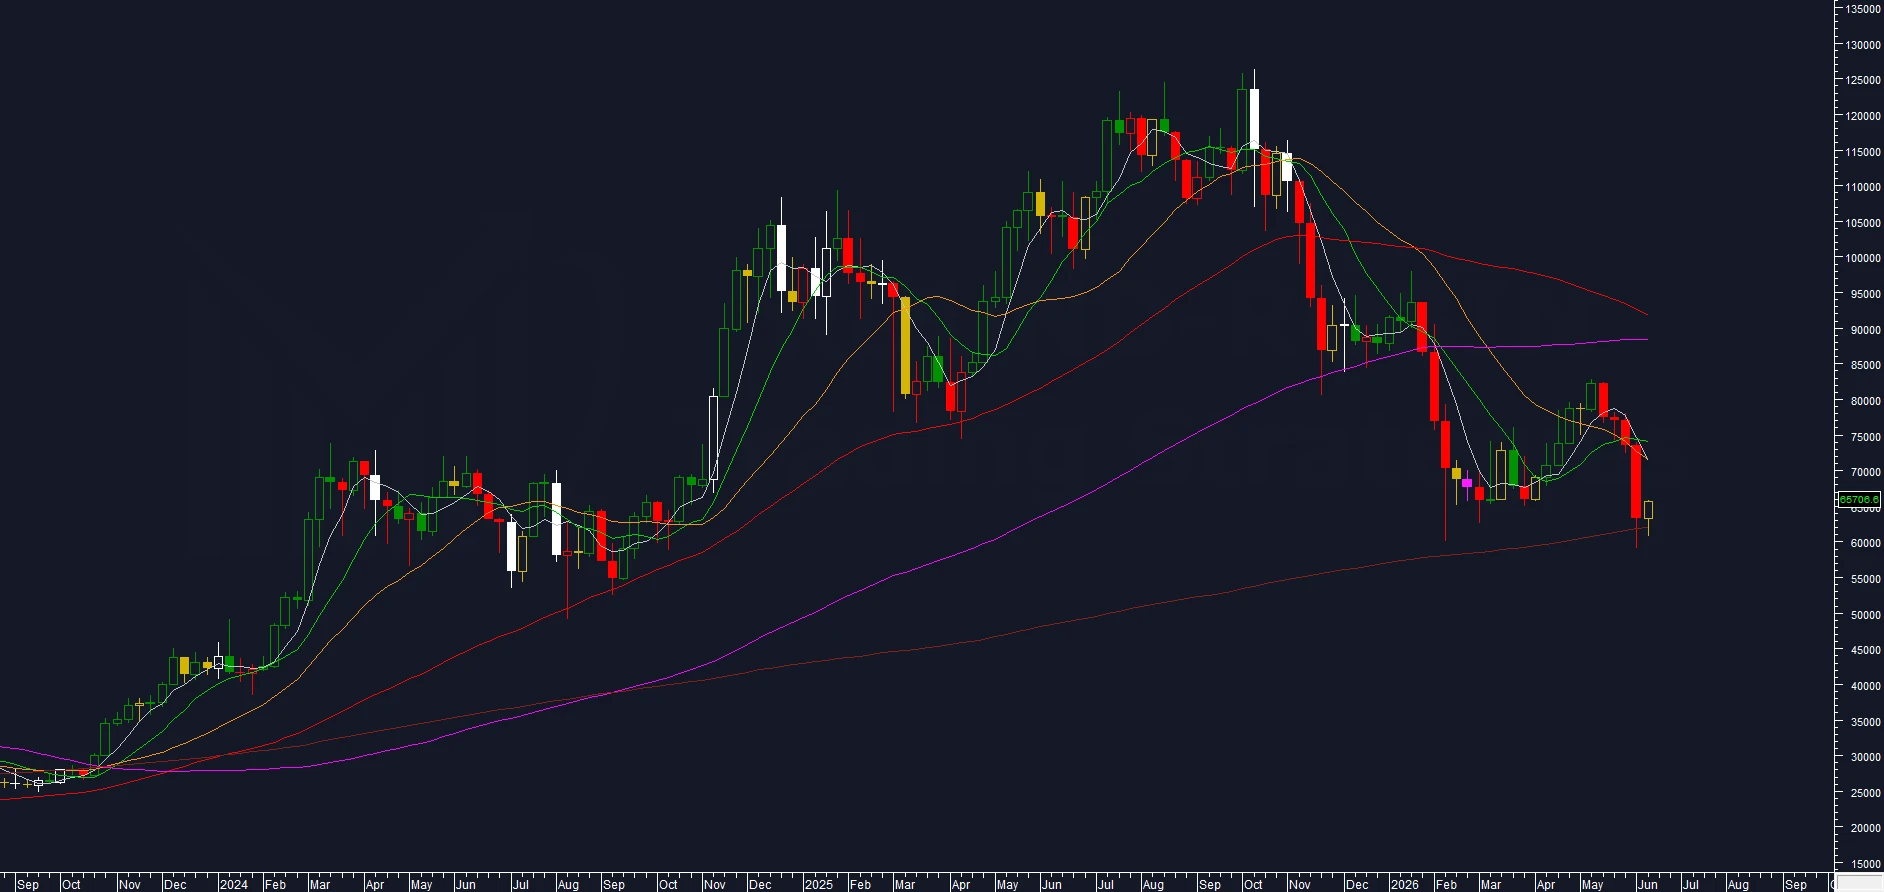
chart: Bitcoin weekly
In last week’s Charts Flash Bitcoin was returning to the radar with a 25% range, a negative candle that pierced the January low at 60,001 intraweek before recovering in the 61,800 area. The system was staying flat with high probabilities of entering Short.
This week was an inside week, built right against the MA200W. Open 63,302.03, high 65,764.16, low 60,708.92, weekly close at 65,706.62. Weekly high lower than last week’s, weekly low higher: the candle compressed within last week’s range without putting either extreme really under pressure.
The Volatility Indicator stayed at elevated levels at 38.89%, just below last week’s reading. The range collapsed to 8.32% and moved back below all the moving averages of the indicator.
Next week can be decisive for the bearish momentum. An inside week right after a dump often opens on Bitcoin a recovery scenario towards the fast averages, and the configuration of the coming sessions will tell whether this is the route price intends to take or whether the pause only precedes the restart of the move to the downside.
A break of the MA200W with a close below last week’s low at 59,073.01 would confirm the start of a new wave of the long-term bear market.
The system stays neutral.
Leave a Reply