


Quick observations on the charts that caught our attention this week.
This week’s flash covers Brent, EUROSTOXX50, DAX, Nikkei 225 and Bitcoin.
Brent (+2.16%) recovers from MA20W but is rejected by MA5W and MA10W: dominant upper shadow, system flat. EUROSTOXX50 (+0.19%) and DAX (-1.38%) close with lower highs and lower lows: the DAX closes at weekly lows with lower relative strength, both systems maintain Short. Nikkei 225 (+0.39%) sets new all-time records on both high and close with MA200W overextension at a record 71.25%: system re-enters Short. Bitcoin returns to the radar with a 25% weekly range and volatility at 44.72%: January low breached intraweek and recovered, system flat.
Let’s take a closer look to try to understand what lies ahead for the coming week.
⚡ BRENT
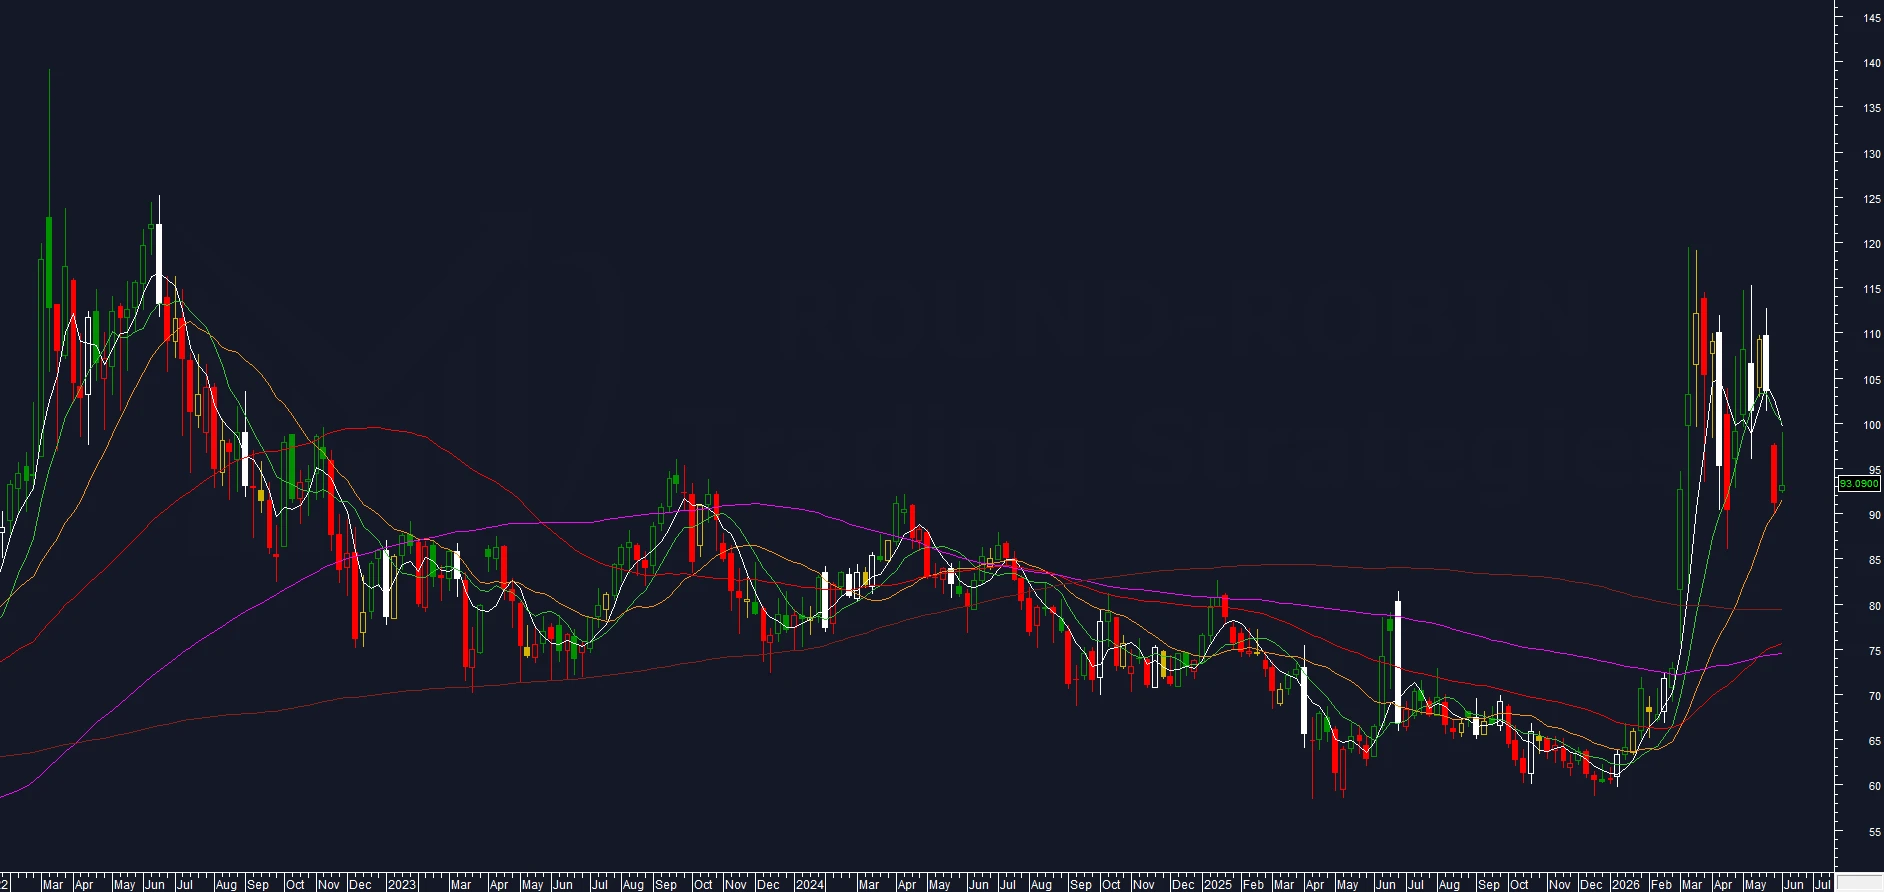
chart: BRENT CRUDE OIL weekly
In last week’s Charts Flash, the holding of MA20W and the 90 level as a weekly close was indicated as the reference for a recovery.
MA20W held. The recovery came, but the candle structure limits its scope: higher highs and higher lows, close at 93.09 just above the open at 92.58, upper shadow of 5.90 points against a body of 0.51. Bulls pushed up to 98.99 intraweek but were rejected by MA5W and MA10W, which are defending the gap at 101.34.
The weekly range falls further from last week’s 8.76%. The Volatility Indicator climbs back above 30%.
MA20W holds. Prices are now slightly overextended above the moving average after last week’s test.
Two scenarios: a break of MA20W reopens the path toward MA50W in the 75/80 area; a hold keeps open the bullish attempt to fill the gap at 101.34.
The system remains flat: no relevant price break and no signal from the volatility indicators.
⚡ EUROSTOXX50
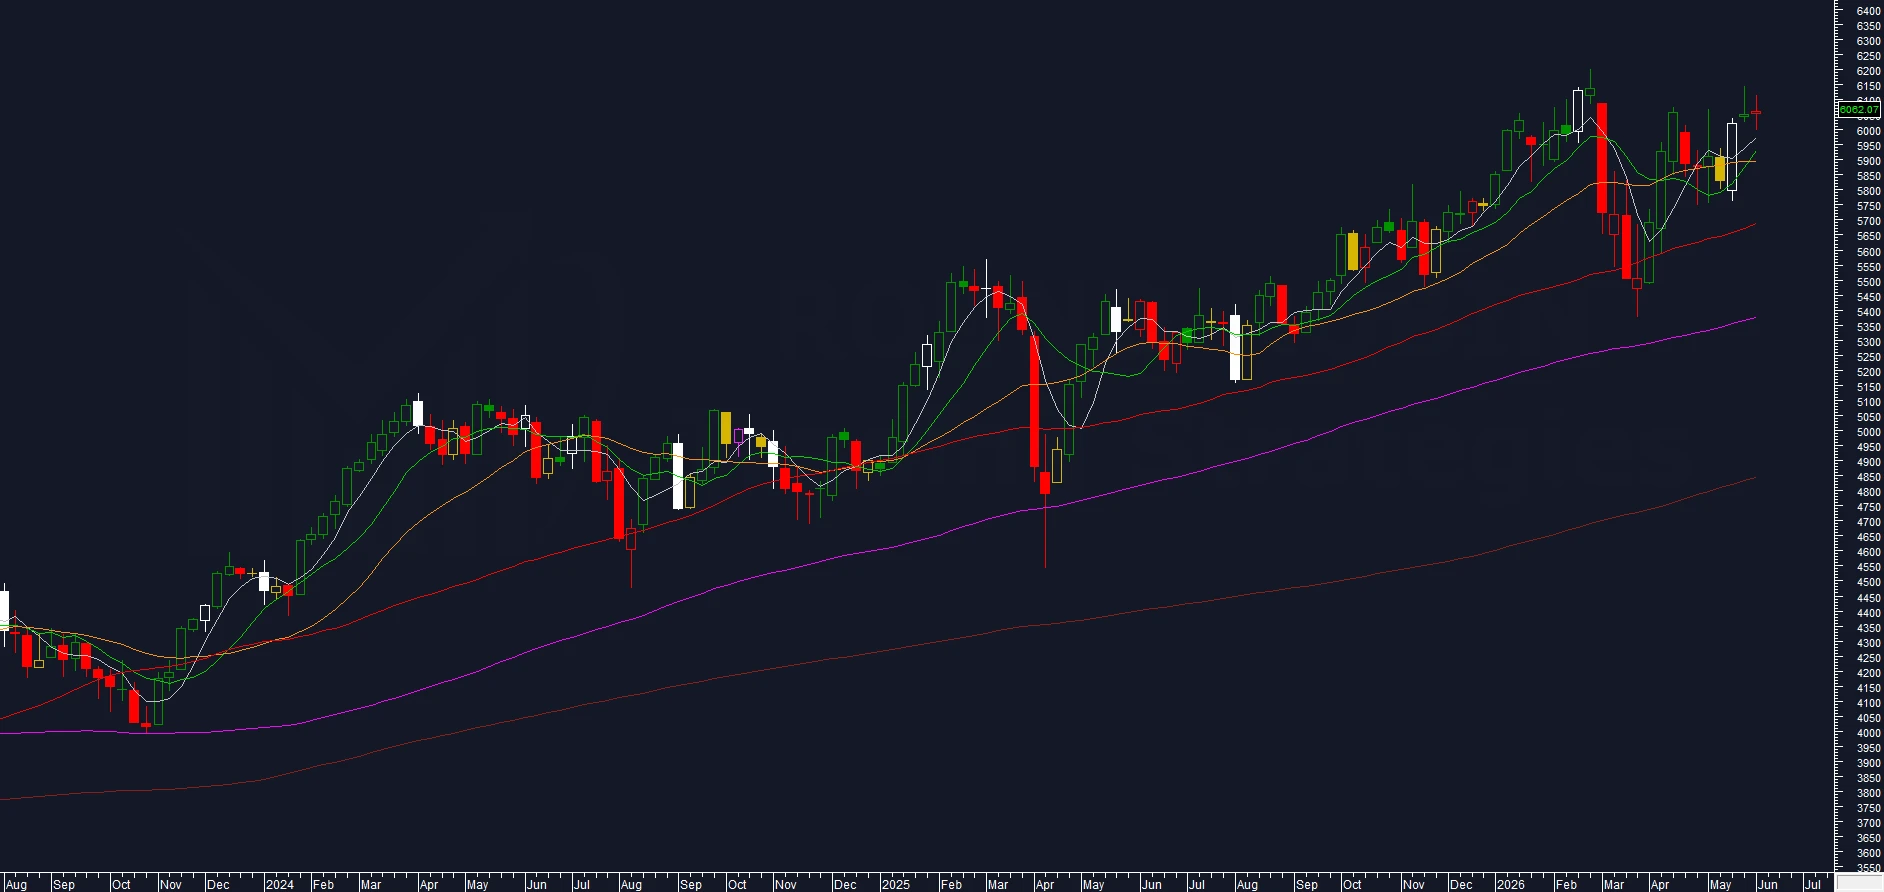
chart: EUROSTOXX 50 weekly
In last week’s Charts Flash, the parallel with the February top indicated lower highs and lower lows with a negative body as the probable scenario for the coming week.
Lower highs and lower lows materialized: high 6,113.39 below last week’s 6,144.64, low 5,997.74 below 6,023.26. The negative body did not confirm: the close at 6,062.07 is slightly above both Monday’s open and last week’s close, with a body of 8.19 points. Open 6,053.88, range 1.93%, volatility in line with the previous week.
Unlike other indices, the EUROSTOXX50 swing remains positively sloped and has not realigned with the system’s position.
The system maintains Short: no new condition has emerged.
⚡ DAX
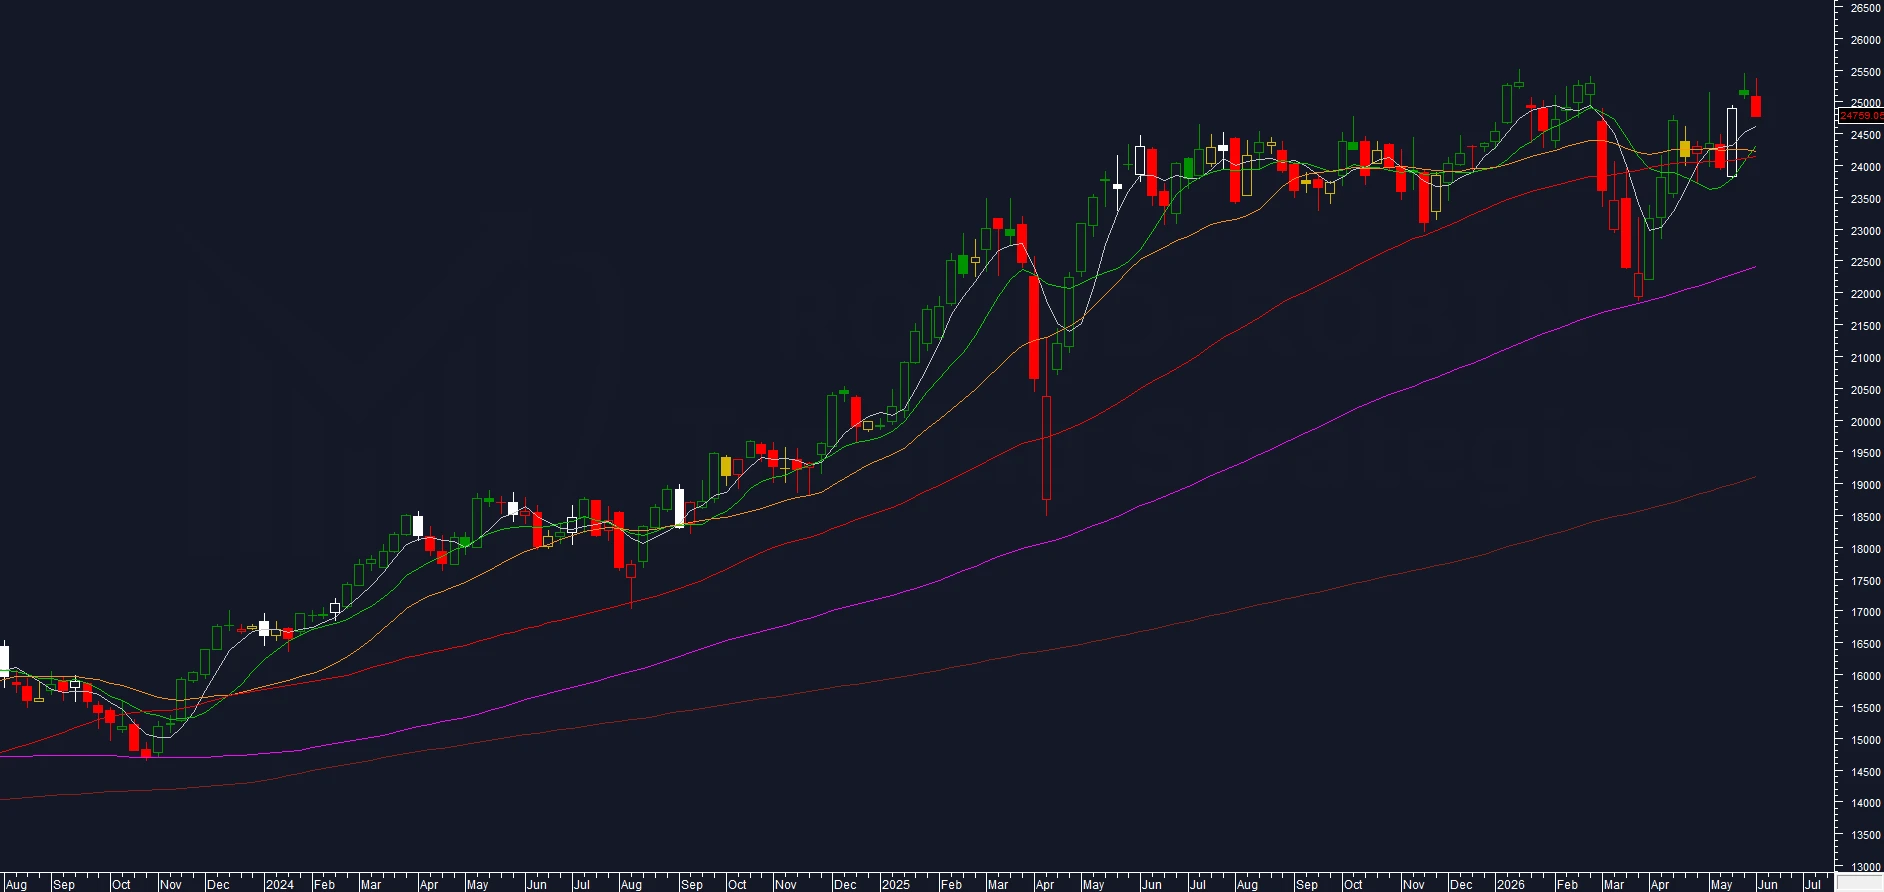
chart: DAX 30 weekly
In last week’s Charts Flash, the sequence of tops with contracting range and visible upper shadow was identified as a recurring pattern, resolved on multiple occasions with a pullback. The system remained Short in the absence of closes above 25,152.
This week delivers exactly that scenario. Open 25,083.24, high 25,362.83, low 24,756.47, close 24,759.05: lower highs and lower lows, negative body of 324.19 points (-1.29%), close at the weekly lows. Bears dominated the second half of the week with no room for recoveries at the close.
The range bounces to 2.45% after last week’s drop, but remains below the short and long-term averages converging around 3%, a signal that the volatility structure has not yet reversed.
This week the DAX shows lower relative strength than the EUROSTOXX50, which closed in slightly positive territory: the divergence widens.
The system maintains Short. The swing turns bearish but remains above zero, with the probability of further downside remaining elevated.
⚡ NIKKEI 225
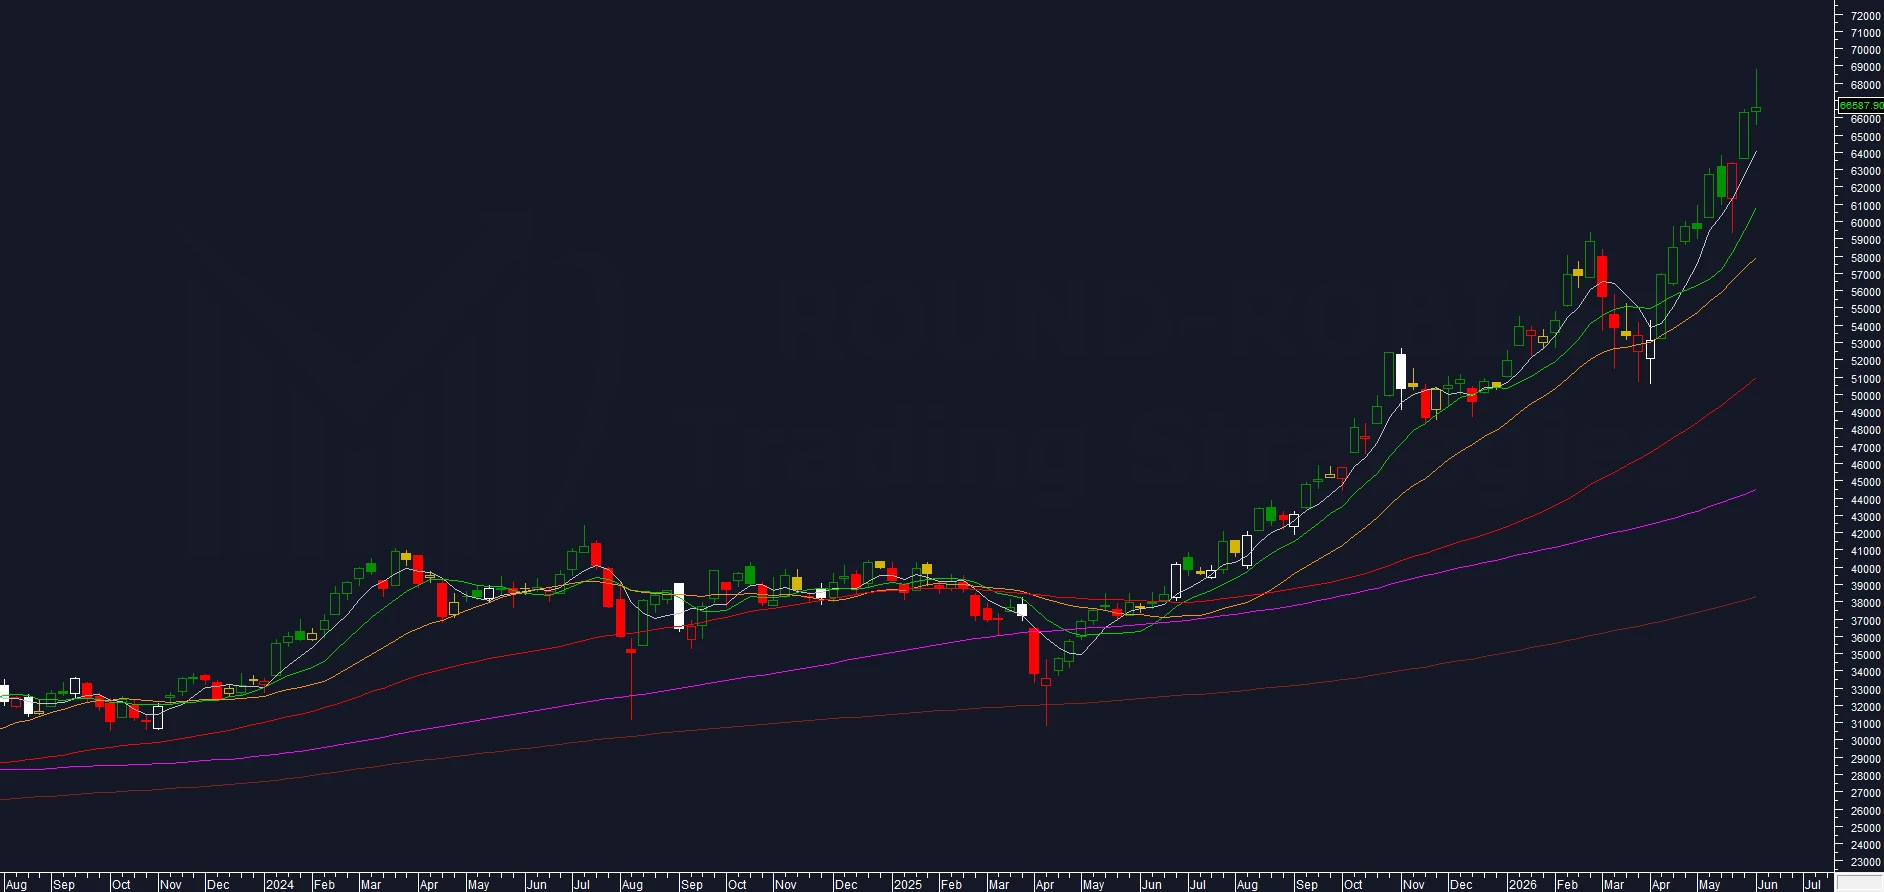
chart: NIKKEI225 weekly
In last week’s Charts Flash, the break of all-time highs in the Nikkei 225 was read as a probable bull trap, with the MA200W overextension at +66.90% as the main argument against a new long entry.
The bull trap did not materialize: the Nikkei 225 sets new records on both the high at 68,786.49 and the close at 66,587.90. It is, however, the candle structure that captures attention: a body of just 224.47 points (+0.34% on the open) and an upper shadow of 2,198.59, the largest of the entire current bullish leg. Bulls pushed into the 68,800 area intraweek without managing to defend those levels at the close.
MA200W overextension rises to 71.25%, a new all-time record.
Volatility remains high at around 13.5%, with the weekly range still near 5%.
The system re-enters Short. The theoretical probability of lower highs and lower lows calculated by the algorithm exceeds 80%, but as with the previous trade, the entry occurs without a price signal. The coming week should already provide an indication of the actual excess in the Japanese index’s prices.
⚡ BITCOIN
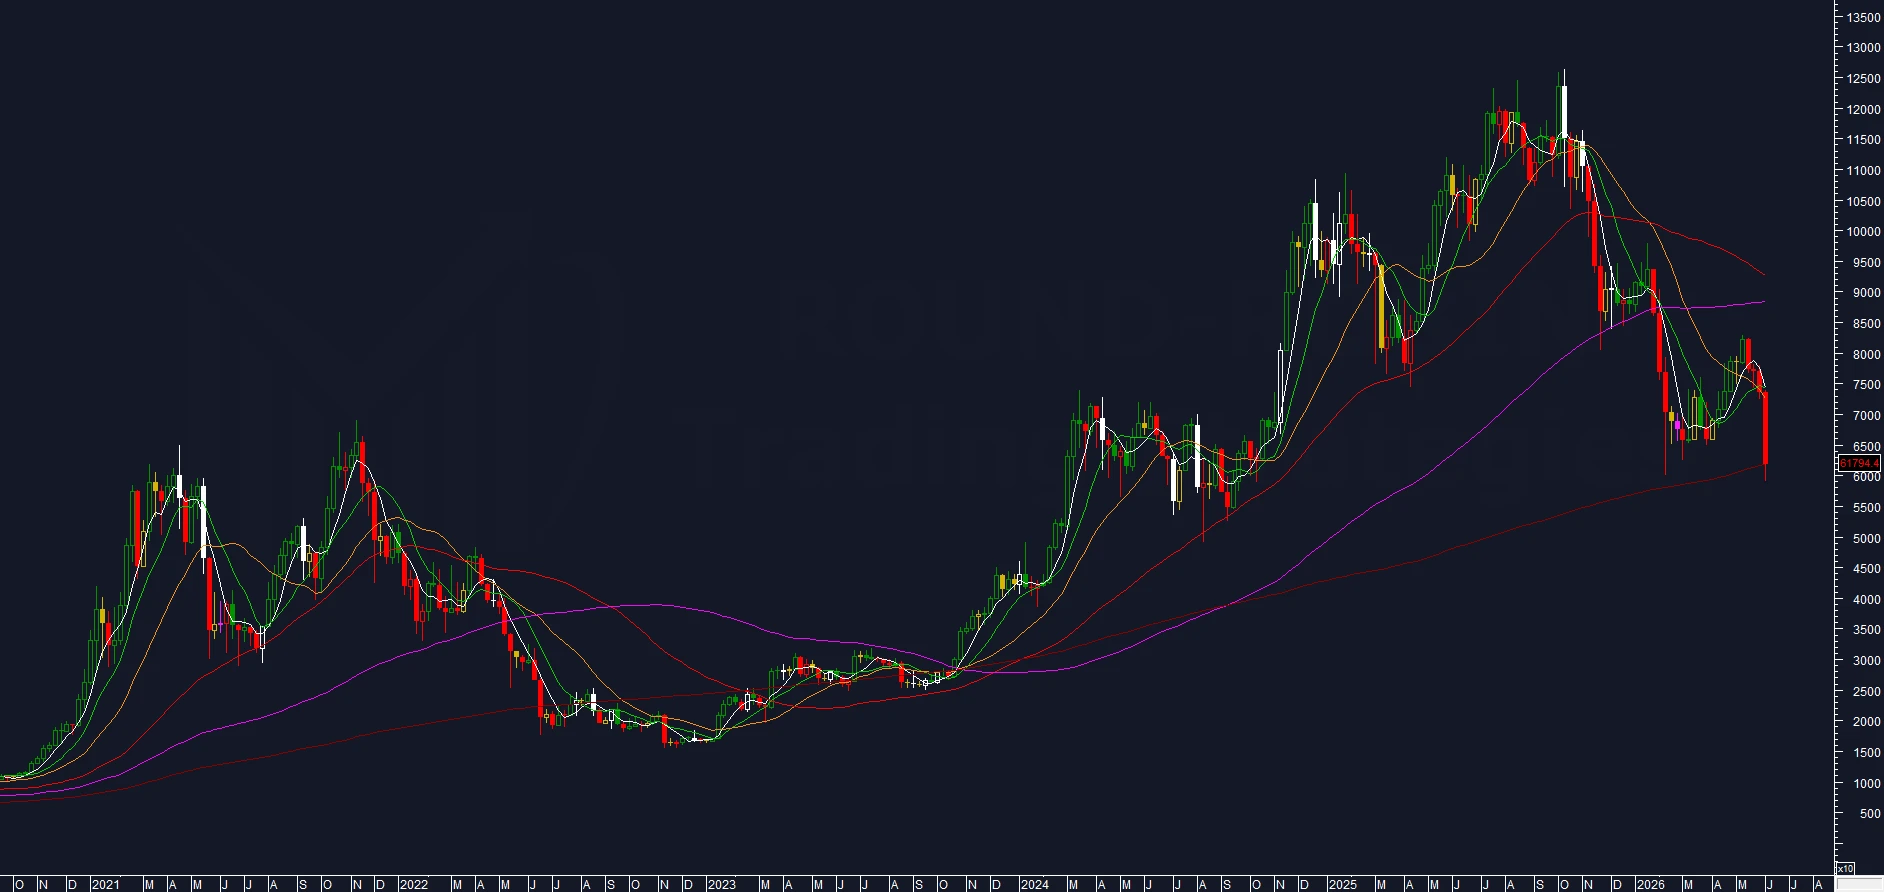
chart: Bitcoin weekly
Bitcoin returns to the radar after several weeks of absence, with a candle that leaves no room for interpretation. Open 73,575.18, high 73,978.52, low 59,073.01, negative body of over 11,700 points, weekly range at 25%.
The January 2026 low at 60,001 was breached intraweek with a low at 59,073.01. Prices then recovered the level, and close to the weekly close they are trading around 61,800, above the reference. MA200W has held for now.
Volatility jumps to 44.72%, with the weekly range at 25%. Graphically the structure looks like the beginning of a new bearish leg, but quantitative confirmations are still missing.
The system remains flat, with high probability of entering Short. A hold from current levels would carry no bullish implication.
Leave a Reply