


Weekly monitoring of the Italian benchmark index.
Why do we do this?
Check our strategy page.
My proprietary DBBT indicator identifies misalignments between the current price and the expected technical level on major indices.
Every week, the FTSE MIB is in our crosshairs.
The hunt is open.
Last week we left the FTSE MIB in a neutral stance, with shorts closed and a loss of bearish momentum still to be confirmed.
The confirmation came. In spectacular fashion.
A short week due to the Easter holidays, just 4 sessions with Friday closed. The new week reopens on Tuesday after the Easter Monday closure.
In just 4 days the market produced a bullish candle with a massive body that historically has almost always completely changed the short-term technical structure.
The Big Picture
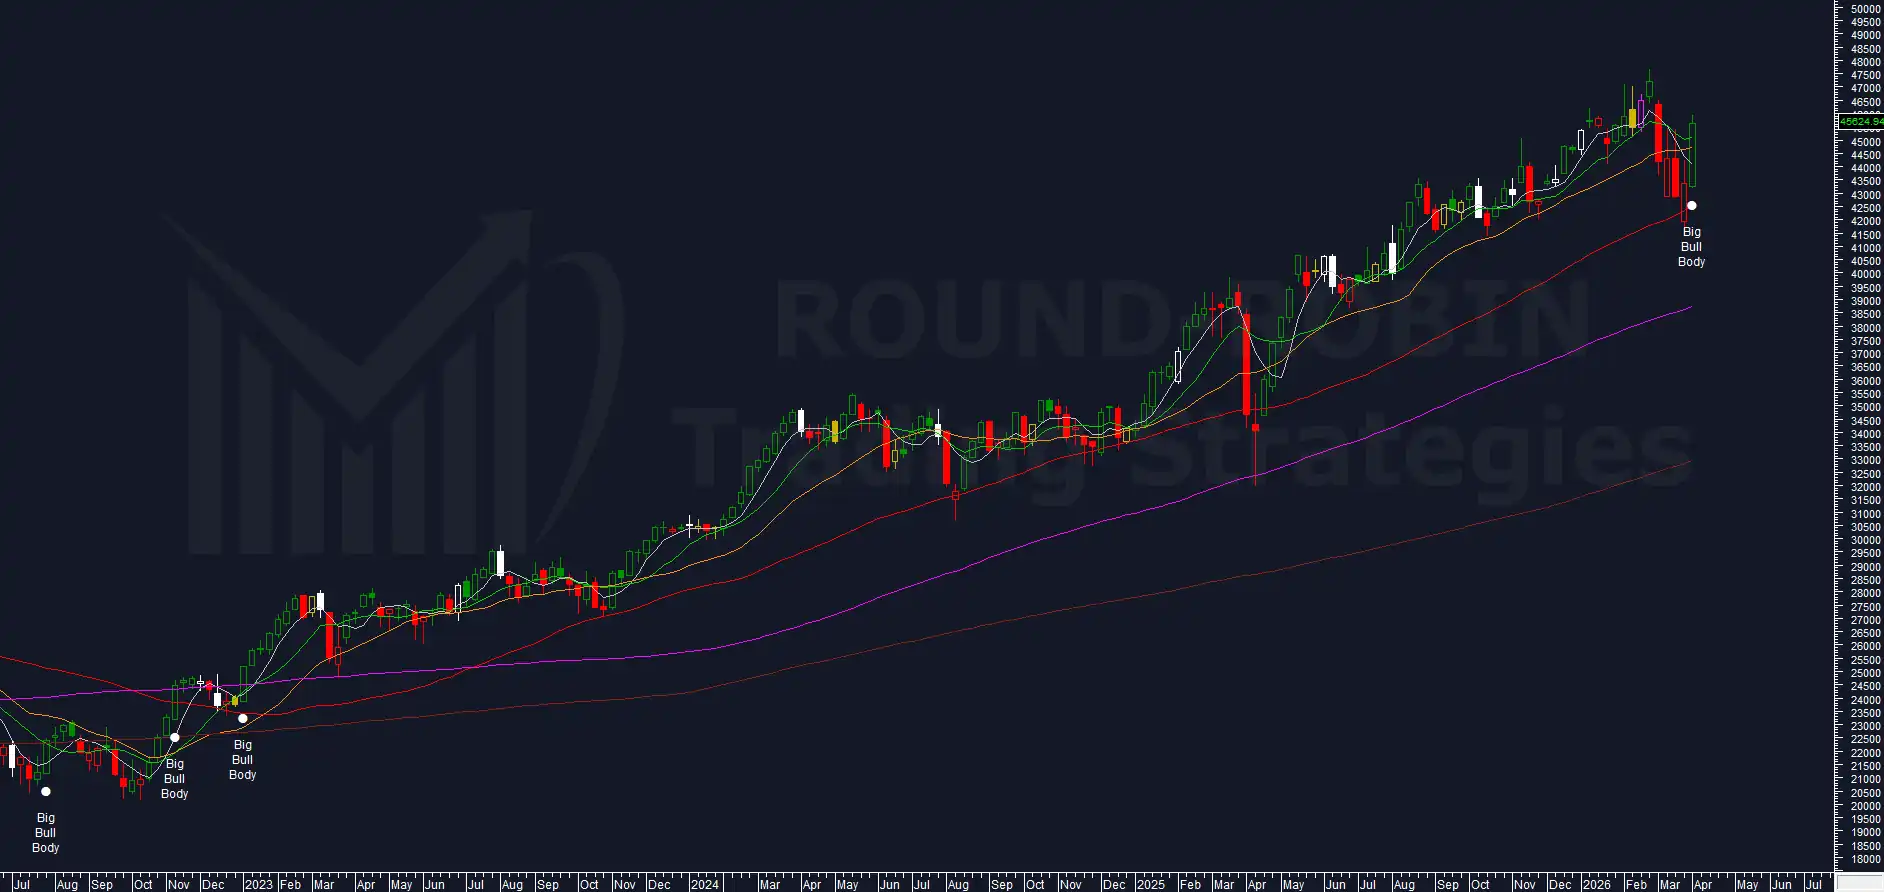
chart: FTSE MIB weekly
Open 43,268.48, High 45,914.68, Low 43,188.06, Close 45,624.94.
A bullish candle with a massive body that stands out across the entire chart. A rising low compared to the previous week and a high that surpasses the highs of the three prior weeks.
MA5W, MA20W and MA10W all recovered in a single move. The MA5W is the only one that remains negatively sloped.
The MA50W fulfilled its support role, as anticipated by the loss of momentum from the previous week that had triggered the short exit in our system.
Weekly close at 45,624.94: a 5.18% gain over the previous weekly close.
Volatility Indicator
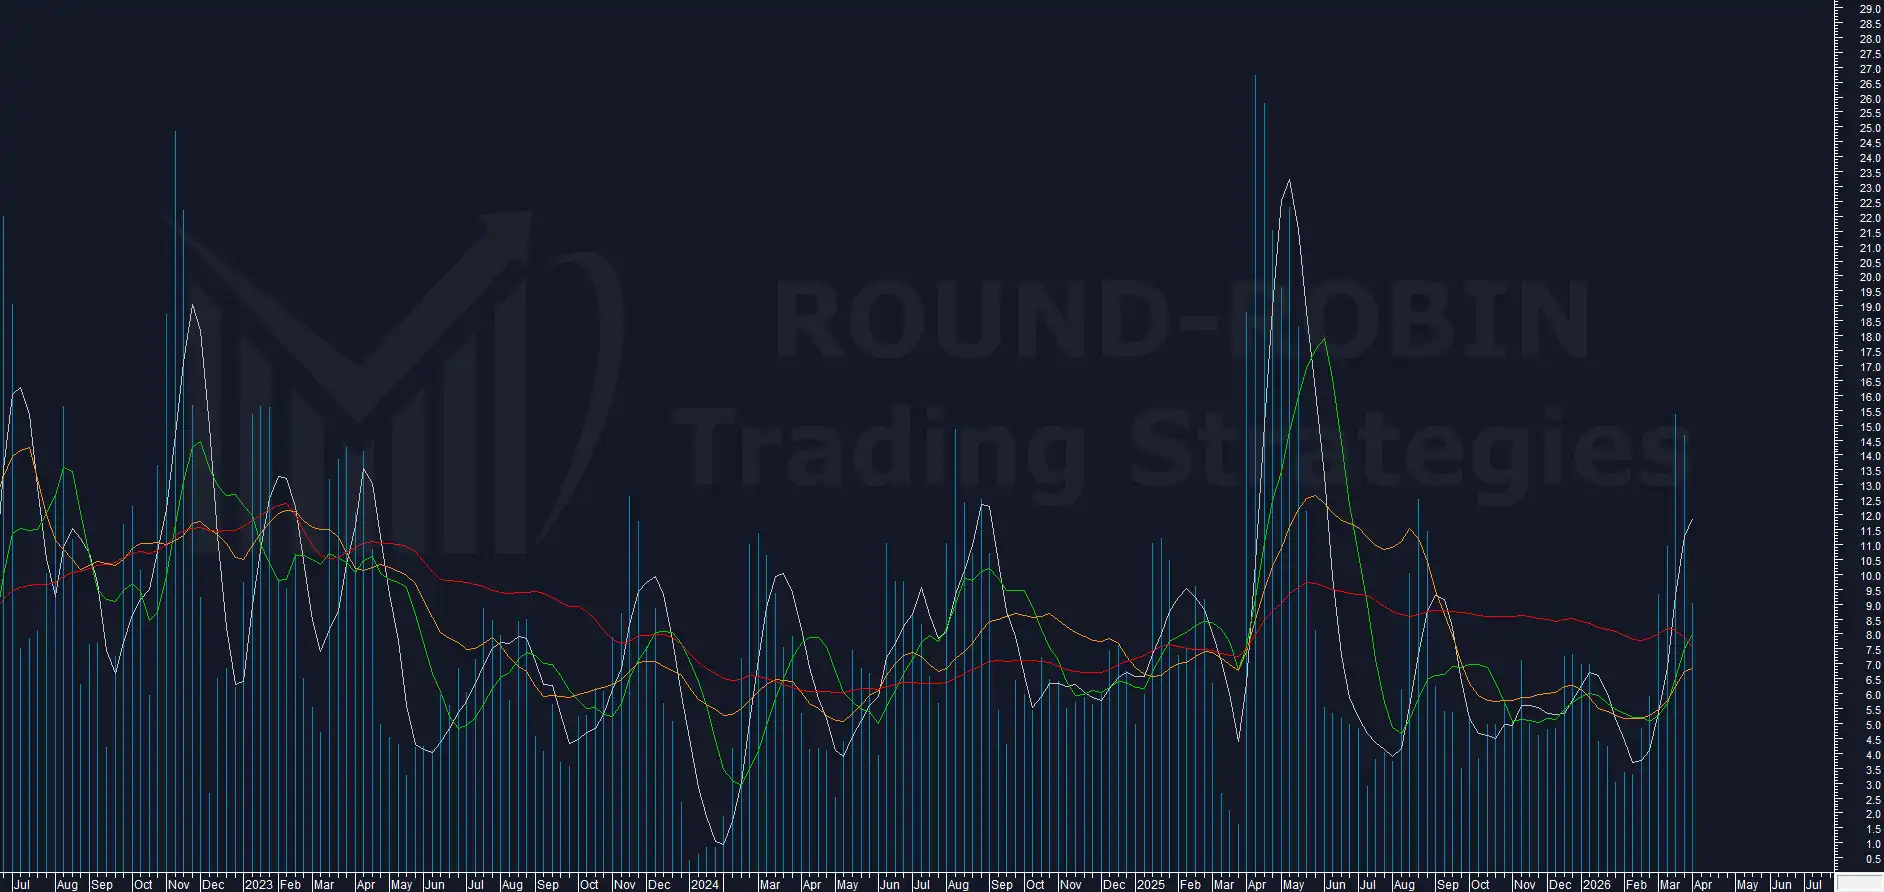
FTSE MIB weekly – proprietary Volatility Indicator
The volatility indicator falls again, down to 9.05%.
A stable range and a commanding bullish body confirm what we wrote last week: the loss of bearish momentum was real.
And it is precisely the candle body that is the most significant bull marker this week.
Bullish Body
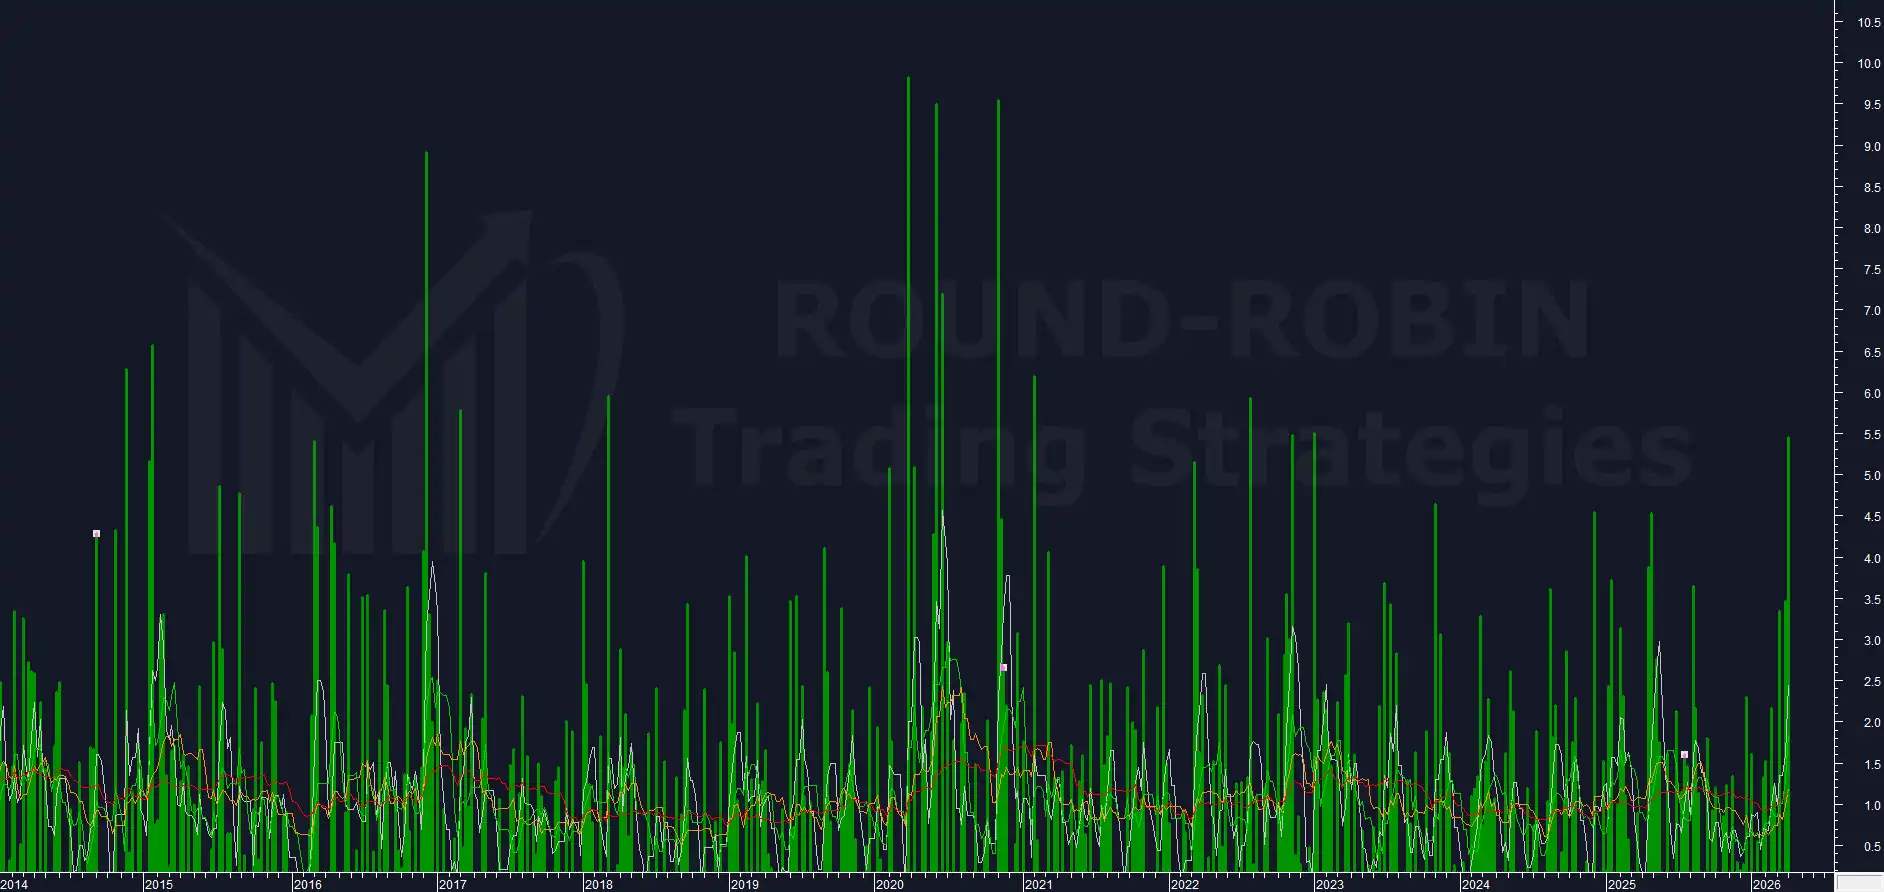
FTSE MIB weekly – bullish bodies %
The bullish body is the most significant element in a week of just 4 sessions.
At 5.45%, it ranks twelfth by percentage extension over the last 10 years. In terms of points, 2,356.46, to find a body this large we have to go back to 28/09/2001, with the rebound after the tragic events of September 11th.
In just 4 days a historic candle has formed that deserves the utmost attention.
Since 2020 there have been 9 weekly candles with rising highs and lows and a body with a percentage extension at least equal to this week’s.
Last Thursday’s is the tenth.
9 out of 9 coincided with a market bottom, at least in the short term.
Will this time be different because of geopolitical tensions? We shall see, but that is a topic that goes beyond the quantitative approach to markets.
Conclusion
Short week, historic week from a numbers standpoint.
A bull candle, falling volatility and a stable high range triggered a long entry in our system.
The stop loss is placed below the weekly low at 43,188.06 with a target in the 47,200-47,300 area. The trade should last at least 3 weeks and we will obviously keep it monitored.
Leave a Reply