


Weekly appointment with the most followed charts in the world.
Inevitable to talk about it.
Bloomberg covers it with every new explosion in Iran or at nearby oil facilities, it’s on everyone’s lips, and it directly affects investors, market operators, and anyone who needs to fill a tank.
Volatility is high, wild… but with a systematic approach we can dare to analyze it.
Let’s look at the possible scenarios.
A necessary premise: volatility is so high that even if someone had the right trade in mind and got the timing wrong by just one or two weeks, the pain could be very significant.
Big Picture: 2007-2026
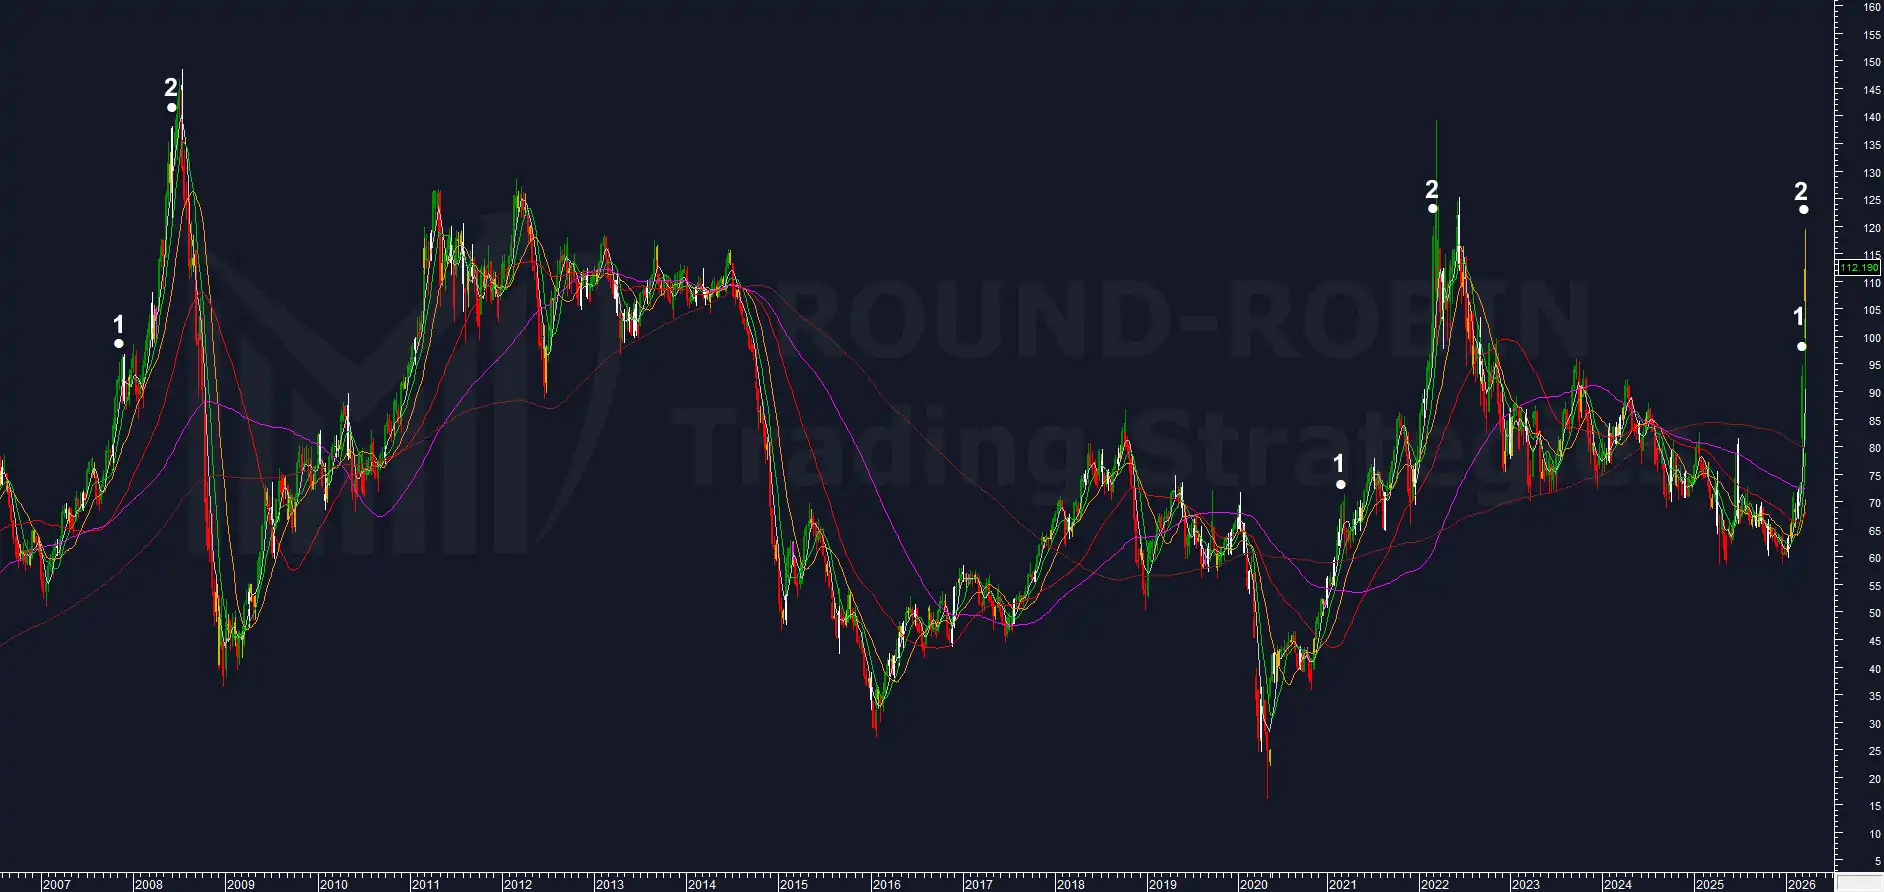
chart: Brent Crude Oil weekly 2006-2026
Let’s start from a distance.
Our setup accounts for volatility, weekly pressure, and overextensions on the moving averages.
We saw this setup in 2007-2008, in 2020-2022, and now in 2026.
In previous cycles the two signals were separated by months.
This time they arrived consecutively, one week after the other.
The model shows a faster excess than usual: setup 1 burned through territory so quickly that setup 2 appeared without the normal time gap.
The operational consequence is direct: the trigger will come sooner.
We need to understand, however, whether we are looking at the same type of excess as in previous cycles or at something structurally different.
To answer that, let’s zoom in.
The Last 5 Post-Covid Years
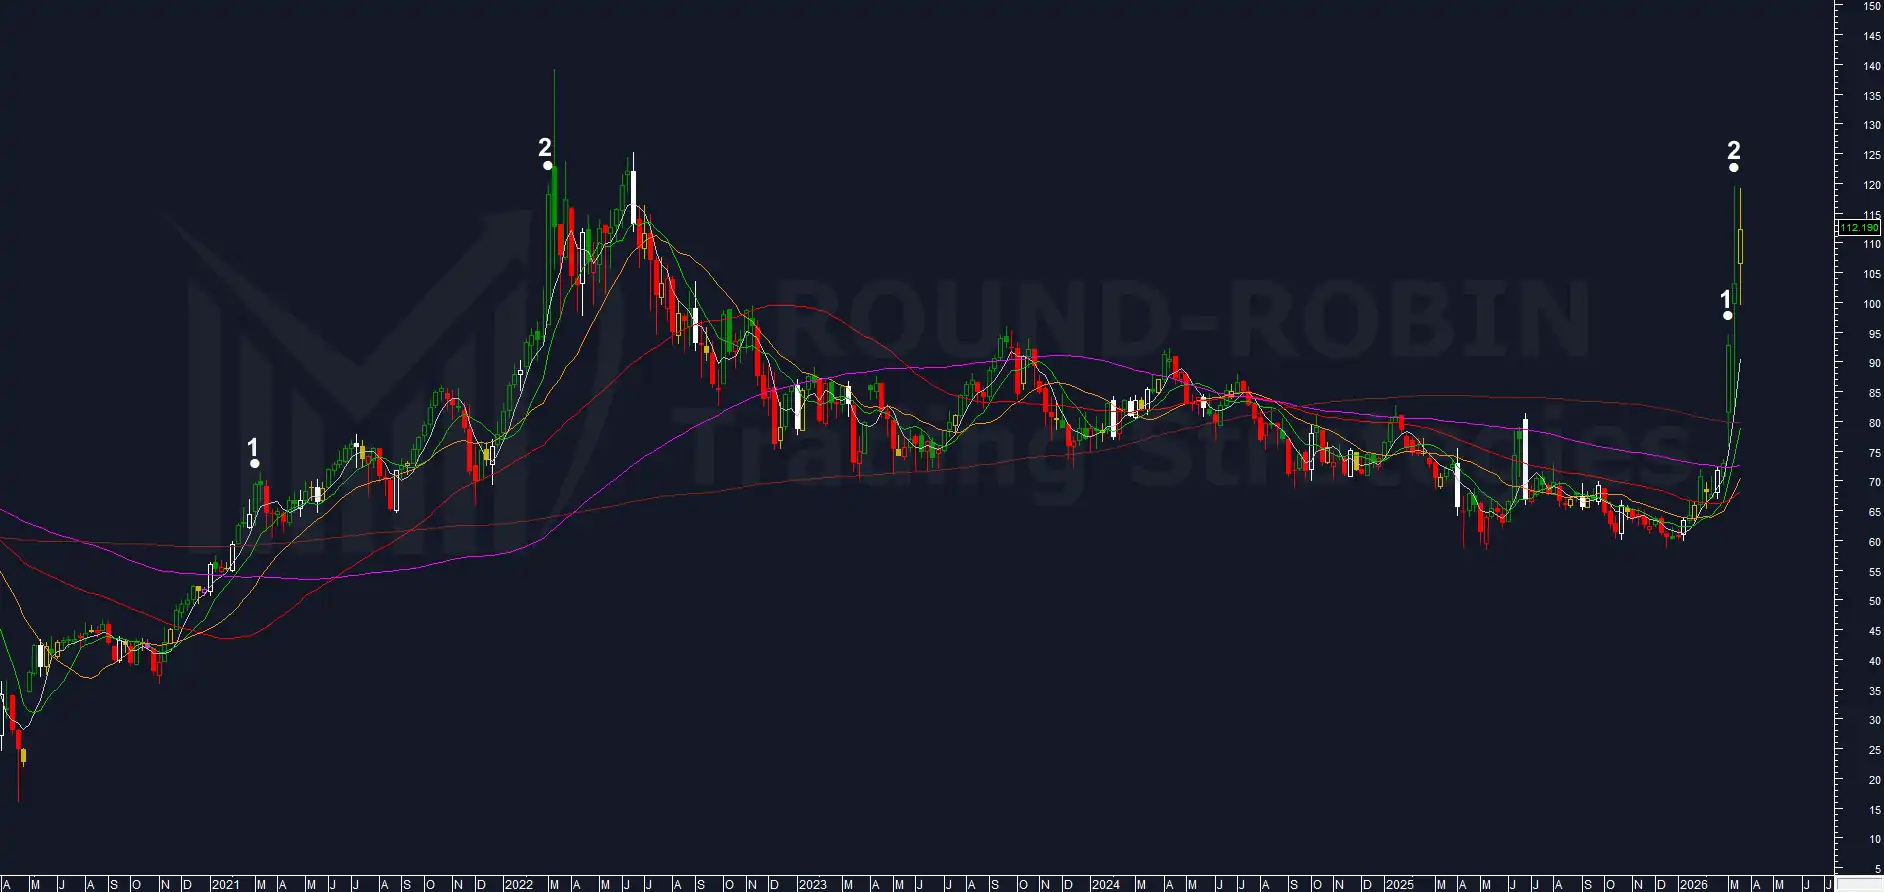
chart: Brent Crude Oil weekly
There is another similarity: the week of the high, both in 2022 and in 2026, formed both a long upper shadow and a long lower shadow.
Prices moved in just a few weeks from a three-year low to touch the 2022 highs.
In 2022 the top candle closed negative both against the previous close and the weekly open.
The long upper shadow became a bear zone and every price reentry into it proved an excellent shorting opportunity for the bears.
Today looks different.
Setup (2) arrived immediately, and there is still no sign of weakness.
The long upper shadow of the week of March 13, ranging from 119.50 to 103.14, was invaded by the bulls this week.
The bears had 16 dollars of territory to defend: they now control roughly 7, from 112.19 to 119.50.
The weekly candle body is entirely contained within the long upper shadow, showing that the bears failed to repel the attack in full, but the bulls cannot celebrate yet.
This week is an inside candle.
From the high of 119.13 there was nonetheless a rejection to 112.19.
This is exactly the range to watch carefully: 112.19-119.50.
The Close Chart
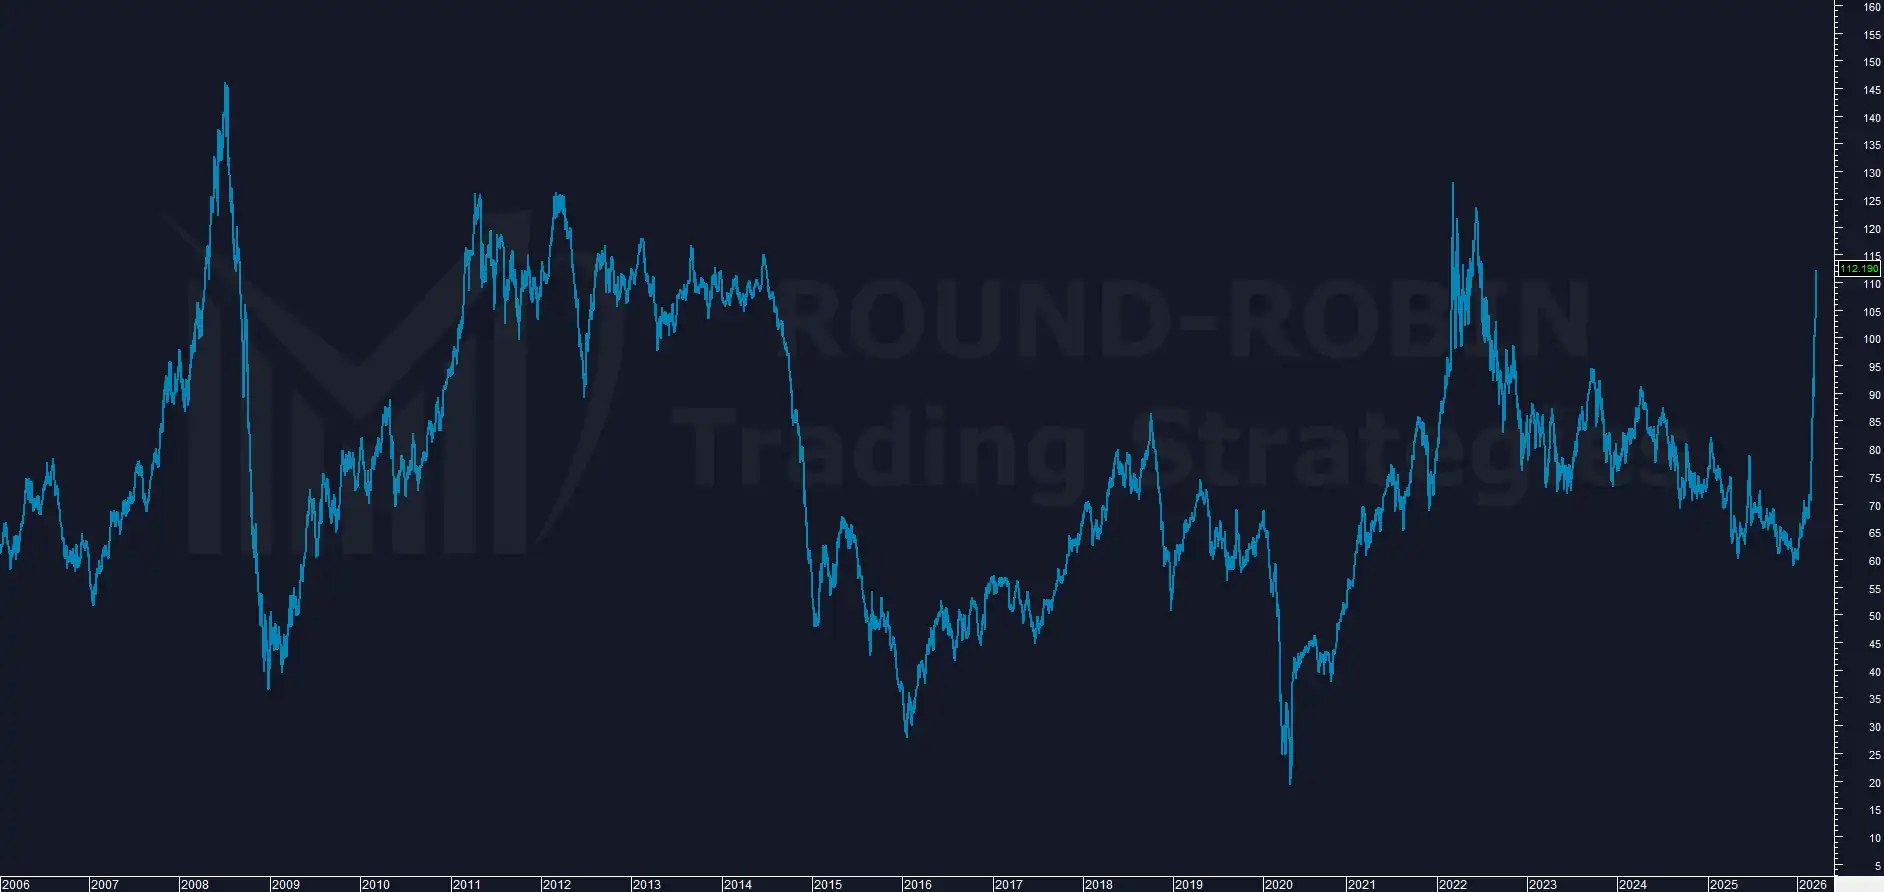
chart: Crude Oil – weekly close
Since we have found nothing conclusive, let’s try to simplify.
The close chart from 2006 to today shows one thing clearly: the current slope is not sustainable.
It has an angle seen only during the full-blown 2007-2008 crisis, with the outbreak of the war in Ukraine in February 2022, and at the exit from the Covid lows, although the latter is not comparable in terms of trend and excess: it was a bounce, not a continuation.
Markets have no concept of “risen too much” or “fallen too much”, but the angle of ascent certainly deserves a deeper look, which is where overextensions come in.
MA10W Overextension
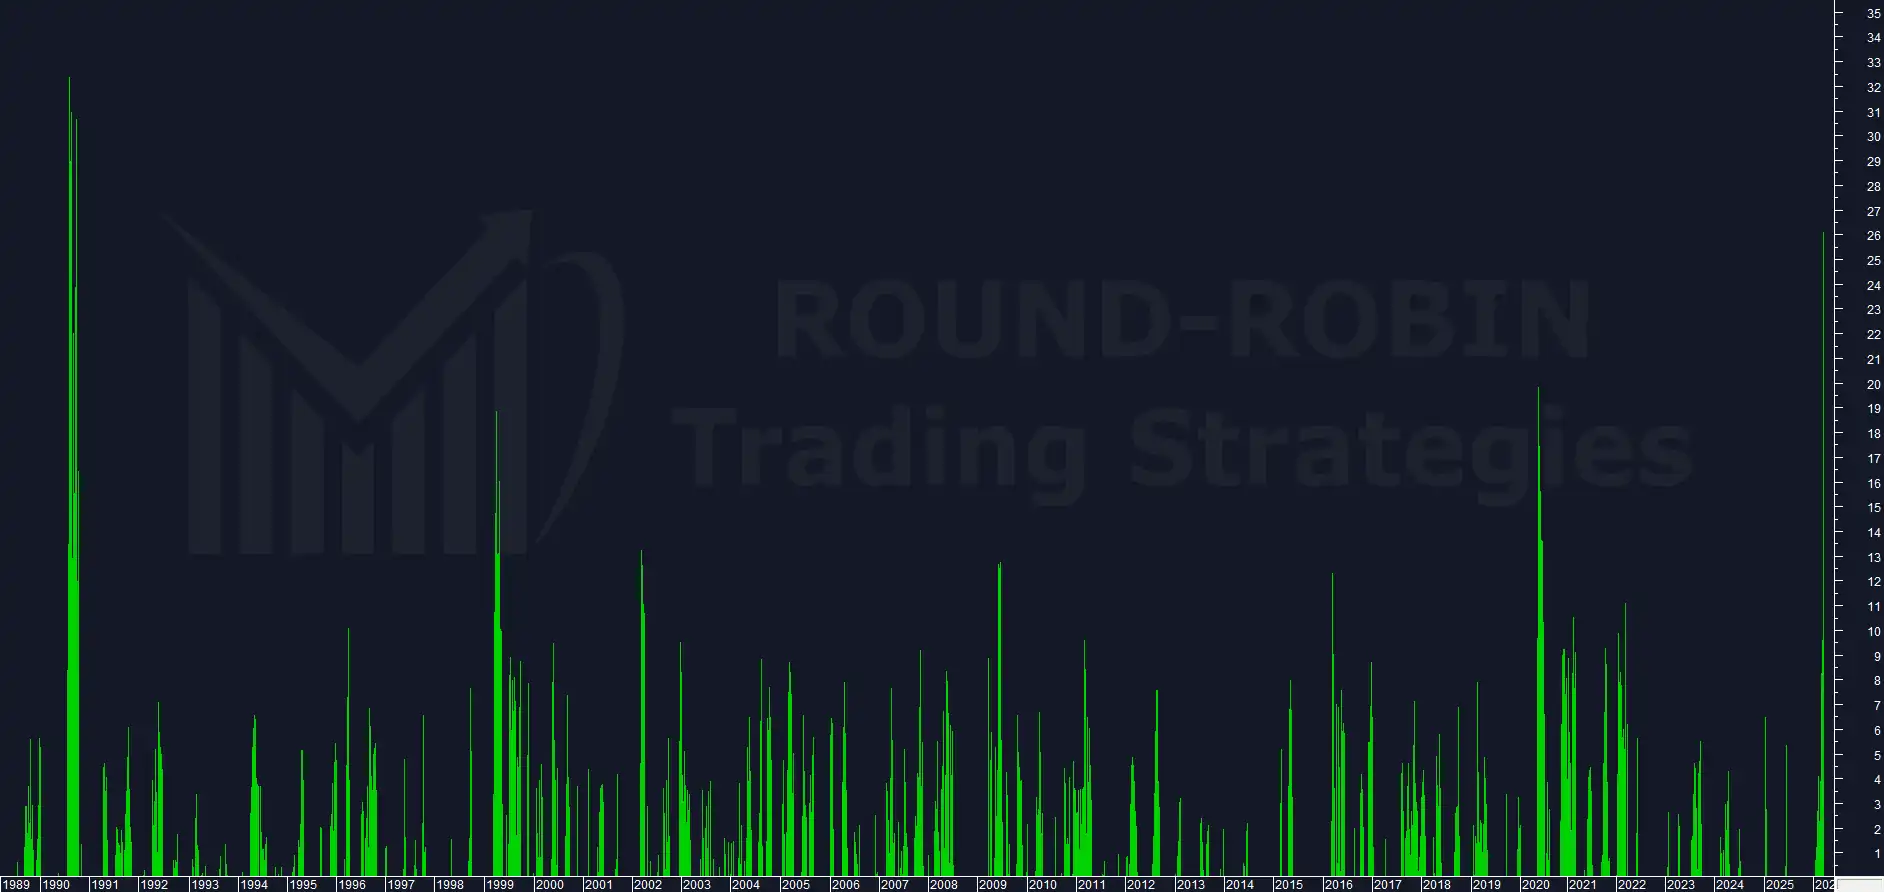
chart: Brent Crude Oil – MA10W overextension
It shows without doubt that we are facing an exceptional event.
The volatility explosion was so immediate that from 2.3% four weeks ago we are now at 26.14%.
MA20W Overextension
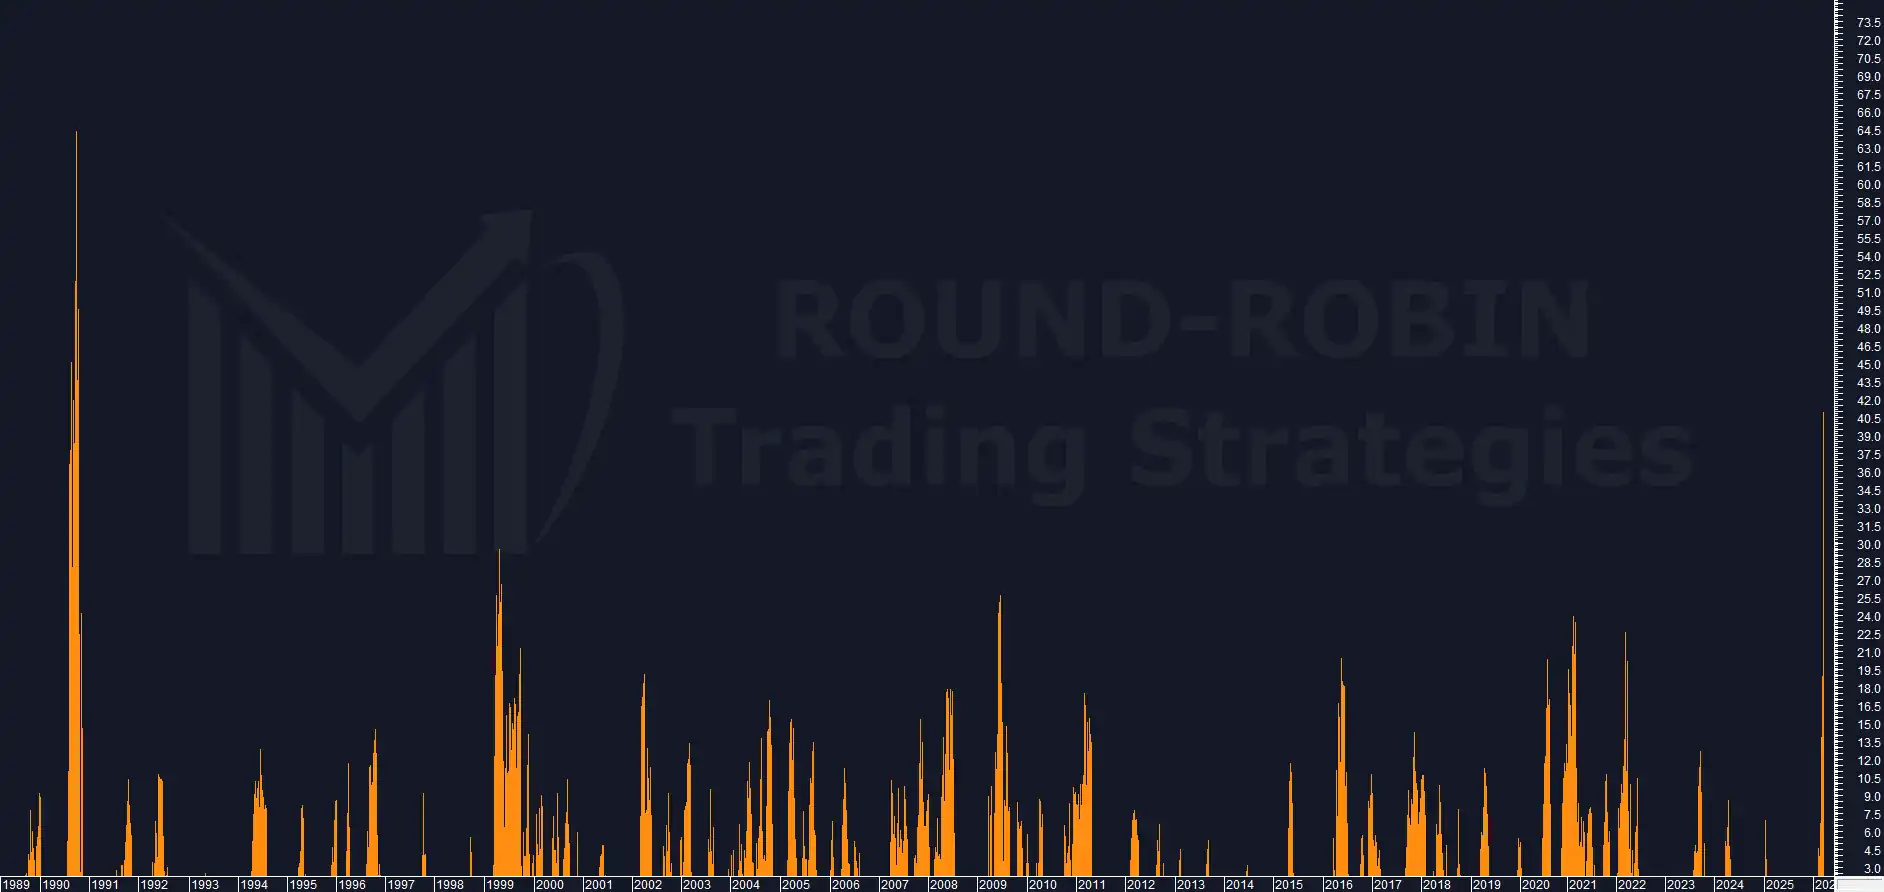
chart: Brent Crude Oil – MA20W overextension
At 41.01%, the MA20W stretch is second only to 1990, while typical spikes run around 20%.
MA100W Overextension
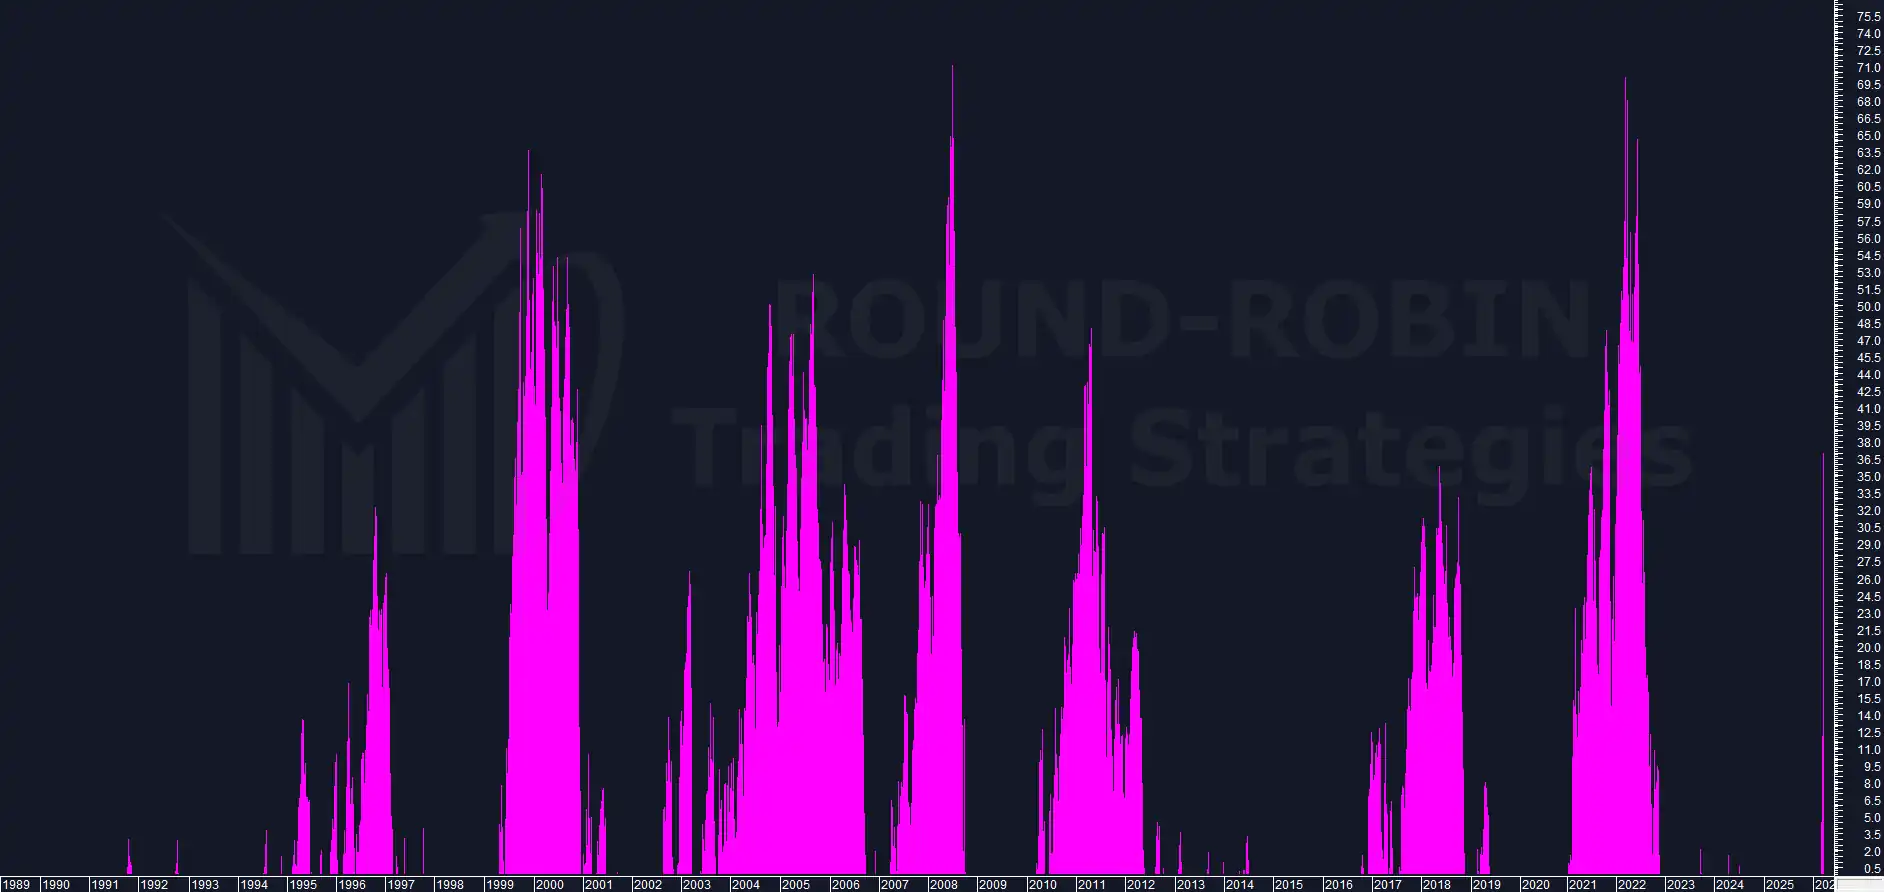
chart: Brent Crude Oil – MA100W overextension
This is the chart that completes the picture.
The excess is short and medium term.
On the MA100W the current spike sits well below the level of other historical maximum extensions.
In the short and medium term the market shows excess and conditions are typically toppish, but the MA100W tells us the move has not yet consumed the fuel of the great historical extensions.
This could be a technical pause within a move that may have a second leg.
Toppish describes a phase, not the overall picture.
The two timeframes do not contradict each other: they must be read separately and kept both active.
Conclusions
What we have analyzed does not account for the current or future geopolitical situation.
A trading model based on rare events must rely on numbers, and those numbers must point to the possible scenarios.
The slope and the short-term overextensions show this is not a sustainable situation in the short and medium term.
It is a typical toppish situation, but one that could see, after an initial correction, a new attempt to assault the highs.
It is worth recalling that already in week 11 we had put Brent on the radar, highlighting how the weekly range of $38.34 was an all-time record in dollar terms and how our volatility indicator had reached levels seen only during the Covid period, the 2007-2008 financial crisis, and the Gulf War (1990).
From an operational standpoint: the setup is there, the trigger is not yet.
With this configuration we have two possible triggers:
- Weekly bull trap: new high above 119.13 followed by reversal
- Direct rejection of the 112.19-119.50 area with a close below 106
Pro: exploits the momentum and we know we have exceptional historical short-term excess.
Con: it could be a violent reversal that already trims a significant portion of the potential gain before the entry signal.
The bear scenario on Brent will likely tie in with the evolution of other assets: in this week’s Charts Flash we outlined the conditions under which our systems, currently short on S&P500, Gold and Silver, might start closing positions.
Soon only members will have access to this content. Sign up for free.
Leave a Reply