


Quick observations on the charts that caught our eye this week.
This week’s flash covers Brent, EUROSTOXX50, DAX and Nikkei 225.
Silver is close to a Short signal. Natural Gas is close to a Long signal.
Gold and Bitcoin remain without relevant changes.
Let’s try to go a bit more into detail.
⚡ BRENT
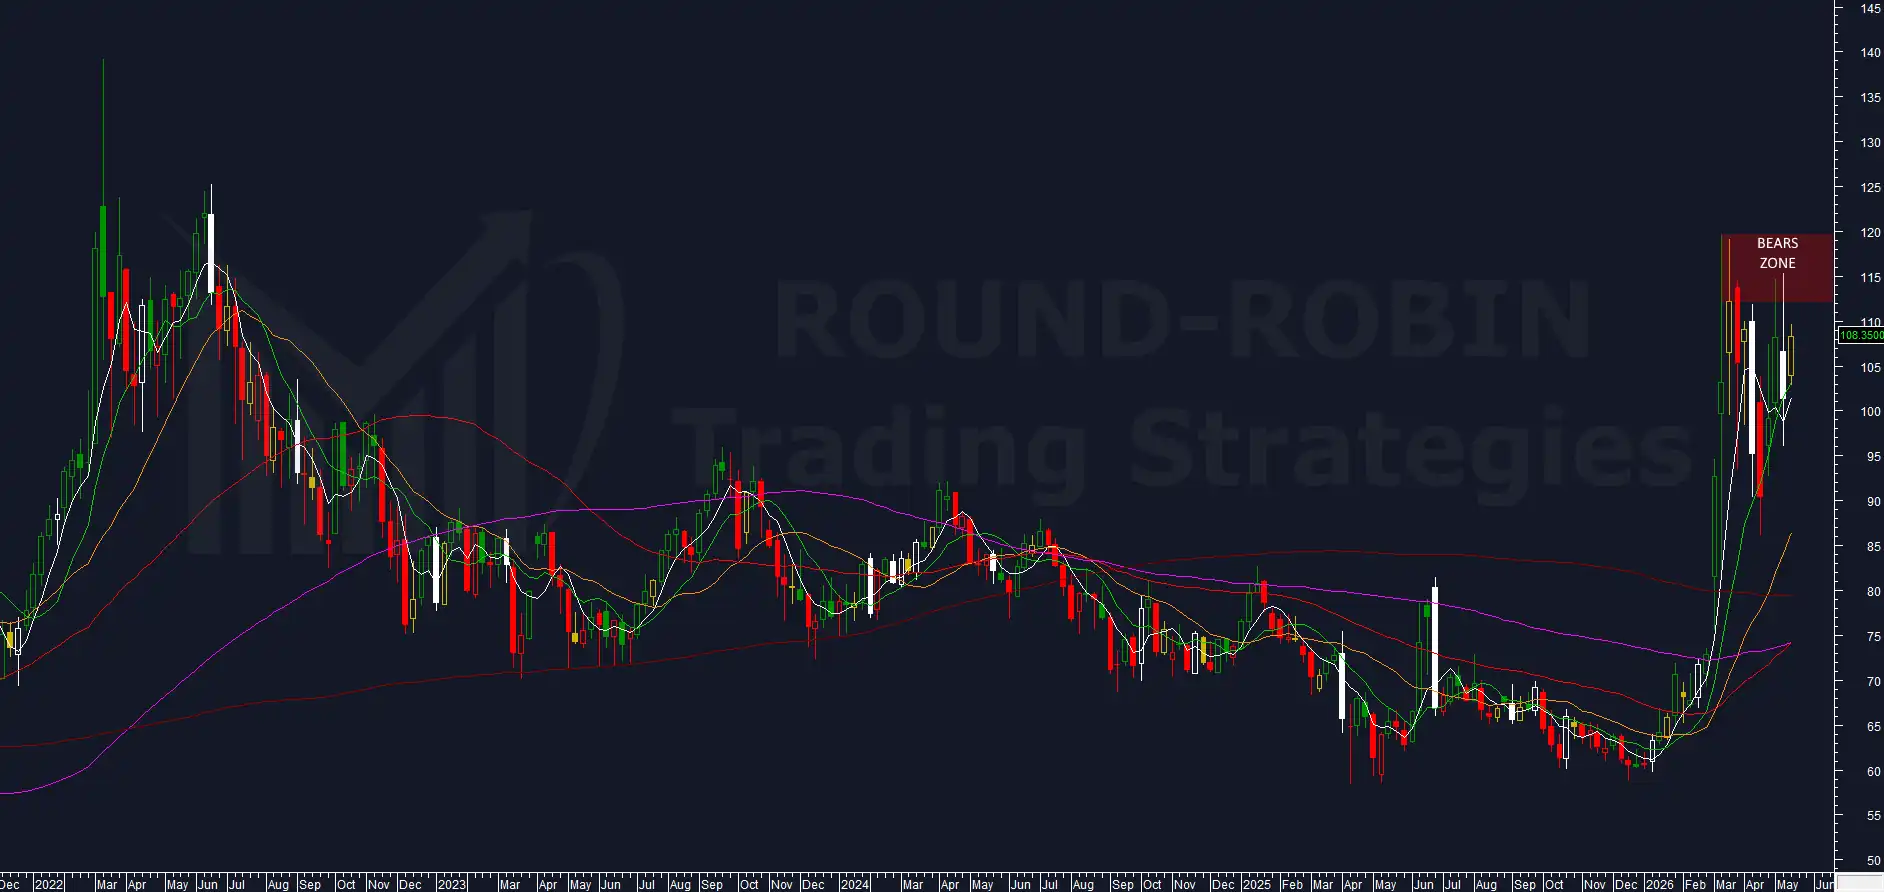
chart: Brent Crude Oil weekly
In last week’s Chart of the Week the system was Flat. The weekly candle was a complete outside week with rejection of the 112-120 area and support above 96. The candle body remained entirely contained within the previous one: volatility expansion without directional confirmation. The Volatility Indicator was pulling back from the spike, the Range Weekly% at 20.07%.
This week the picture changed. Inside bar with a positive body: open 104.00, close 108.35. The range narrowed sharply compared to the previous outside week, but price worked entirely in the upper half of last week’s body, closing above it.
The Volatility Indicator has been traveling on elevated values for 11 consecutive weeks. After the spikes above 100, the last 8 weeks have consistently stayed above 20%. The volatility expansion is structural, not episodic.
The weekly close is 108.35 (+6.97%). The system remains Flat.
This week’s inside bar technically has the characteristics of a continuation structure and therefore compatible with a further attack on the bear zone 112-120.
⚡ EUROSTOXX50
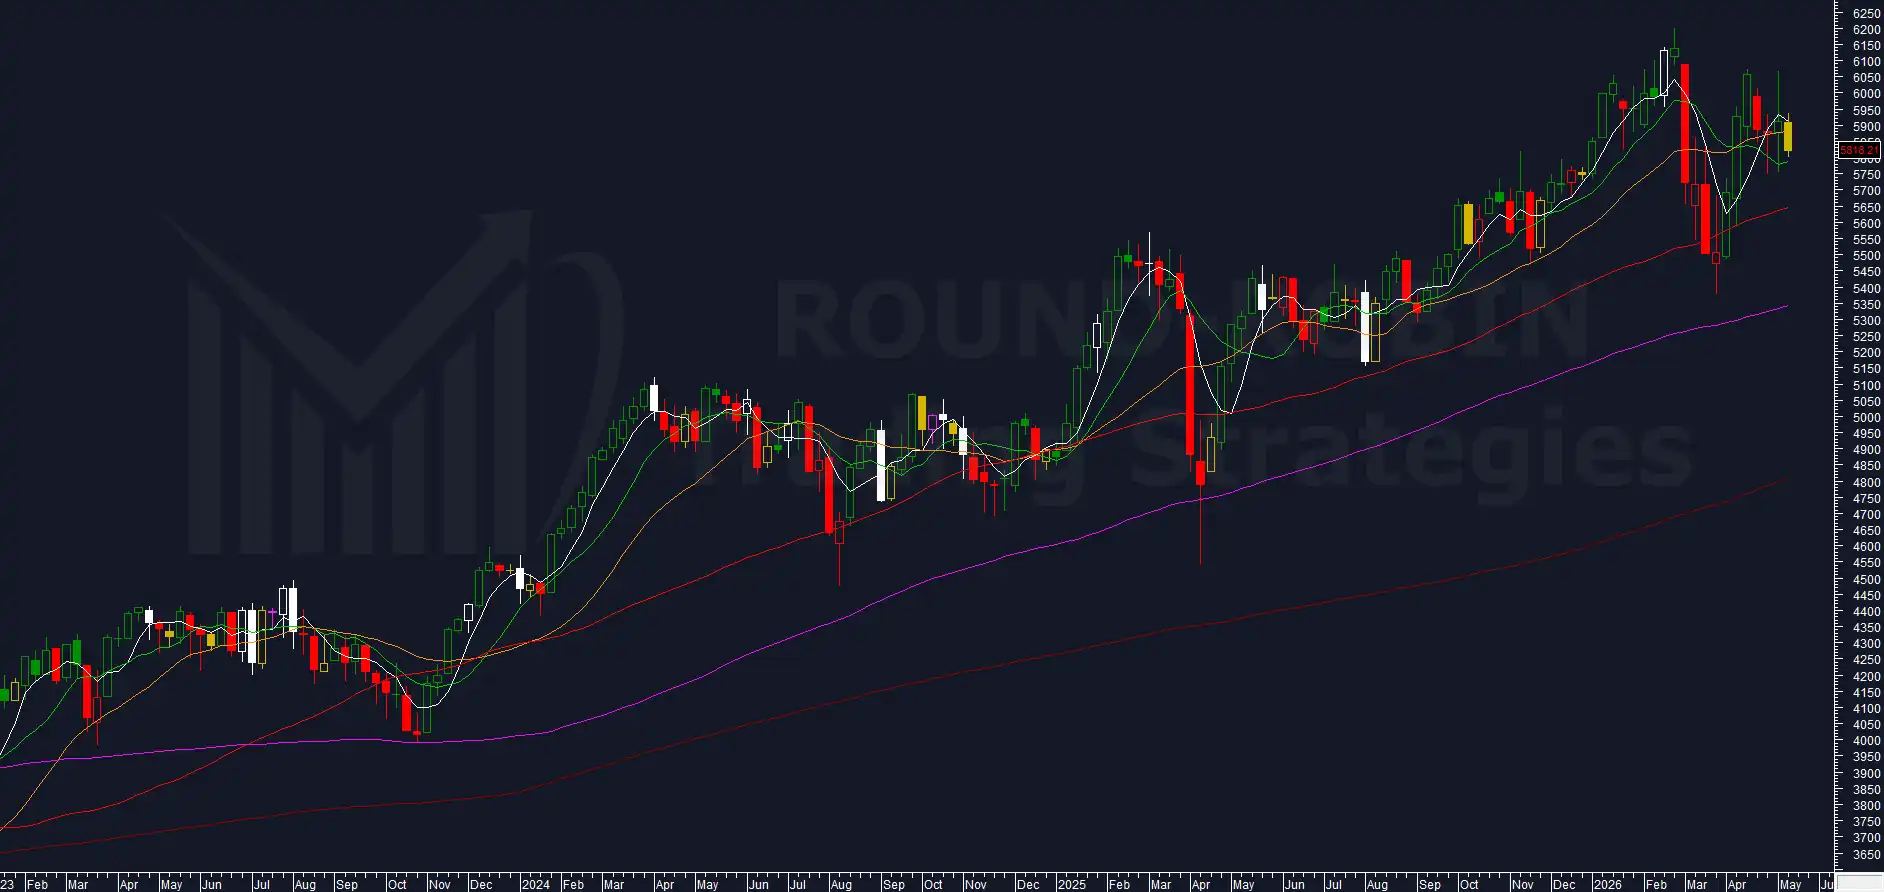
chart: Eurotoxx50 weekly
In last week’s Charts Flash the system was Short with higher highs and higher lows but a narrow body and wide upper and lower shadows. Price held above the MA20W and used the MA10W as support. The weekly close was 5,911.53.
This week no change on the system. After last week’s long shadows, the range compressed to 2.36%: inside bar almost entirely in the lower half of the previous candle. Weekly close at 5,818.21 (−1.58%), negative both versus the previous Friday and the weekly open.
For the coming week a break of 5,745 and the MA10W would confirm bearish momentum.
⚡ DAX
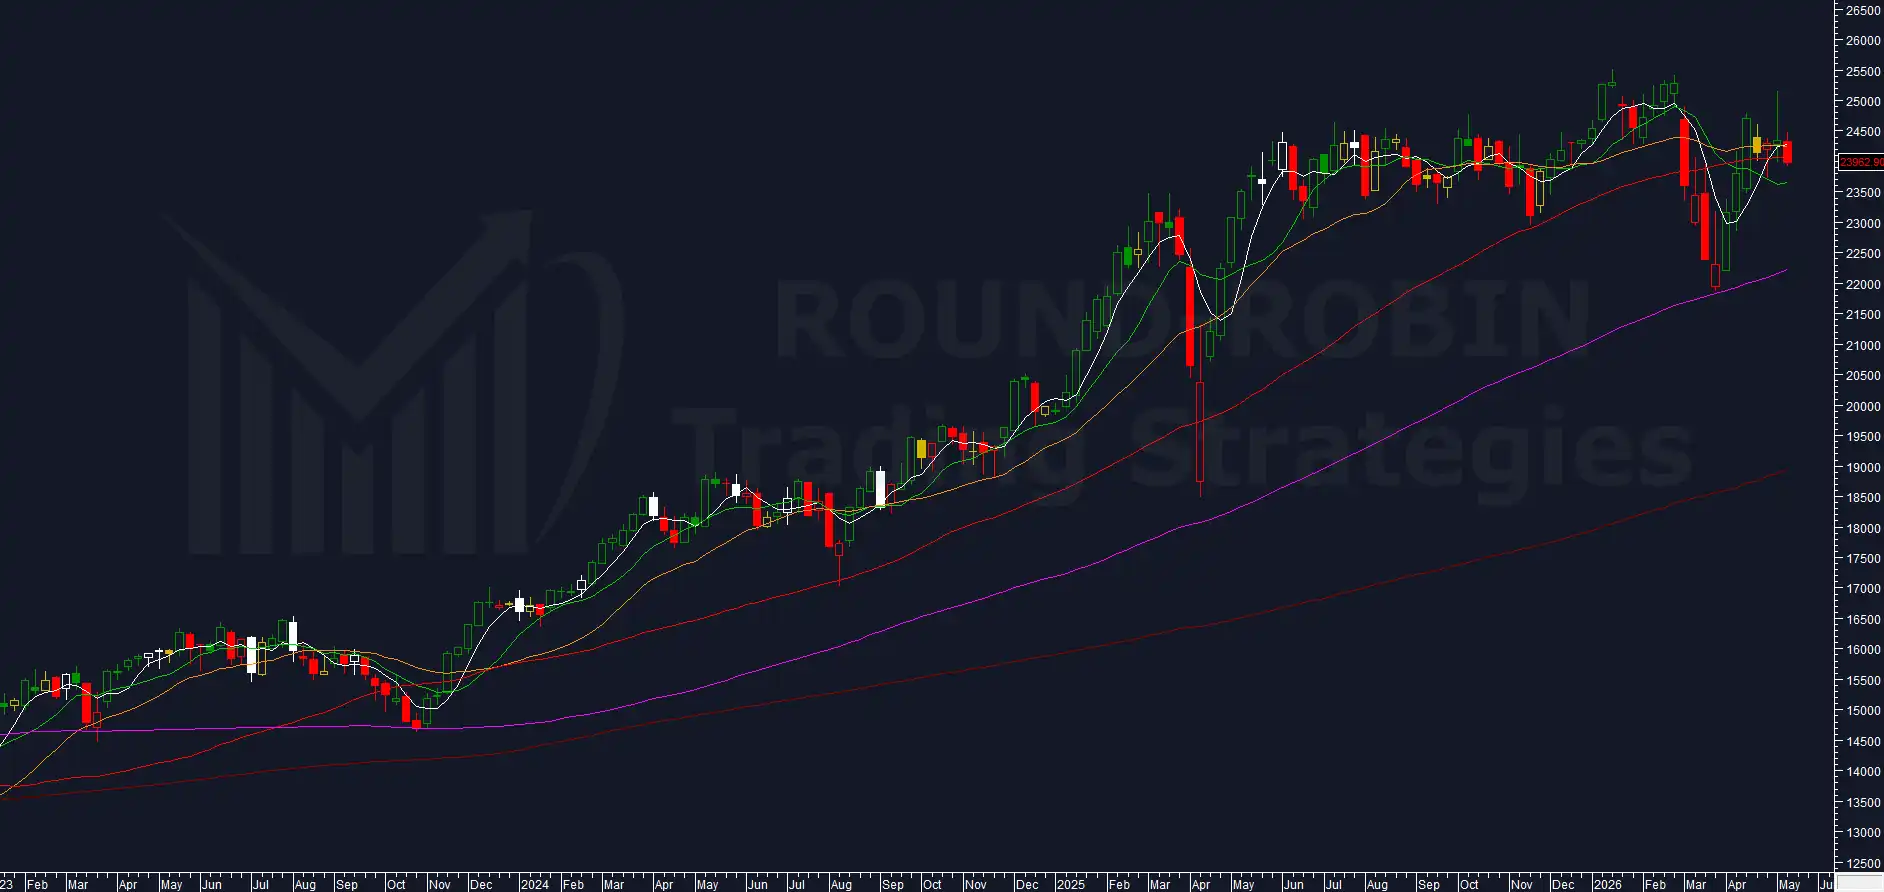
chart: DAX weekly
In last week’s Charts Flash the system was Short after the upward swing that had closed the gap down on the February 27 low. The long and pronounced upper shadow signaled a bear intervention zone of clear importance. The weekly close was 24,338.63.
This week lower highs and lower lows, with lows barely lower but still declining. Weekly close at 23,962.90 (−1.54%).
The DAX shows decidedly lower relative strength compared to the EUROSTOXX50, but like the EUROSTOXX50 it needs further confirmation to sustain the system in this bearish trade.
Key levels to watch: the MA10W and 23,500, whose break could lead to acceleration. A break above last week’s high (25,152) would instead lead to the abandonment of short positions.
⚡ NIKKEI 225
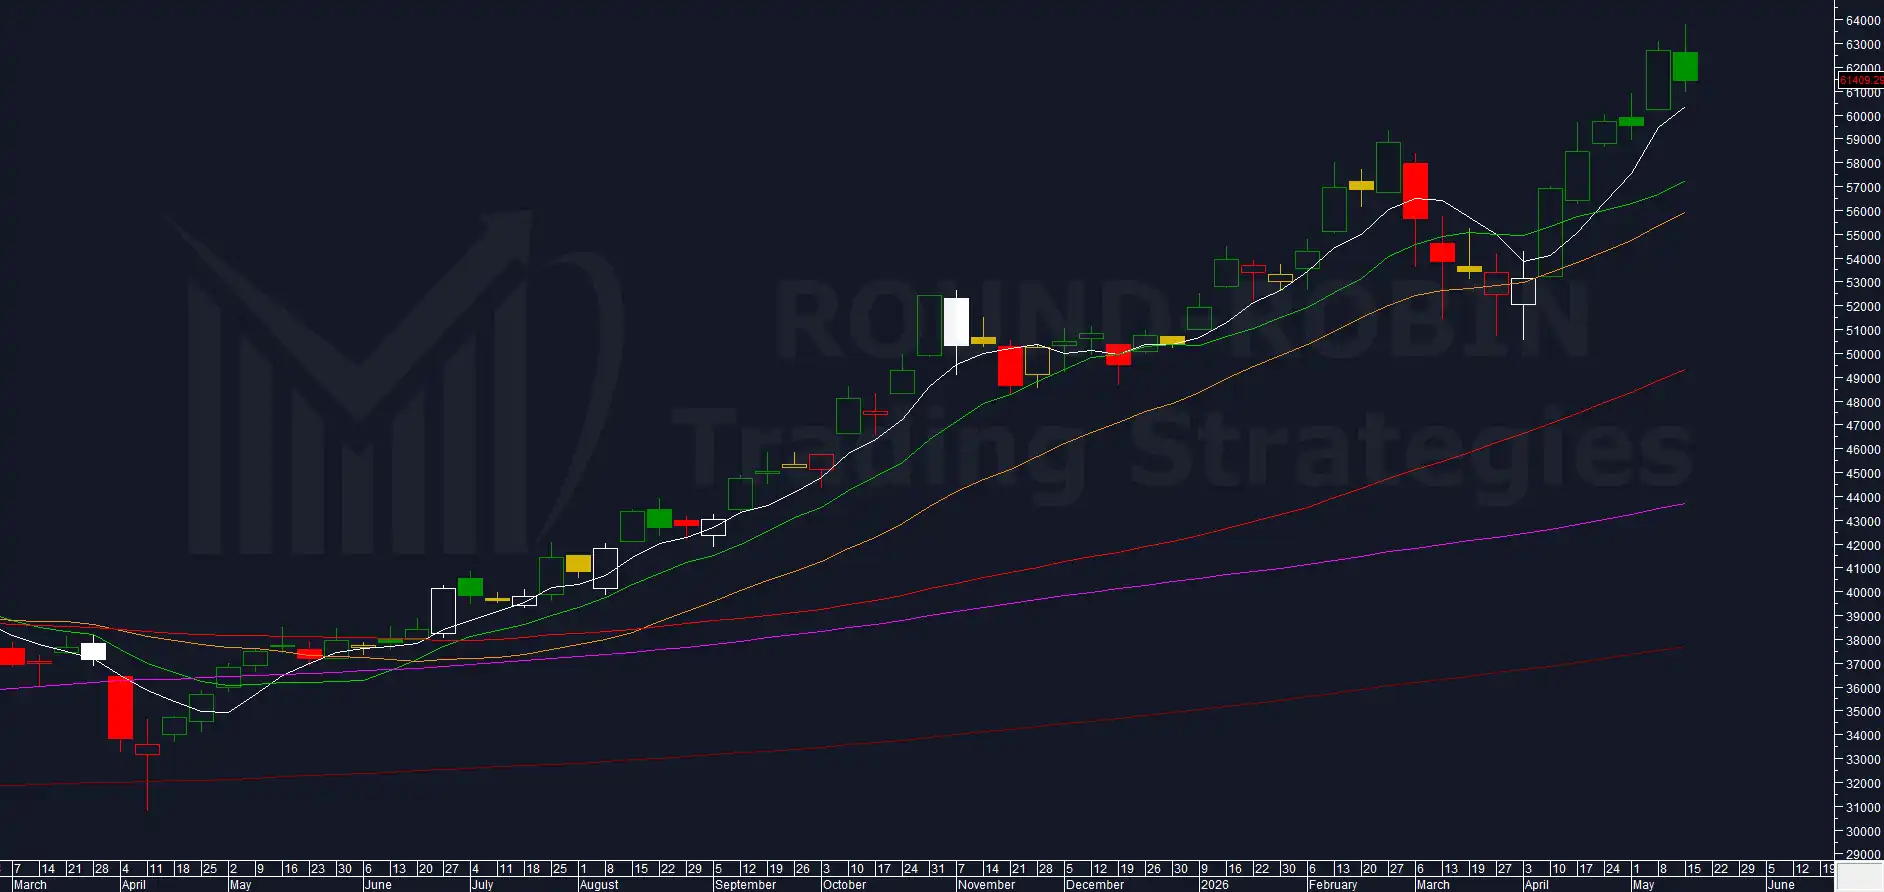
chart: NIKKEI weekly
In last week’s Charts Flash the Nikkei had posted a new all-time high at 62,713.65 with a 5.38% gain in a week shortened to two sessions. The overextension on the MA200W had reached 60.40%, above 60% for the first time. The system was close to the stop loss.
After posting the new all-time high, this week the Nikkei pulled back. Higher highs and higher lows but with close below open: the minimum condition to keep the current short from being invalidated. Weekly close at 61,409.29 (−2.08%).
Despite the negative close, the overextension on the MA5W persists. A break below it should allow at least a short-term pullback. The overextension on the MA200W reached a new all-time high at +61.57%, a value incompatible with further upside continuation.
Bear momentum is moderate but, as with the other indices, it requires immediate and decisive confirmation.
Leave a Reply