


Your weekly appointment with the world’s most followed charts.
This week we chose the Eurostoxx 50 as Chart of the Week not because it stood out particularly, but due to the lack of actionable setups from the other assets we follow. Gold and Silver stalling, DAX, FTSE MIB and S&P 500 flat.
The Eurostoxx 50 comes into play as it approaches a long signal, having shown more momentum than the DAX and stronger relative strength.
A configuration that, while not explosive, deserves a closer look.
Let’s see what the charts tell us.
Big Picture
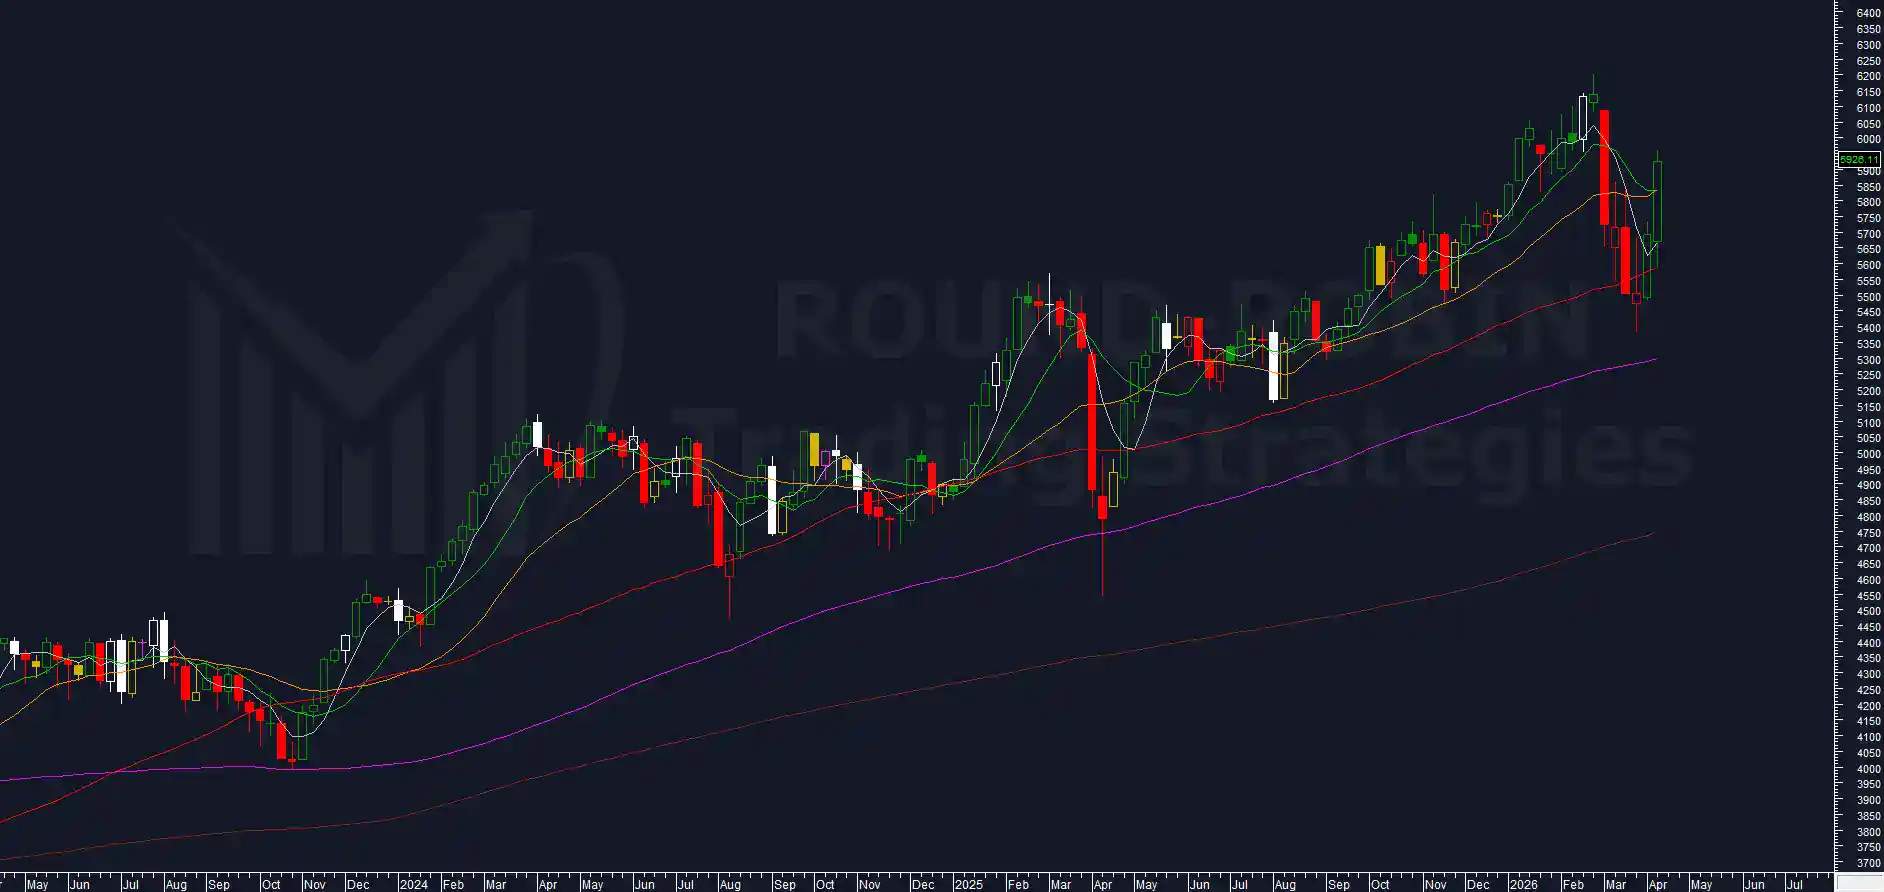
chart: Eurostoxx50 weekly
Second consecutive week with higher highs and higher lows, accompanied by a large bullish candle. After six weeks, prices have moved back above the MA20W, whose bearish break had kicked off the decline.
The weekly low at 5,589.91 nearly matched the MA50W touch (5,589.18) tick for tick. That precision is no coincidence: it confirms that buyers were positioned right at that technical level.
Prices have entered the body of the candle that triggered the selloff during the week of March 6, but remain well below the high of that candle.
Range % Weekly
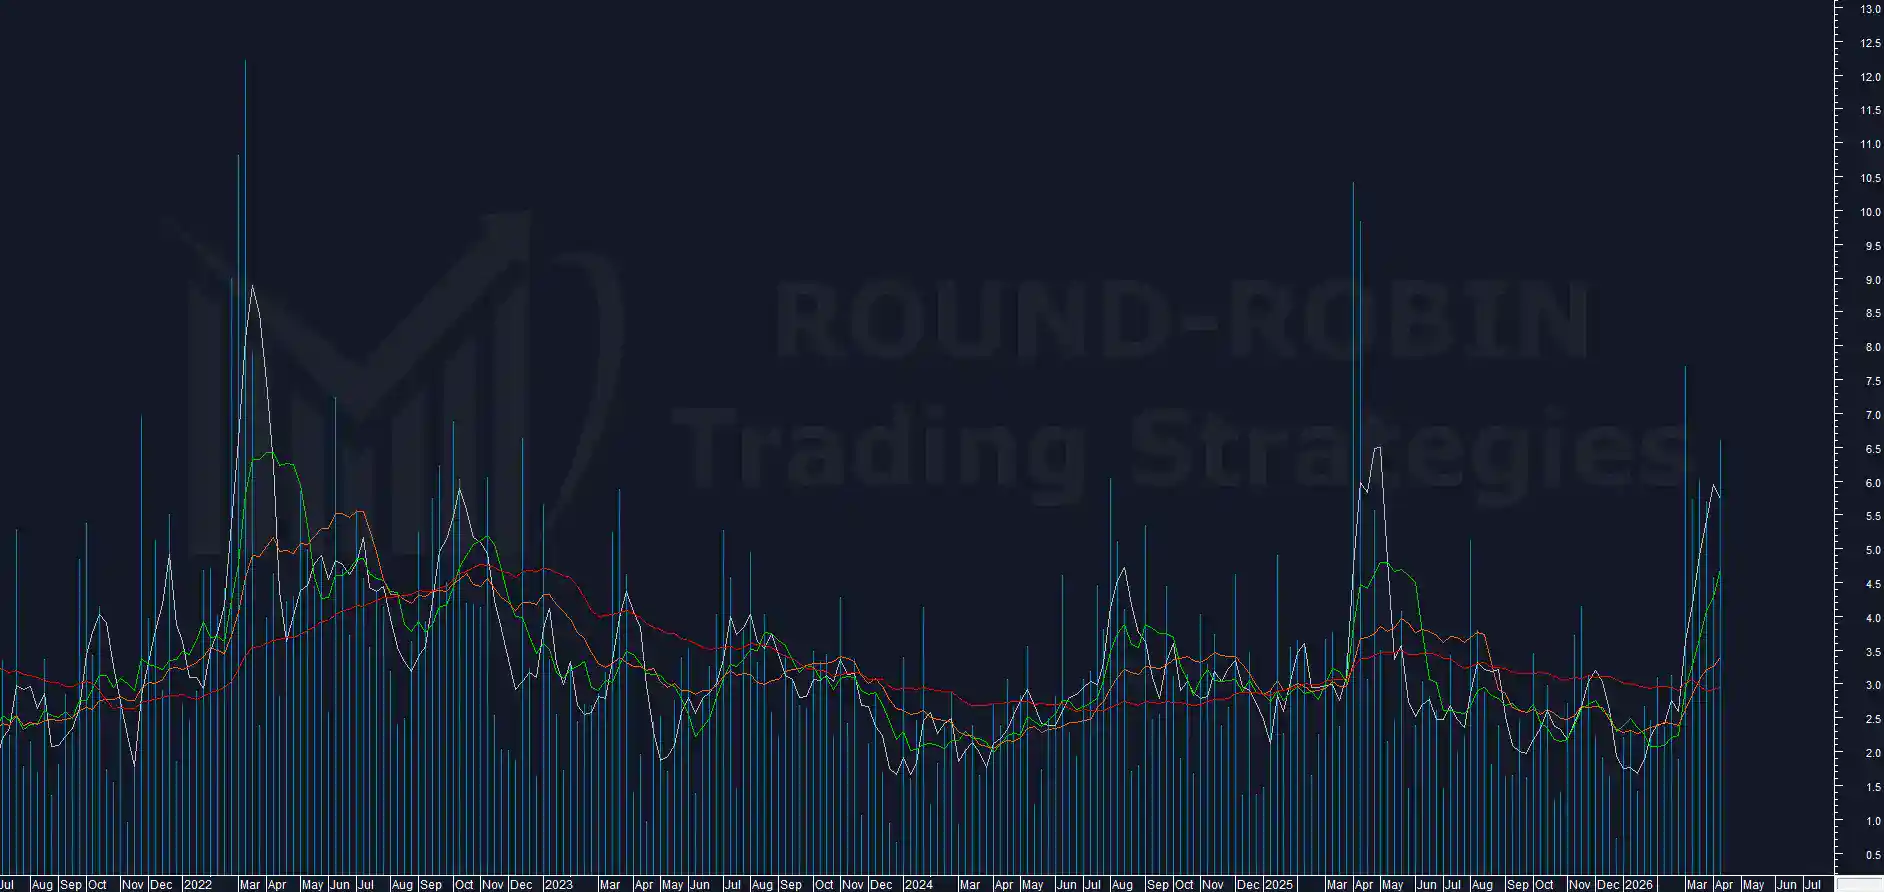
chart: EUROSTOXX 50 – range% weekly
Sixth consecutive week with a range above 4%. The MA5W of the range sits at 5.73%, hooking lower after last week’s peak.
This should be enough to see weekly oscillations gradually decrease, bringing the range back toward the 3% average. A sign that the high-volatility phase is starting to fade.
Body weekly %
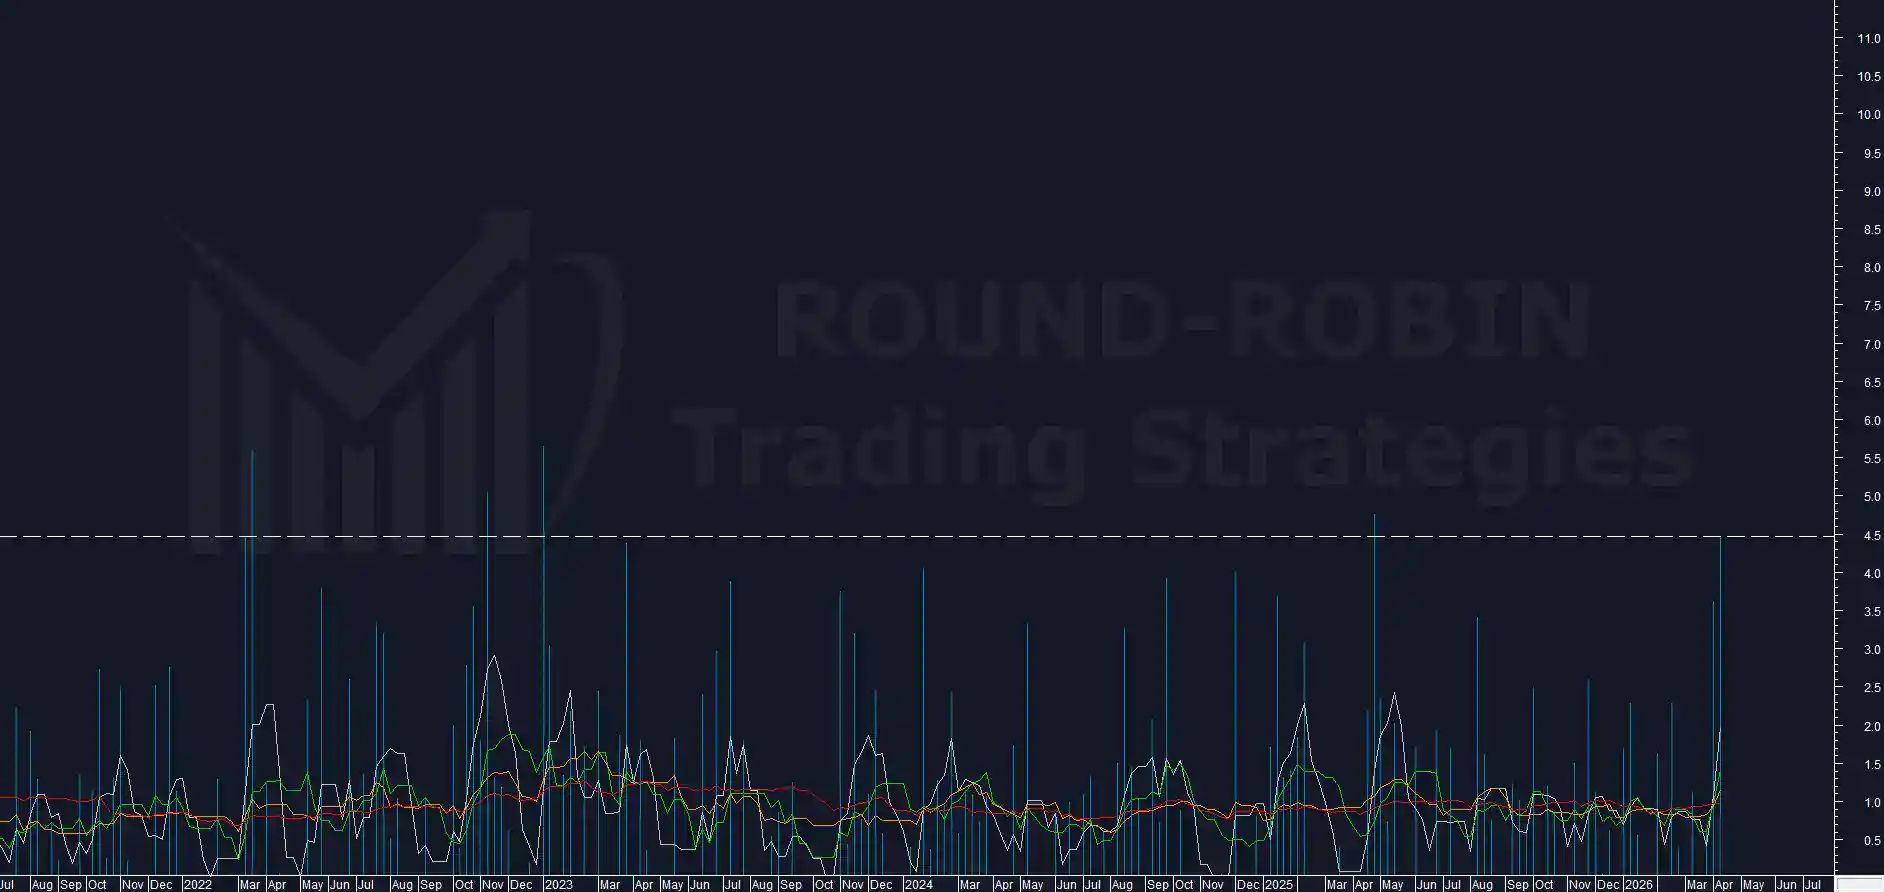
chart: EUROSTOXX50 – bullush body% weekly
The weekly candle body is very wide: 4.48%. A value that statistically tells a slightly different story compared to the other indices.
For the EUROSTOXX50, bodies this extended are in most cases a sign of continuation. They indicate that directional pressure is still present.
The market closed near the highs of the week, opening the door to trend-following setups.
BCP3
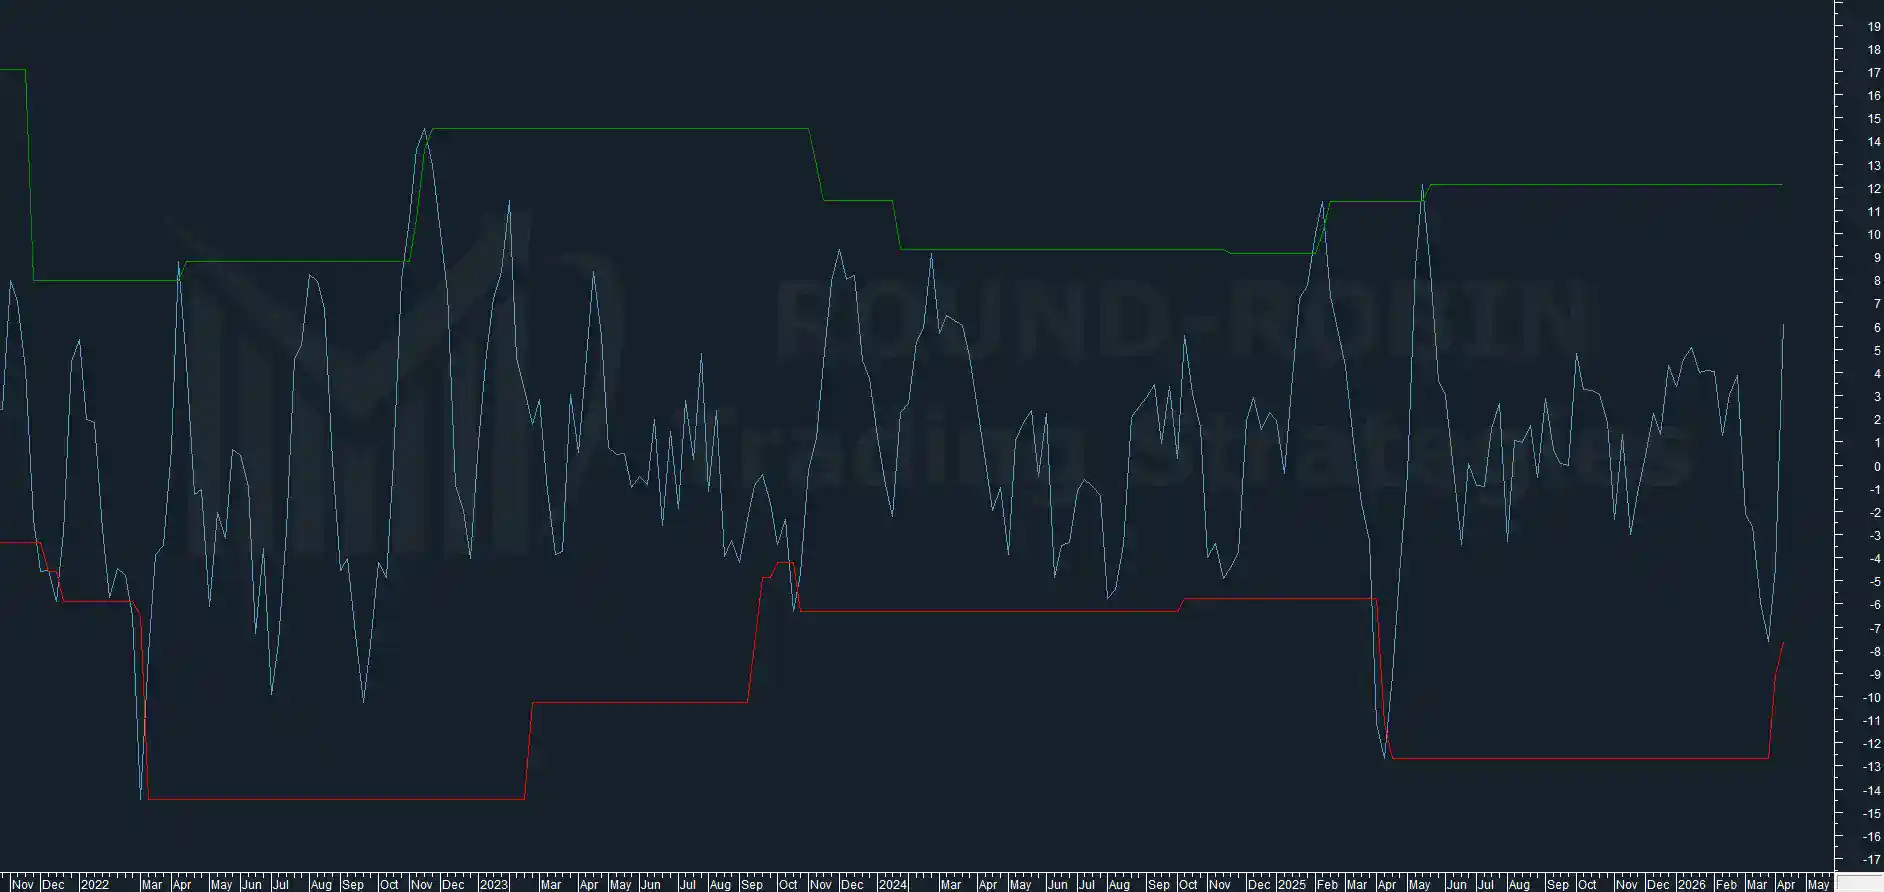
chart: EUROSTOXX50 – BCP3 weekly
The swing is already in the upper portion of the range. This advanced positioning caused the system to skip the long entry: there is room to the upside, but with a risk/reward ratio below what the system accepts.
In other words, the bullish move is already in an advanced phase relative to the expected swing amplitude.
The system acknowledges the residual potential but does not consider it sufficient to justify exposure at this point of the cycle.
Bodies Counting
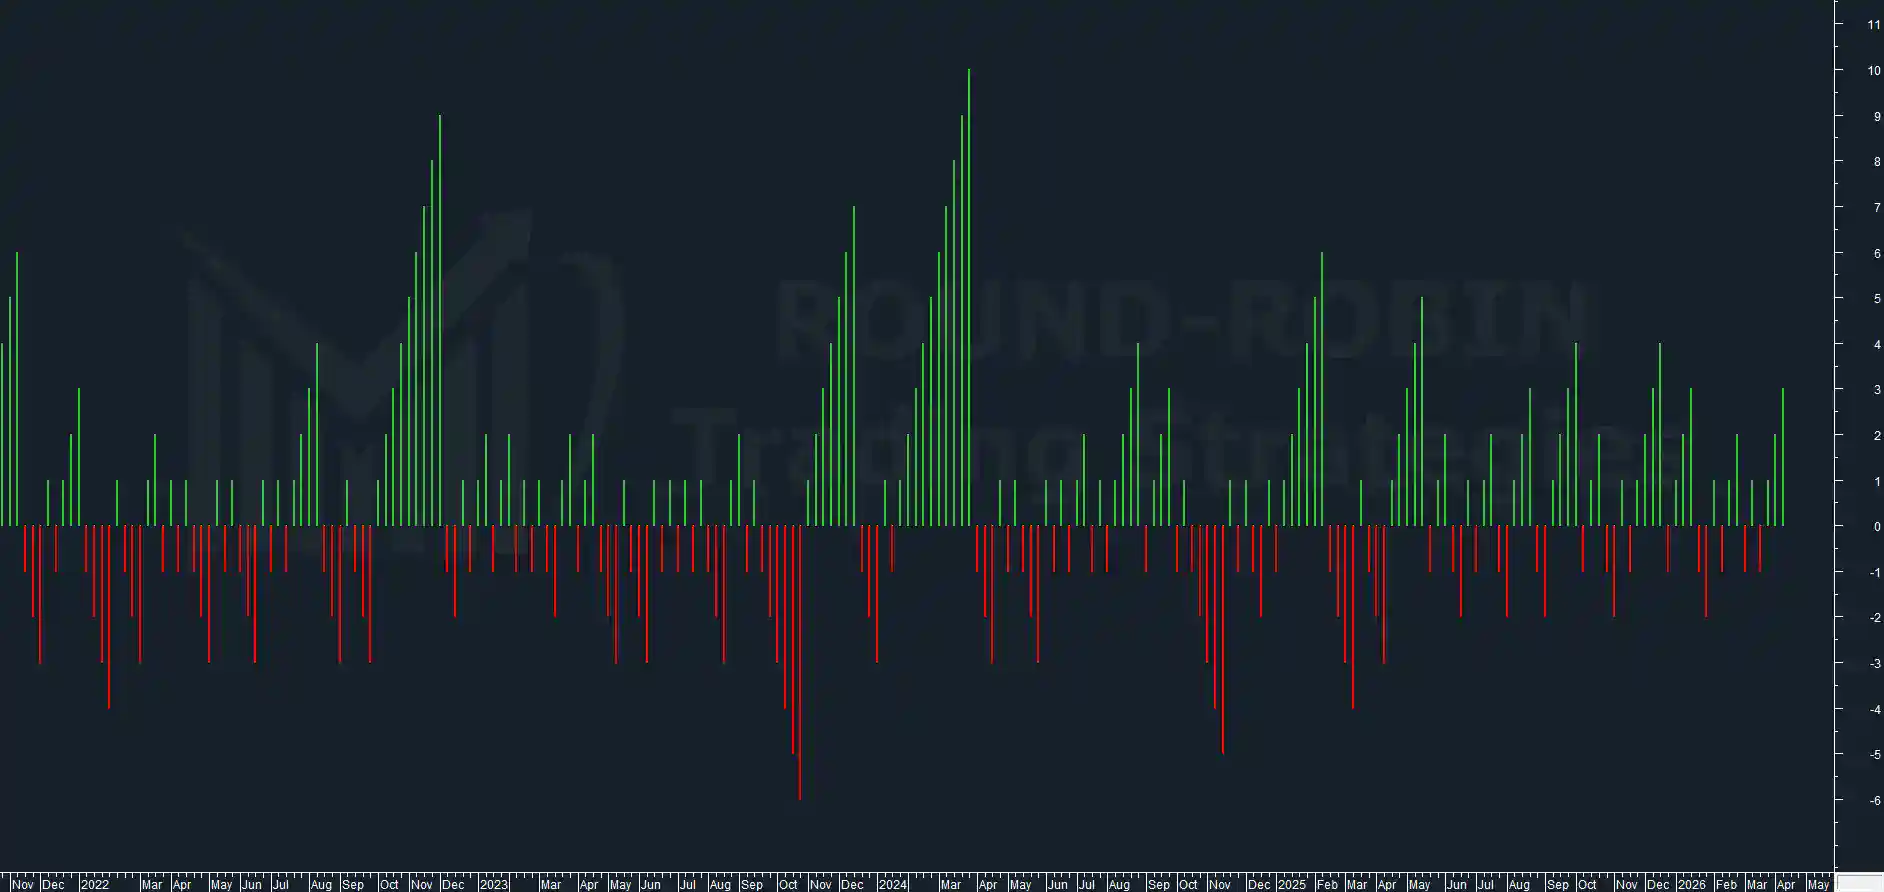
chart: EUROSTOXX50 weekly – Body Counting
Over the past year, there has been only one instance of five consecutive weeks with close above open. We are currently at three.
Putting all the information together, there could be one more, not a very extended one, before a pause.
Even a single week with close below open would be enough to reset the counter and create the conditions for a new sequence.
Close Counting
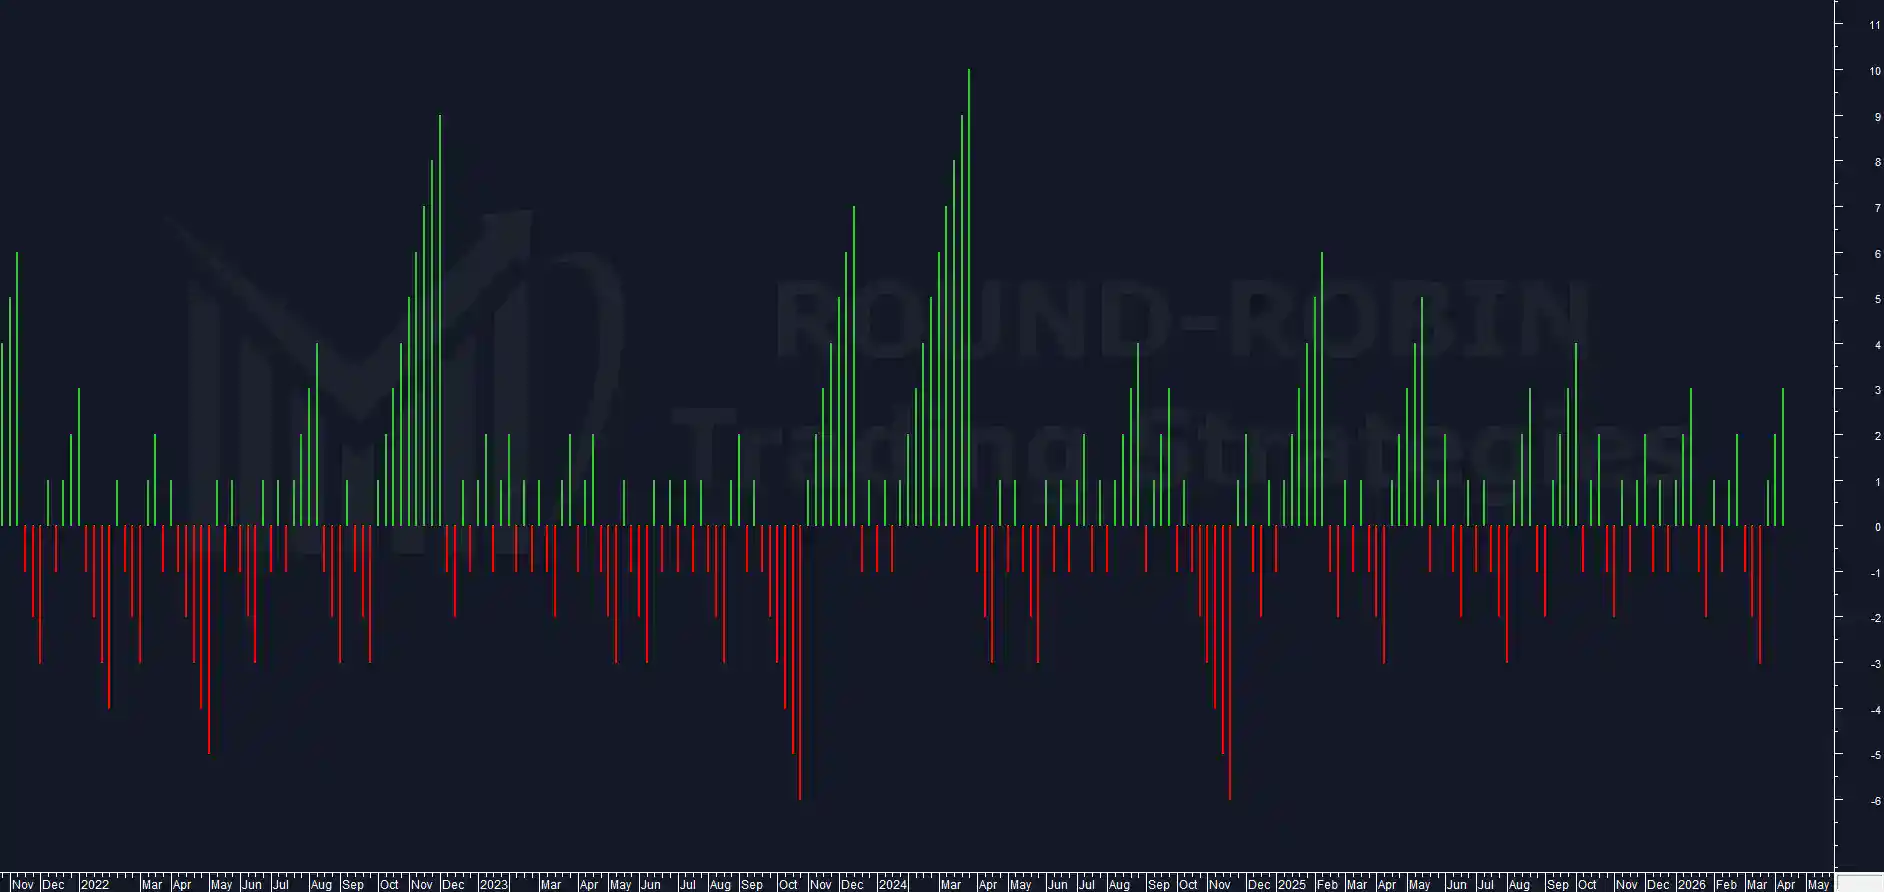
chart: EUROSTOXX50 weekly – Close Counting
The picture is similar for consecutive positive weekly closes: we are at three in a row.
Four should be a natural ceiling, considering how extended the previous ones were.
The close count confirms the body count: the bullish sequence still has a narrow margin left before a likely physiological pause.
Conclusions
As mentioned, we chose the Eurostoxx 50 for the Chart of the Week not because it stood out particularly, but due to the lack of actionable setups from the other assets we follow.
The information we can extract is still relevant: stronger relative strength compared to the DAX and a configuration with better momentum.
The excessive advancement along the expected swing amplitude prevented the long signal from being generated.
It could come in one to two weeks, in case of a controlled pullback and restart: it would therefore likely be a buy on weakness.
If instead further bullish excesses are recorded, the system will need something different before generating a signal, whether bull or bear.
Leave a Reply