Weekly appointment with the world’s most watched charts.
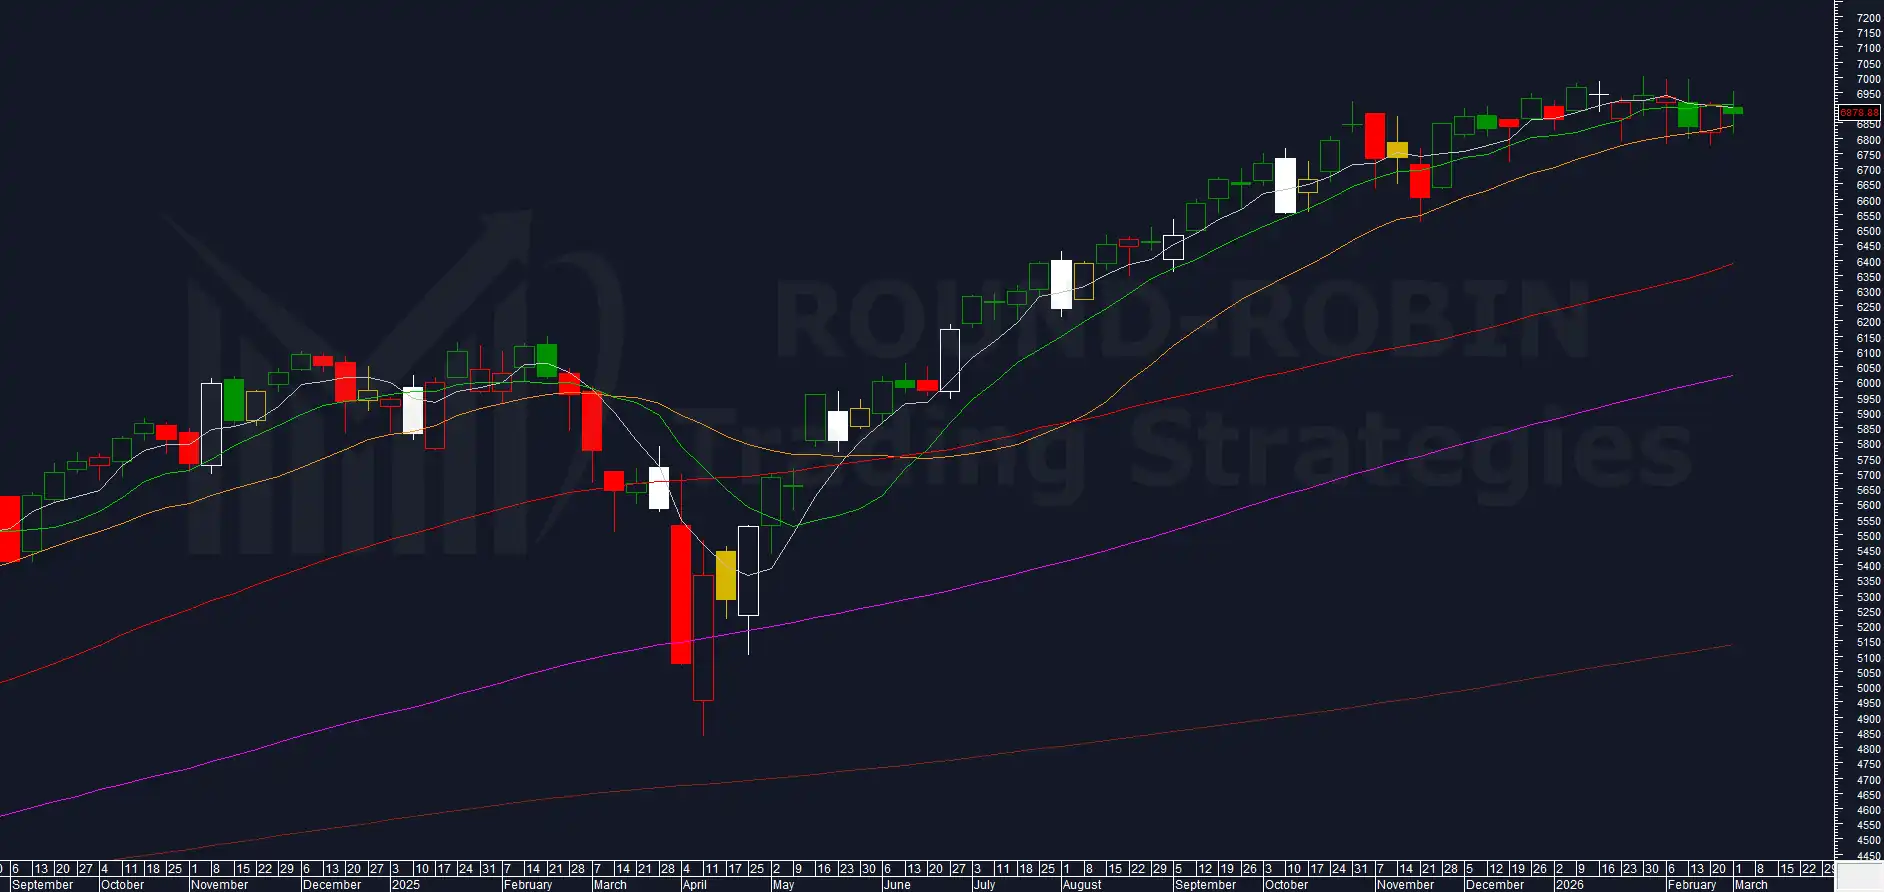
After weeks of testing, retesting, and holding, the MA20W finally gave way. The S&P 500 closed at 6,740.02, more than 100 points below the MA20W. The entire candle body sits under it. Since our first S&P 500 Chart of the Week in W02, we defined two conditions for a bearish trigger: a weekly close below the MA20W and a clear price signal. Both are now met.
The volatility indicator reacted sharply from its historical floor. The fear indicator jumped to 85%. Bears dominate the weekly reading nearly 2.6 to 1.
The framework spoke. Let’s read it.