


Weekly tracking of the Italian benchmark index.
Why do we do this? Check out our strategy page.
My proprietary DBBT indicator identifies misalignments between current price and expected technical levels on major indices.
Every week, we put the FTSE MIB in our crosshairs.
The hunt is on.
Let’s pick up from where we left off. We had all the elements to go short – at the very least to close the fourth common gap that had formed over the past three months. No need to overcomplicate things: the setup was there.
Fortune smiled on us. Not only was the gap filled – the market extended brutally to the downside.
Bulls vs Bears
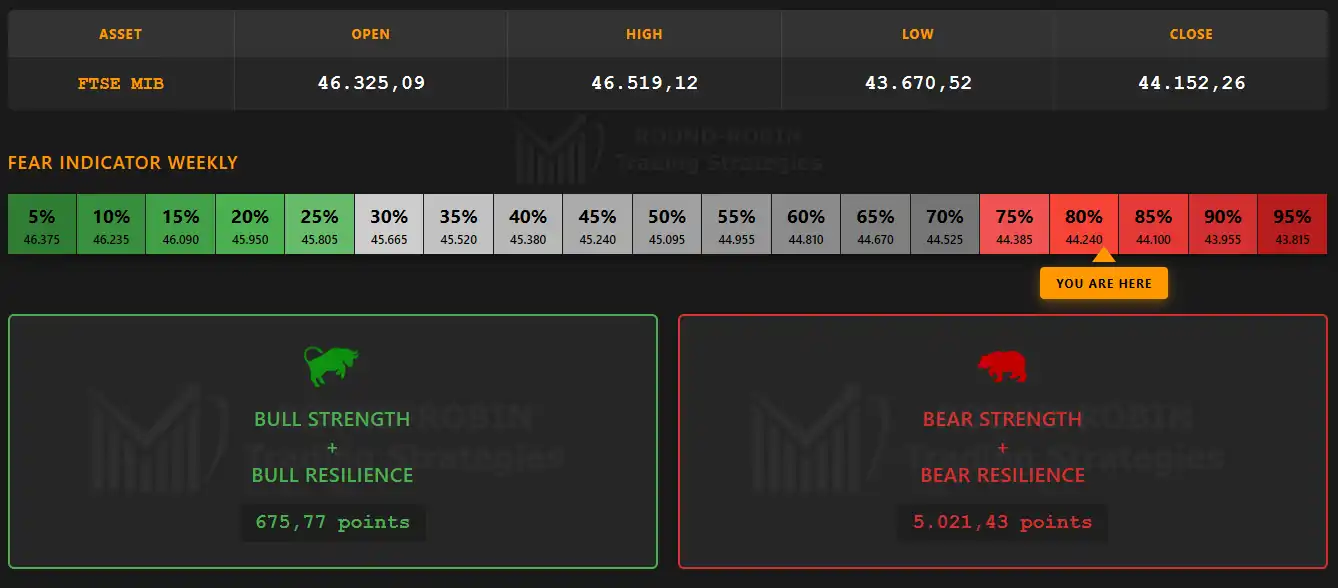
infographic: FTSE MIB weekly – Bulls vs Bears
The Italian index closes at 44,152.26, down -6.48% from last week – a week completely dominated by the bears, with more than 5,000 points collected. The intraweek low reached 43,670.52, giving a sense of how far the selling extended.
The fear is real. The geopolitical situation certainly plays its part, but it was already in the numbers.
At 80%, fear is high but not at its highest. That means there are still bulls out there who believe this is nothing more than a simple correction.
The Big Picture
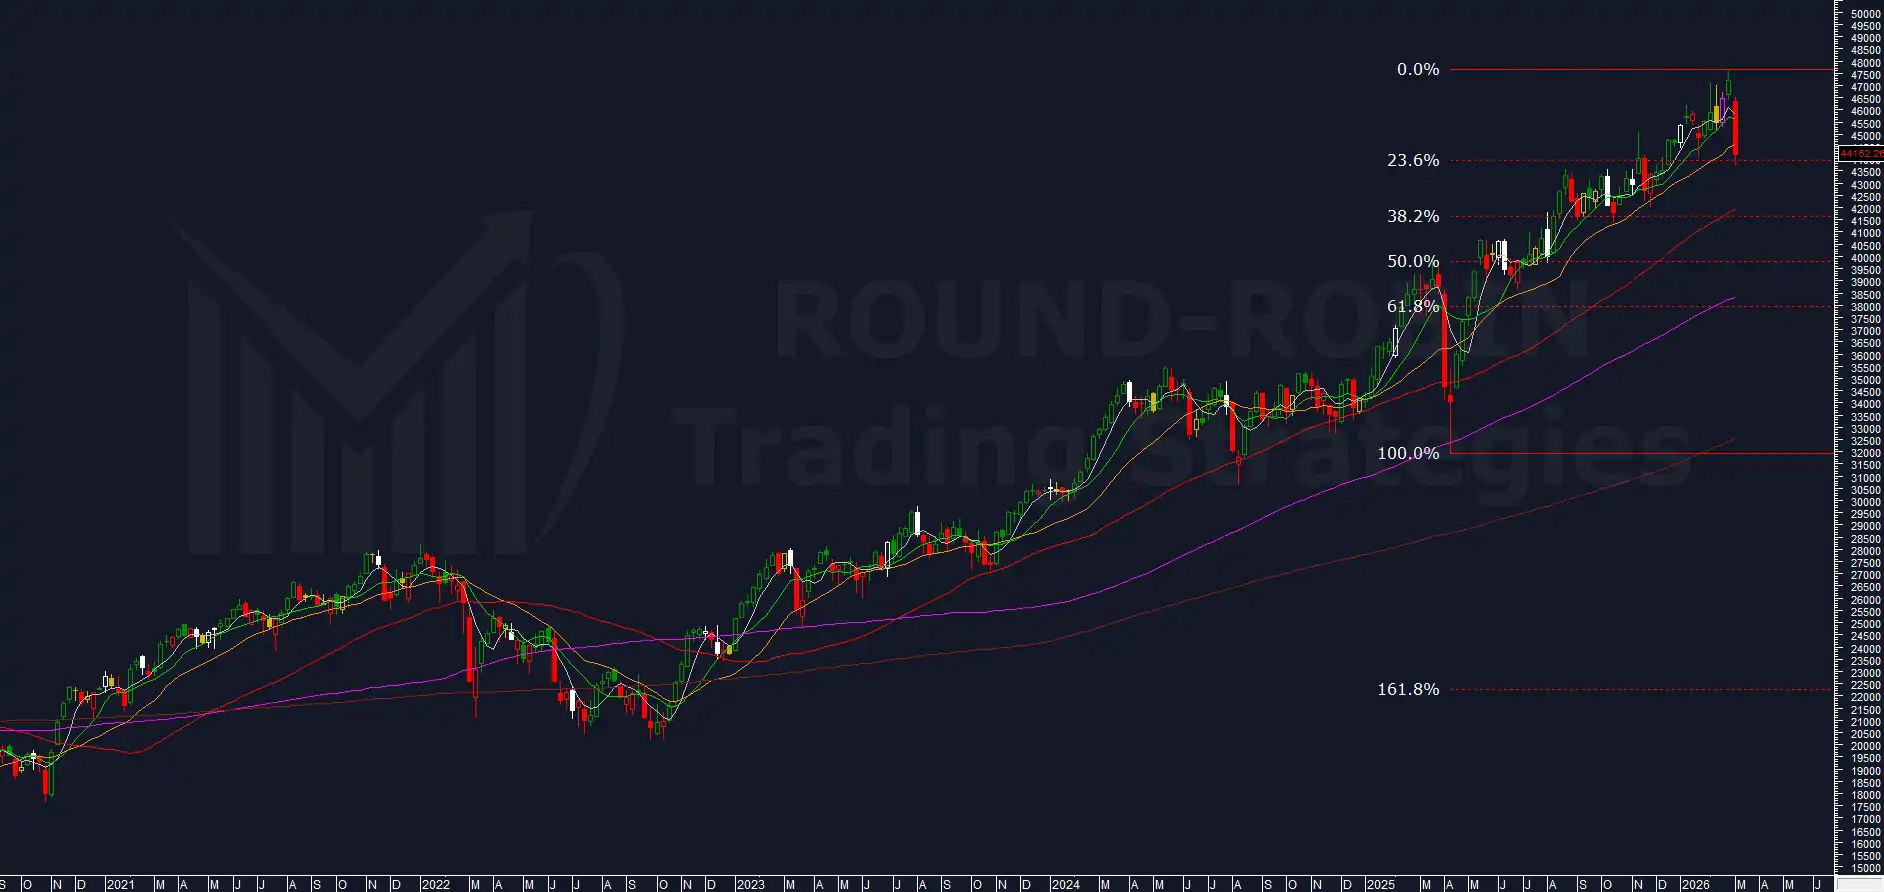
chart: FTSE MIB weekly
The psychological and price impact has arrived: a large red candle that also breaks the MA20W to the downside – a moving average that seemed unreachable just seven days ago.
However, the excesses had been so extreme that only the MA5W has meaningfully changed its slope. No bearish cross has occurred yet.
Given the size and strength of the move, the minimum target is the 42,000 area, where the MA50W is approaching and where the 38.2% Fibonacci retracement of the entire bullish leg from April 2025 also sits.
To aim for the MA100W, reinforcing signals would be needed.
Volatility Indicator
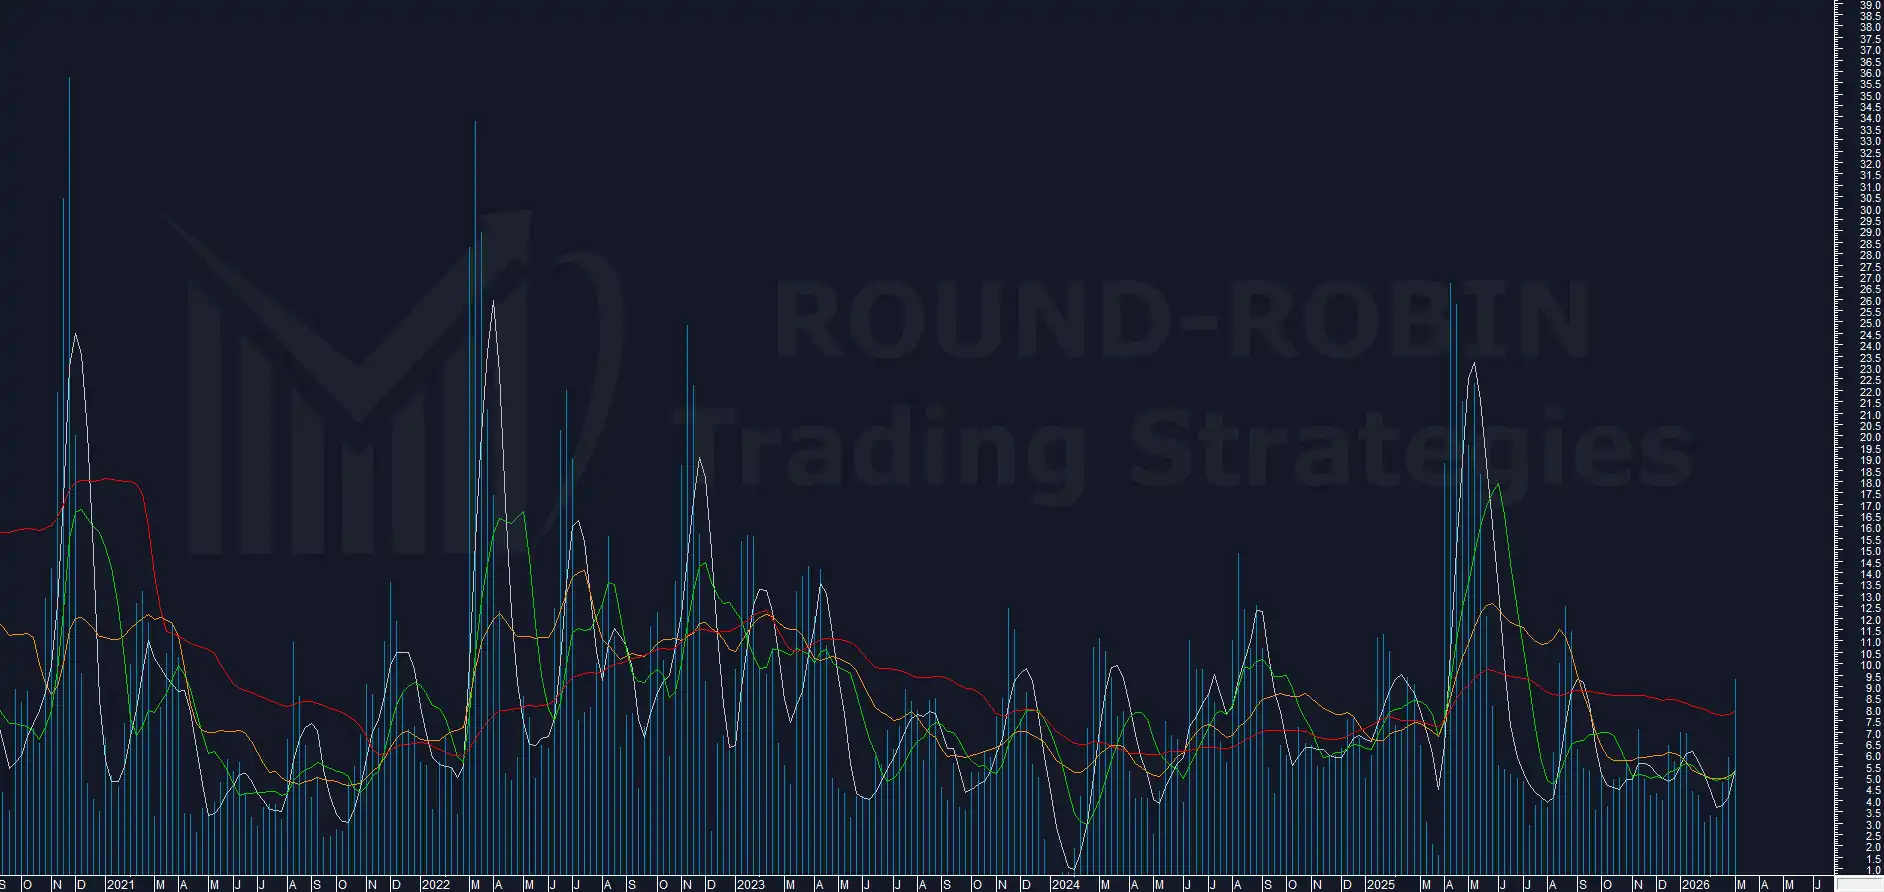
chart: FTSE MIB proprietary Volatility Indicator
Our proprietary volatility indicator not only confirmed what it showed last week – it extended further, surpassing its own MA50W. This provides additional confirmation for a bearish short-to-medium term outlook.
This week’s reading: 9.35%.
For additional context: this week’s range of 6.52% is the highest since March 2025. In 2024, it was exceeded only twice – the week of August 2nd (6.75%) and June 14th (6.66%).
RSI
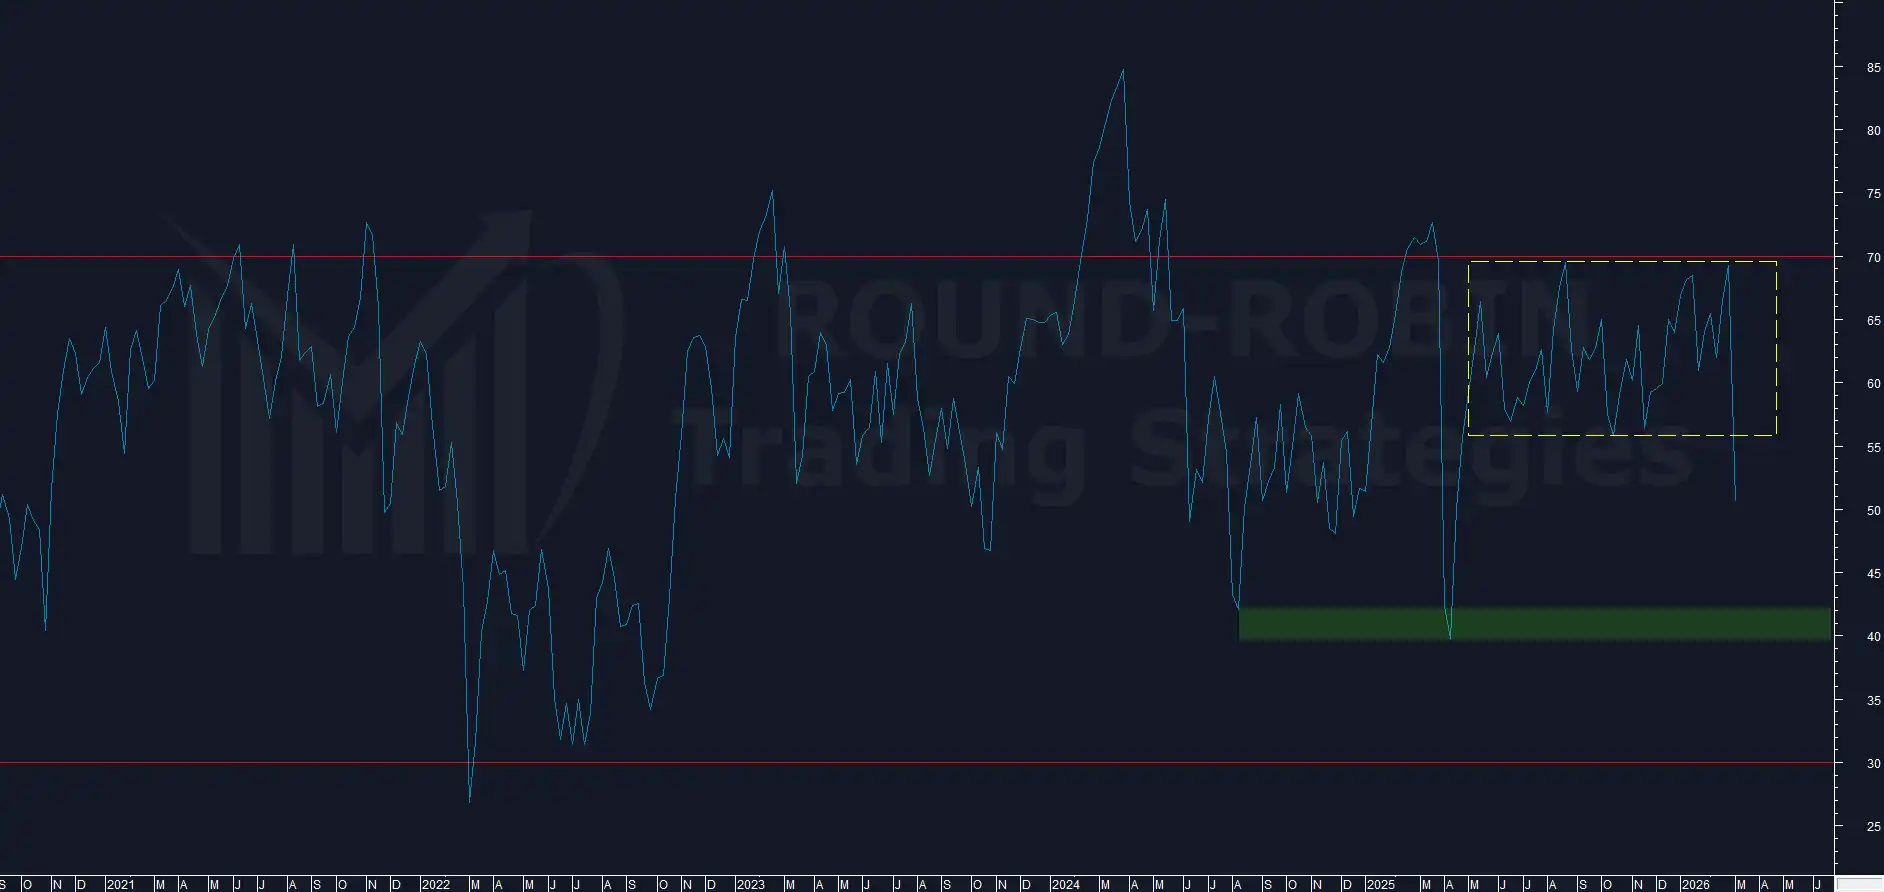
charts: FTSE MIB – RSI weekly
RSI this week at 50.65.
The expectation is that what we’ve seen over the past 12 months repeats itself. RSI has broken below the consolidation box it had been trading in since May 2025, and should now be heading toward the 40-42 area.
This target doesn’t necessarily mean the very short-term downtrend will continue uninterrupted, but historically it tends to indicate a bearish or neutral-to-bearish environment.
Strategy Update
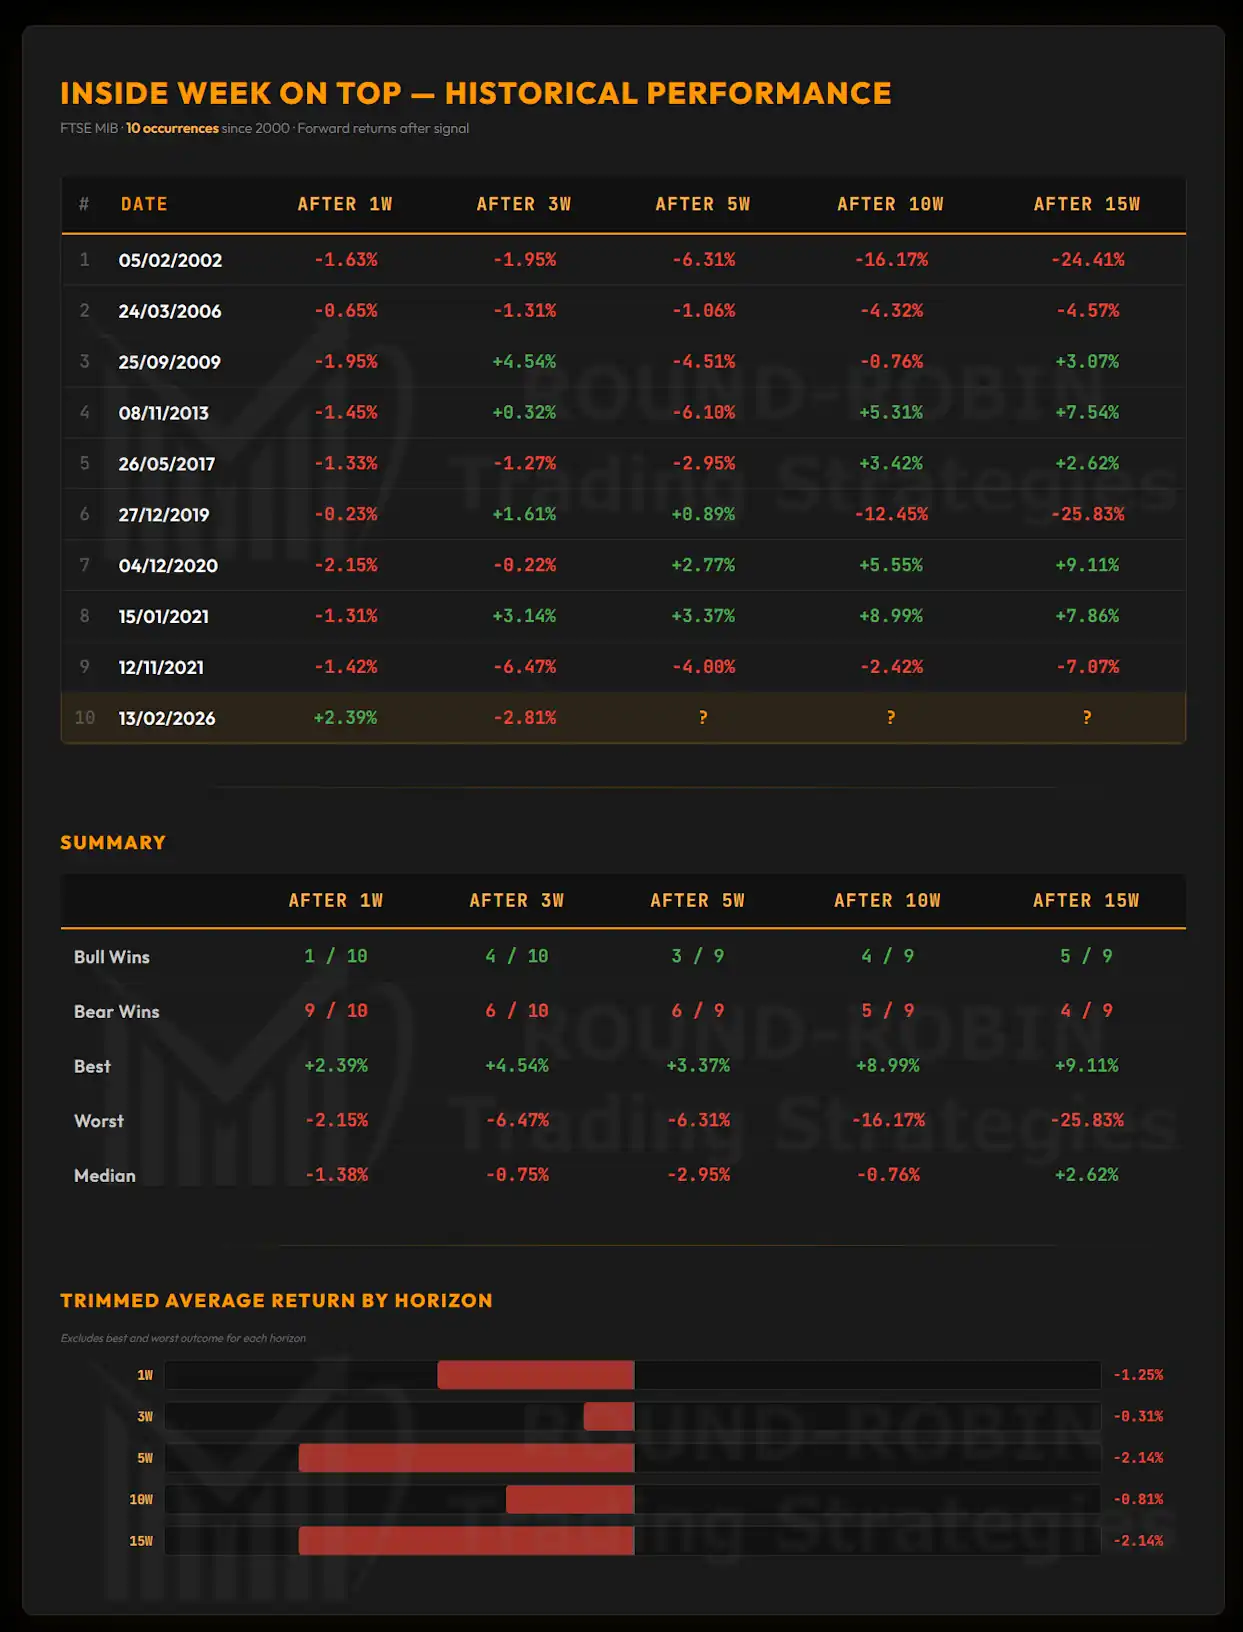
infographic: FTSE MIB Inside Week on TOP pattern
Three weeks ago we presented an edge case study on inside candles on top. At the time of its introduction the pattern was 9 out of 9 bearish at 1 week, and showed strong follow-through over 5 weeks.
The first week delivered an unexpected bull victory. Three weeks in, that victory looks ephemeral. The bears appear to have taken control.
As a reminder: since October 2025 the FTSE MIB has not posted two consecutive negative weekly closes, nor two consecutive weeks with close below open. Another symptom of complacency that can fuel deeper corrections.
Daily
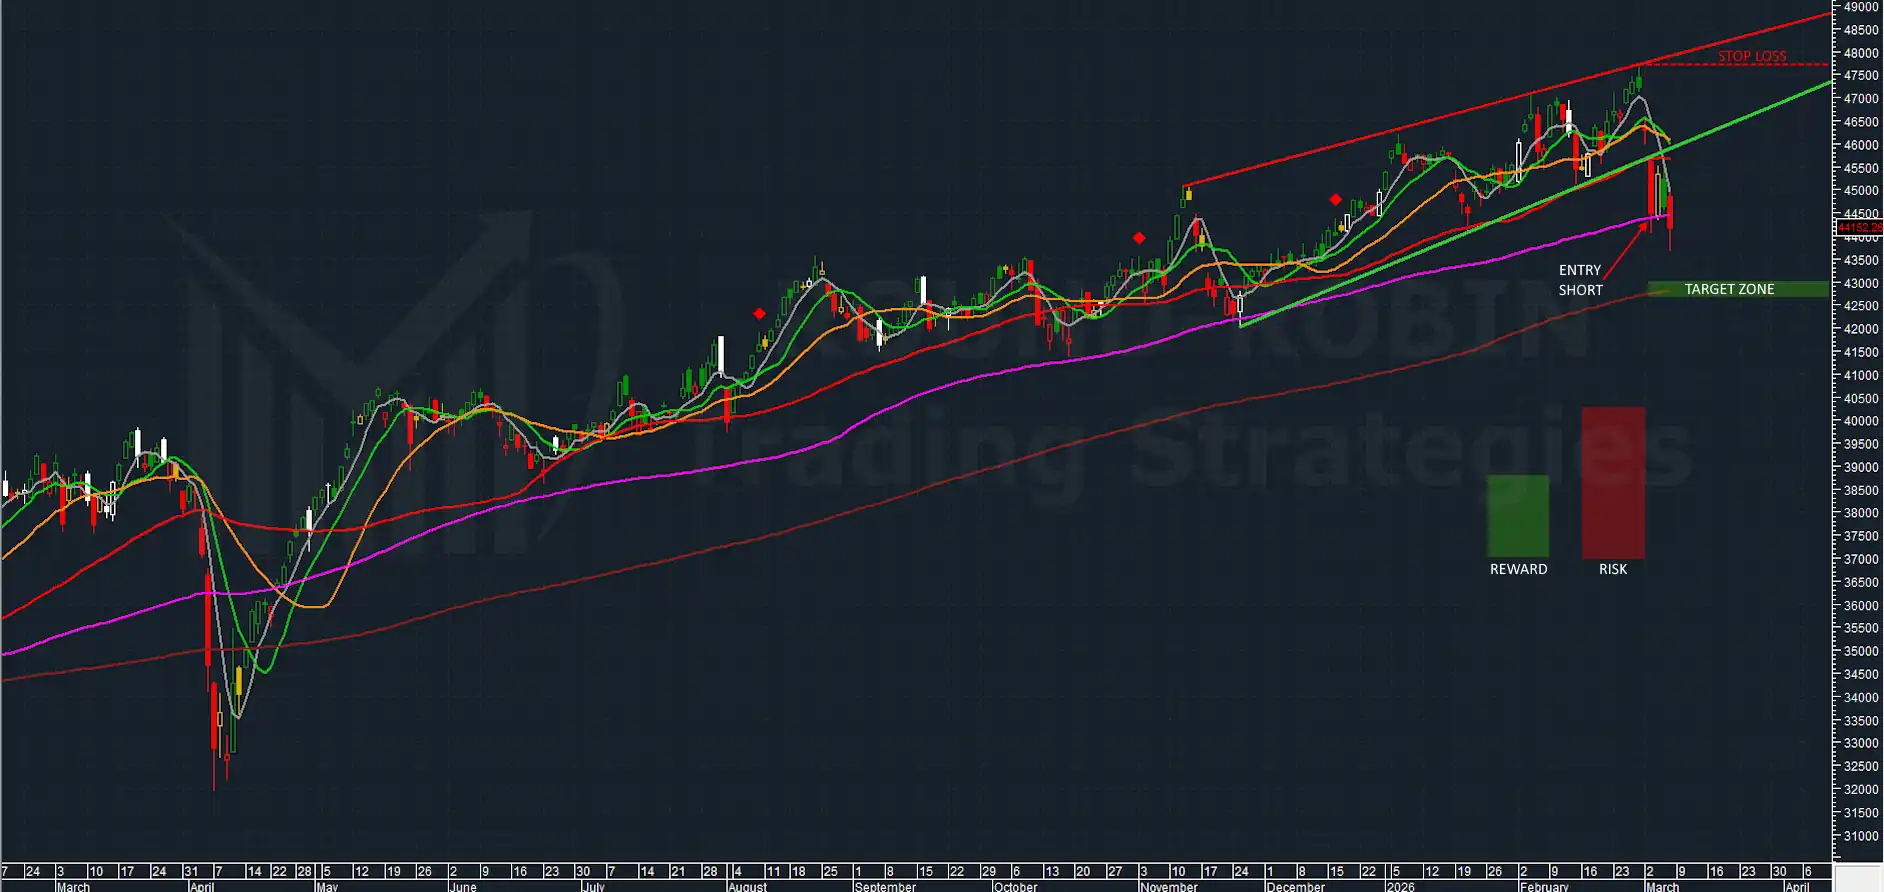
chart: FTSE MIB daily
We close with the daily chart, purely for educational purposes. A clear disclaimer: we never use the break of the lower boundary of a rising wedge for systematic trading. What follows is exclusively a didactic exercise, continuing what we showed in Pattern Spotted.
The rising wedge was broken violently to the downside on Tuesday March 3rd with a gap down. The following day already saw a pullback attempt that, on the surface, appears to have succeeded.
The breakdown was preceded by two gap downs. These are not easy gaps to classify – particularly Monday’s – but a break of the MA50 and an initial break of the MA100 could qualify them as breakaway gaps, allowing the rising wedge to be on the right side of history for once – much like a broken clock.
For those following the exercise: the pattern’s target sits in the 42,500-43,000 area. A simulated short entry at 44,468.46 with a stop loss at 47,650.97 yields a reward-to-risk ratio of 0.62 – you risk 3,182 points to gain 1,968, or 1.62 for every 1 you stand to gain. This is yet another reason why this setup should not be considered for actual trading. We track it here solely to observe how the pattern behaves in the wild.
Conclusion
The Italian index FTSE MIB has begun its anticipated correction. A correction that very likely still has room to run, and that will test the convictions of many.
At this point it is important to distinguish between two separate frameworks that coexist in our analysis.
Short-to-medium term trading view: based on the technical indicators reviewed above – volatility expansion, RSI trajectory, gap dynamics, moving average levels – we remain bearish with a target of 42,000. This is a tactical position with a defined target and will be managed accordingly.
DBBT structural position: this is an entirely different trade. The DBBT identifies a ~30% misalignment between current price and expected technical levels. The target area sits around 32,500. Every time a meaningful bearish move begins, we must consider the possibility that it could be the one that resolves this misalignment. If it isn’t, the position results in either a loss or a partial gain – but it does not get closed simply because the market bounces. Even a 5% rebound does not change its nature. We don’t know in advance which correction will be the decisive one. We only know the misalignment exists and that historically it has always been reabsorbed.
Two different approaches, two different risk profiles, two different time horizons – and crucially, different financial exposure. The DBBT position carries a significantly smaller size, consistent with a strategy whose annual probability of success is below 15% but whose payoff, if it occurs, is asymmetric. Understanding this distinction is essential to following our analysis correctly.
Soon only members will access this content. Subscribe free.
Leave a Reply