


Weekly tracking of Italy’s benchmark index.
Why we do this? Check our strategy page.
My proprietary DBBT indicator identifies misalignments between current price and expected technical level across major indices.
Each week, we put the FTSE MIB in our crosshairs.
The hunt is on.
The compression phase on the FTSE MIB continues.
Historical extremes from edge cases pointed to a highly probable negative weekly close which never materialized.
Bulls vs Bears
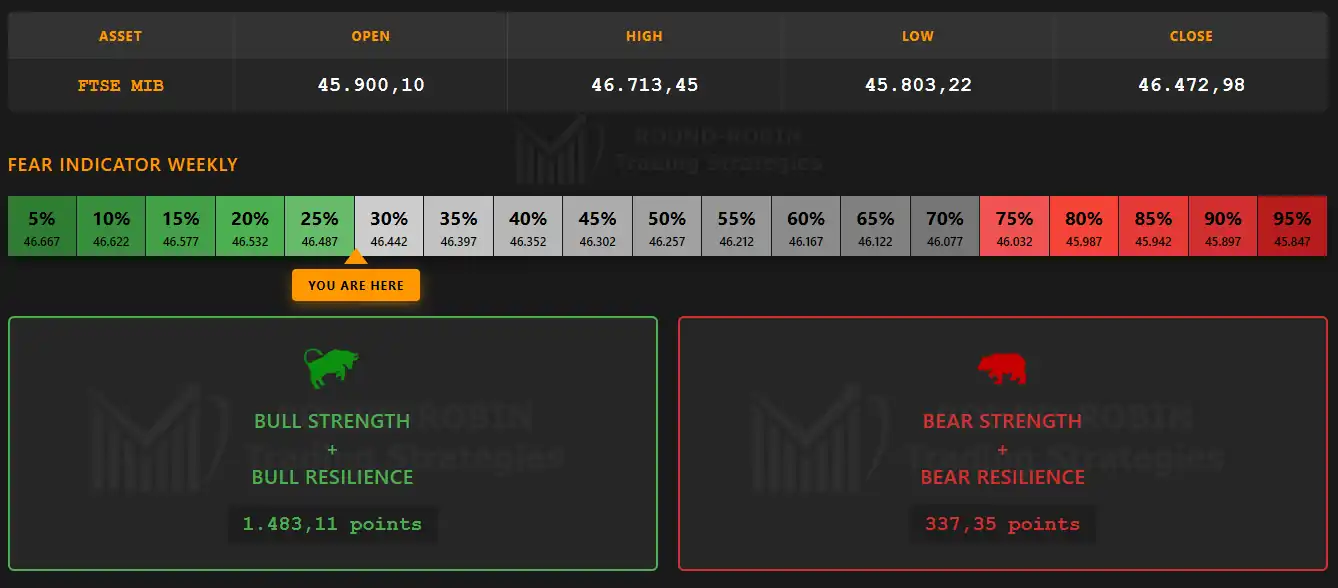
infographic: FTSE MIB weekly – Bulls vs Bears
Bulls win with Friday the 20th closing at 46,472.98 marking an +2,29% gain over the previous week. Bears basically absent.
Weekly Chart
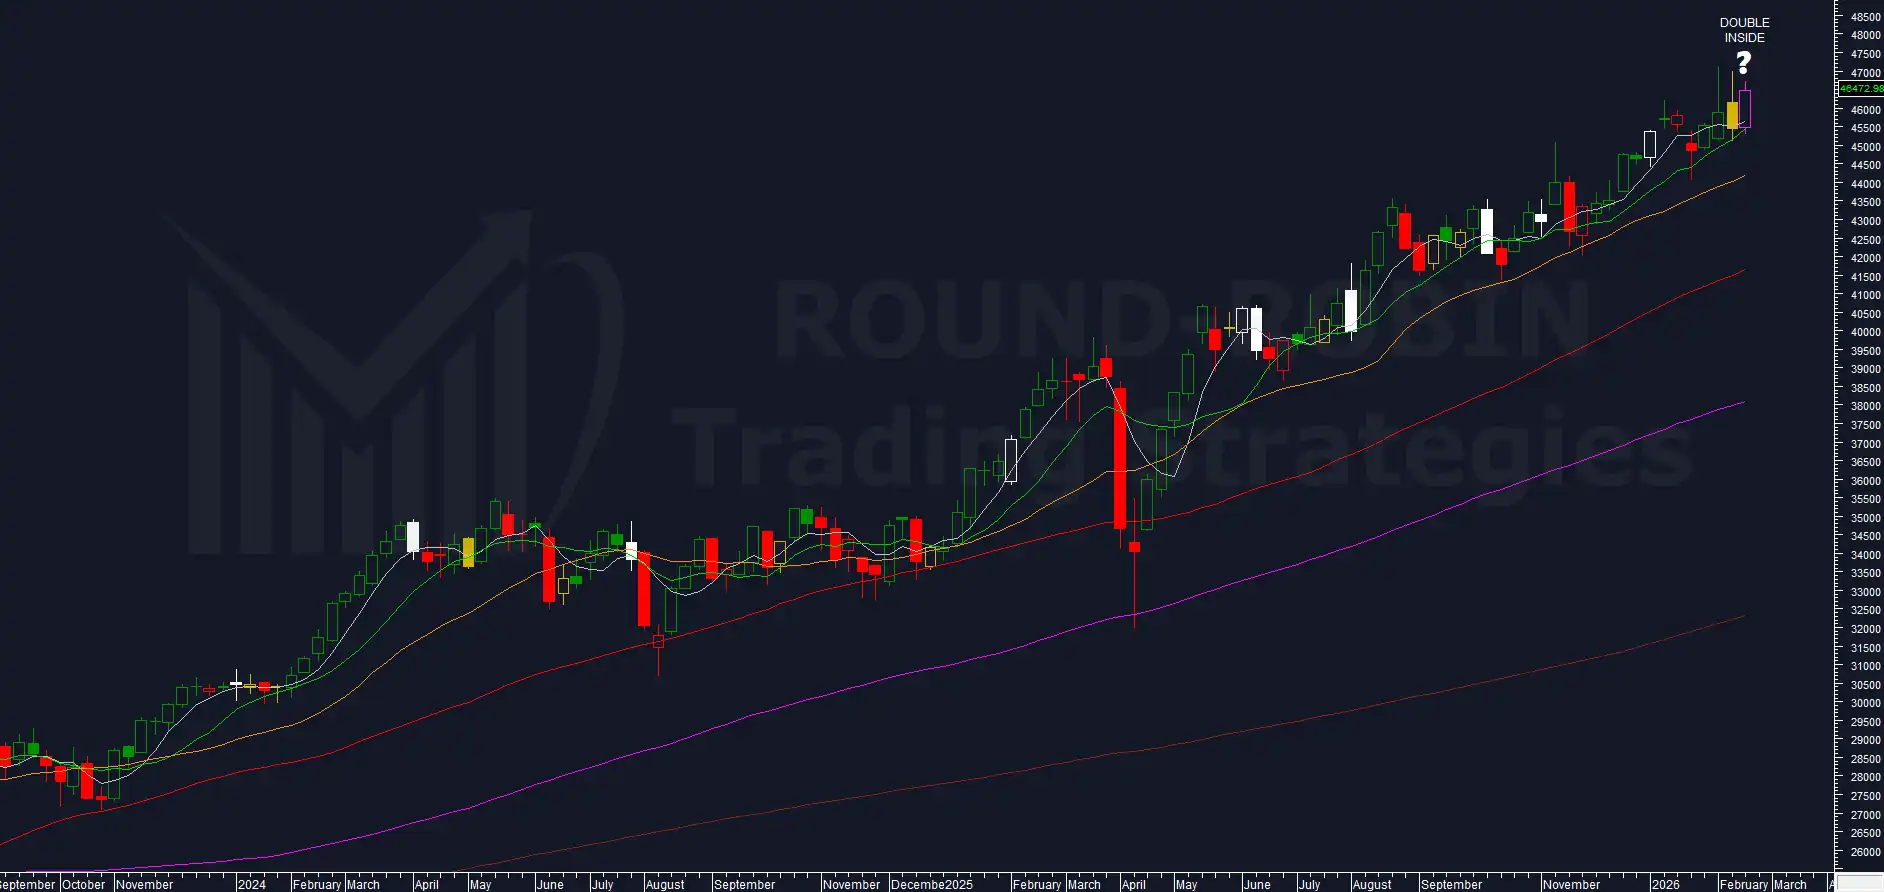
chart: FTSE MIB weekly
The weekly hasn’t changed and there’s really nothing else to infer: prices above all moving averages, all MAs positively sloped and properly ordered confirming the bull trend from the fastest (MA5W) to the slowest (MA200W).
The chart even shows an inside of inside weekly candle, and it’s clearly visible how prices failed to push beyond the upper shadows of the 2 previous weeks.
A positive note, though not a true price signal, comes from a new closing high since 2001.
Important: this does not mean, as some believe, that the Italian stock market hasn’t risen in 25 years.
The FTSE MIB index is calculated net of dividend distributions.
To understand how much the Italian stock market has actually grown, one should look at the FTSE MIB Total Return index, which sits at all-time highs.
Volatility Indicator
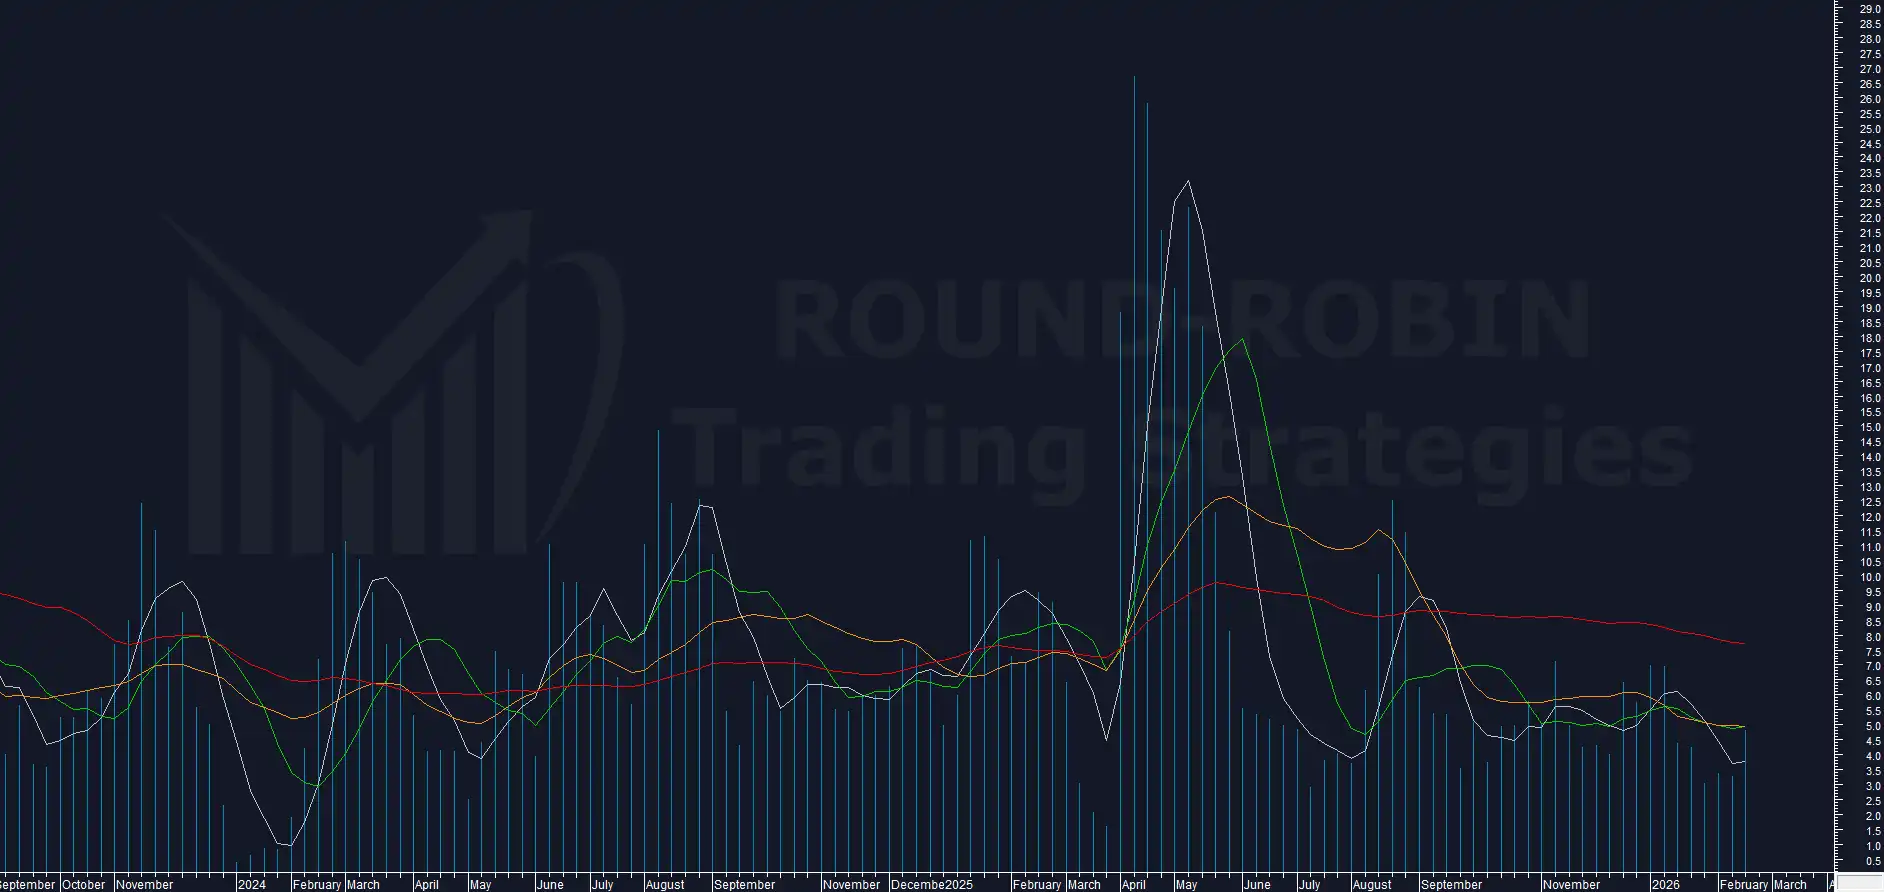
chart: FTSE MIB proprietary Volatility Indicator weekly
Our proprietary indicator, as we had anticipated, has been stuck for 6 weeks now.
Once again this week it provides no meaningful signal: neither a further increase in compression nor an attempt at an explosion.
While it still carries the same message (“volatility explosion imminent”) it needs support from other indicators because at this point it’s not reliable on timing.
Weekly Range %
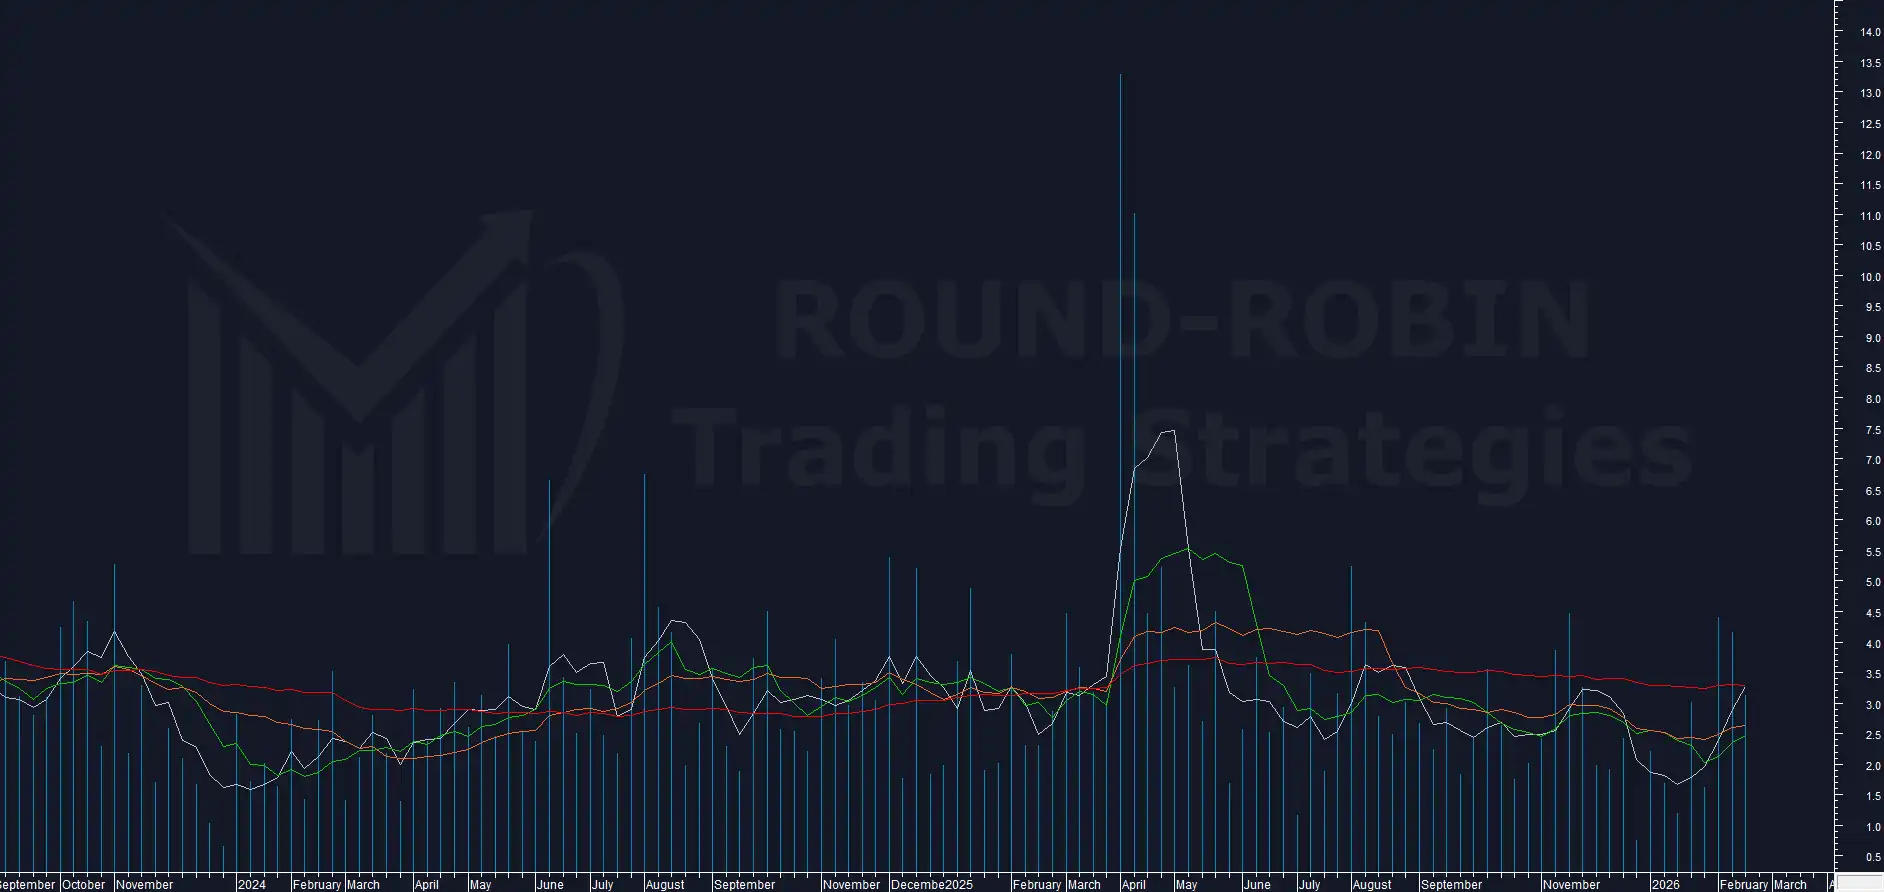
chart: FTSE MIB – weekly range %
The weekly range % also tells us nothing and the week closes below 2.5%.
Other Indicators / Oscillators
RSI has not reached levels where short/medium-term trend considerations can be made.
Once again the FTSE MIB did not post 2 consecutive negative weekly closes.
And once again it did not produce 2 weeks with close below open.
As noted last week, this hasn’t happened since October 2025.
Strategy
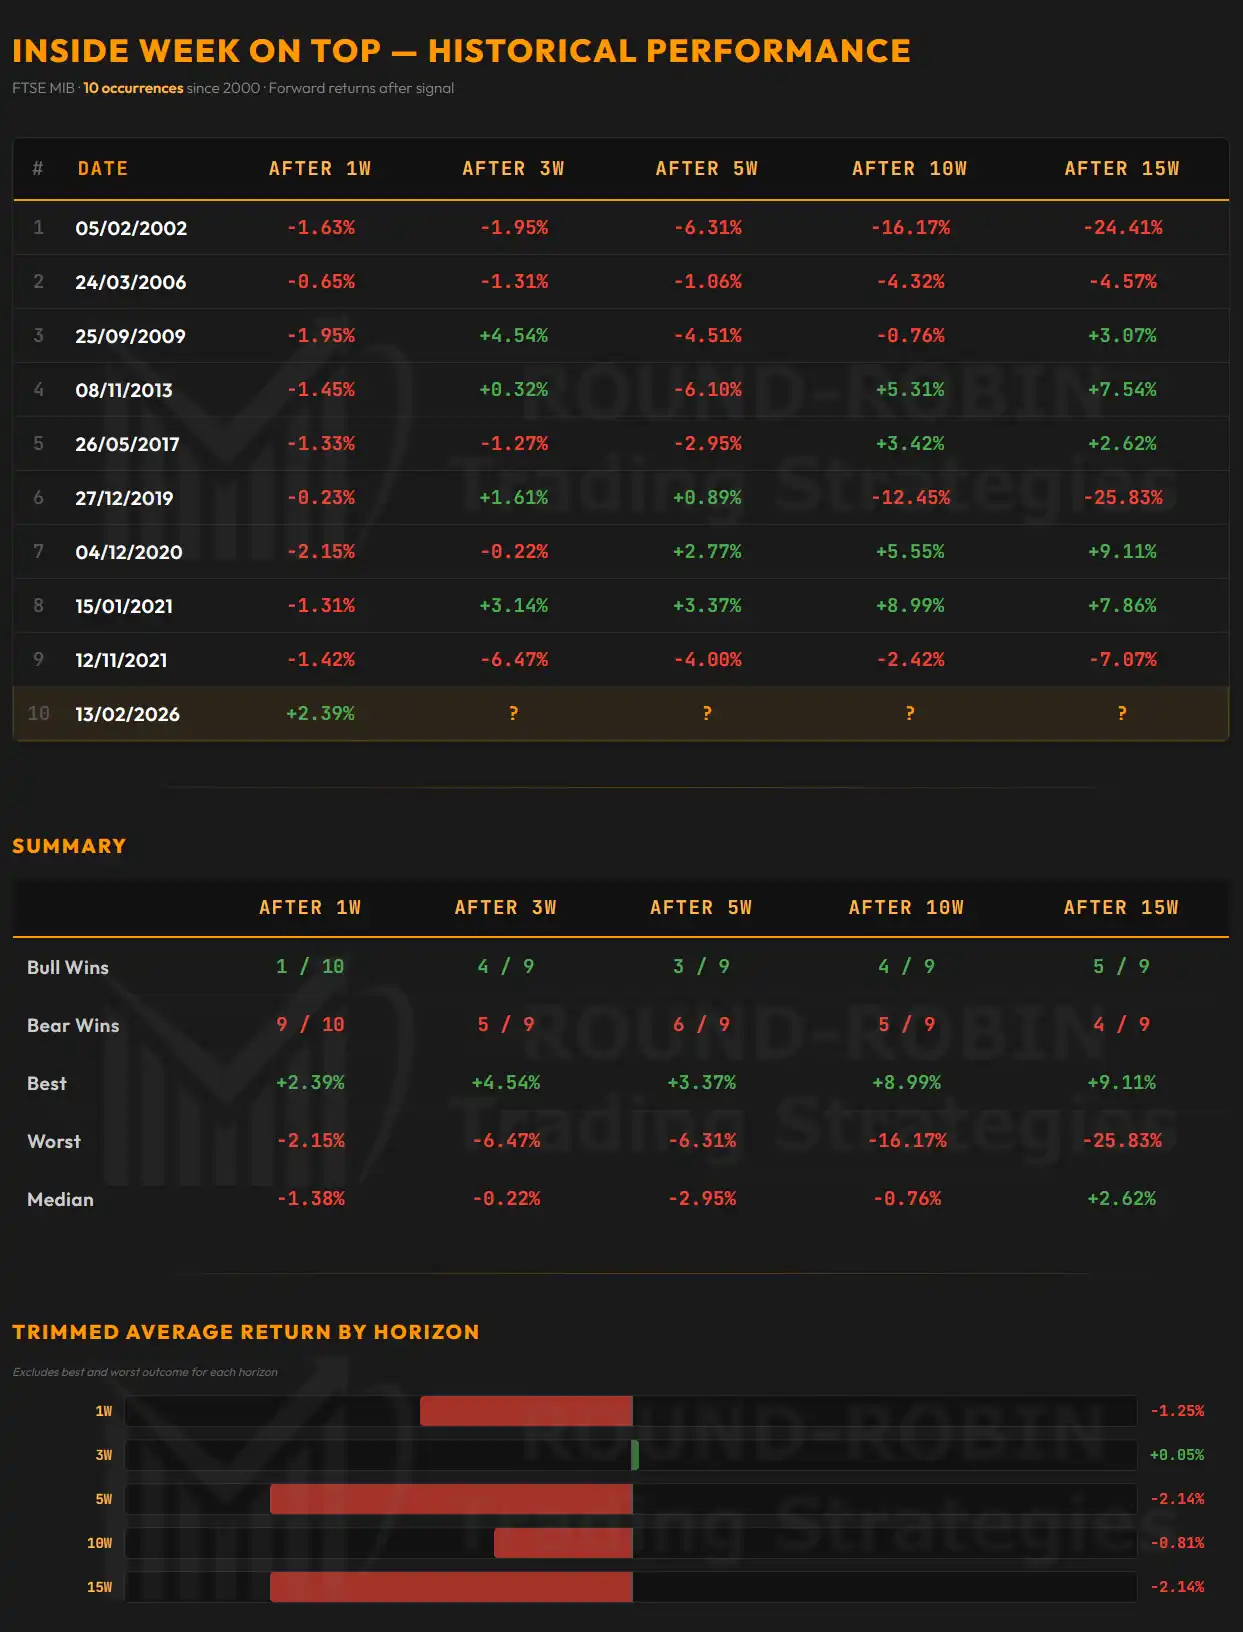
infographic: FTSE MIB Inside Week on TOP pattern
The previous week we had closed the Long Call leg (part of the strategy targeting a volatility expansion) initiated in late January.
The edge case study on inside candles on top pointed to a highly probable negative weekly close.
This, combined with the absence – since October 2025 – of 2 consecutive negative weekly closes and 2 consecutive weeks with close below open, led us to favor the bearish side: we maintained the Long PUT positions expiring February 20th and added new ones on the March 20th expiry.
The Long PUT positions on the March expiry have been maintained unhedged, given the marginal exposure, as the FTSE MIB failed to push beyond the previous highs.
The volatility explosion thesis proved wrong and without intervention would have led to 100% loss on both legs.
The Long PUT positions we opened last week on the March expiry were not hedged .
They would have been hedged in case of a bull market move, but the market failed to push beyond the highs of the previous 2 weeks.
We remain positioned and ready to hedge if new period highs are made with a clear weekly price signal.
There are no new indications and therefore no new positions are being opened.
One could increase the Long PUT position based on the previous week’s setup (inside candle suggesting negativity at 5 weeks) but with no other confirming signal we pass this time.
Conclusion
A boring week, flat systems, nothing discretionary visible on our timeframe.
All we can do is watch.
Not trading is also a strategic decision.
So far we have zero exposure on the DBBT misalignment, currently sitting between –30.1% and –33.3%.
Soon only members will be able to read this content. Sign up for free.
Leave a Reply