


Weekly appointment with the world’s most watched charts.
This week, the gold medal for Chart of the Week goes to Gold.
Everyone’s talking about tensions in precious metals, but Gold is telling a story that’s extremely different from Silver’s.
The weekly medium-long term chart is “ugly” to look at because of the mammoth candle from 3 weeks ago that makes almost all previous ones look insignificant.
But aesthetics aside, what really happened technically on the weekly chart—has the trend reversed like on Silver?
The answer comes from the moving averages.
The Big Picture
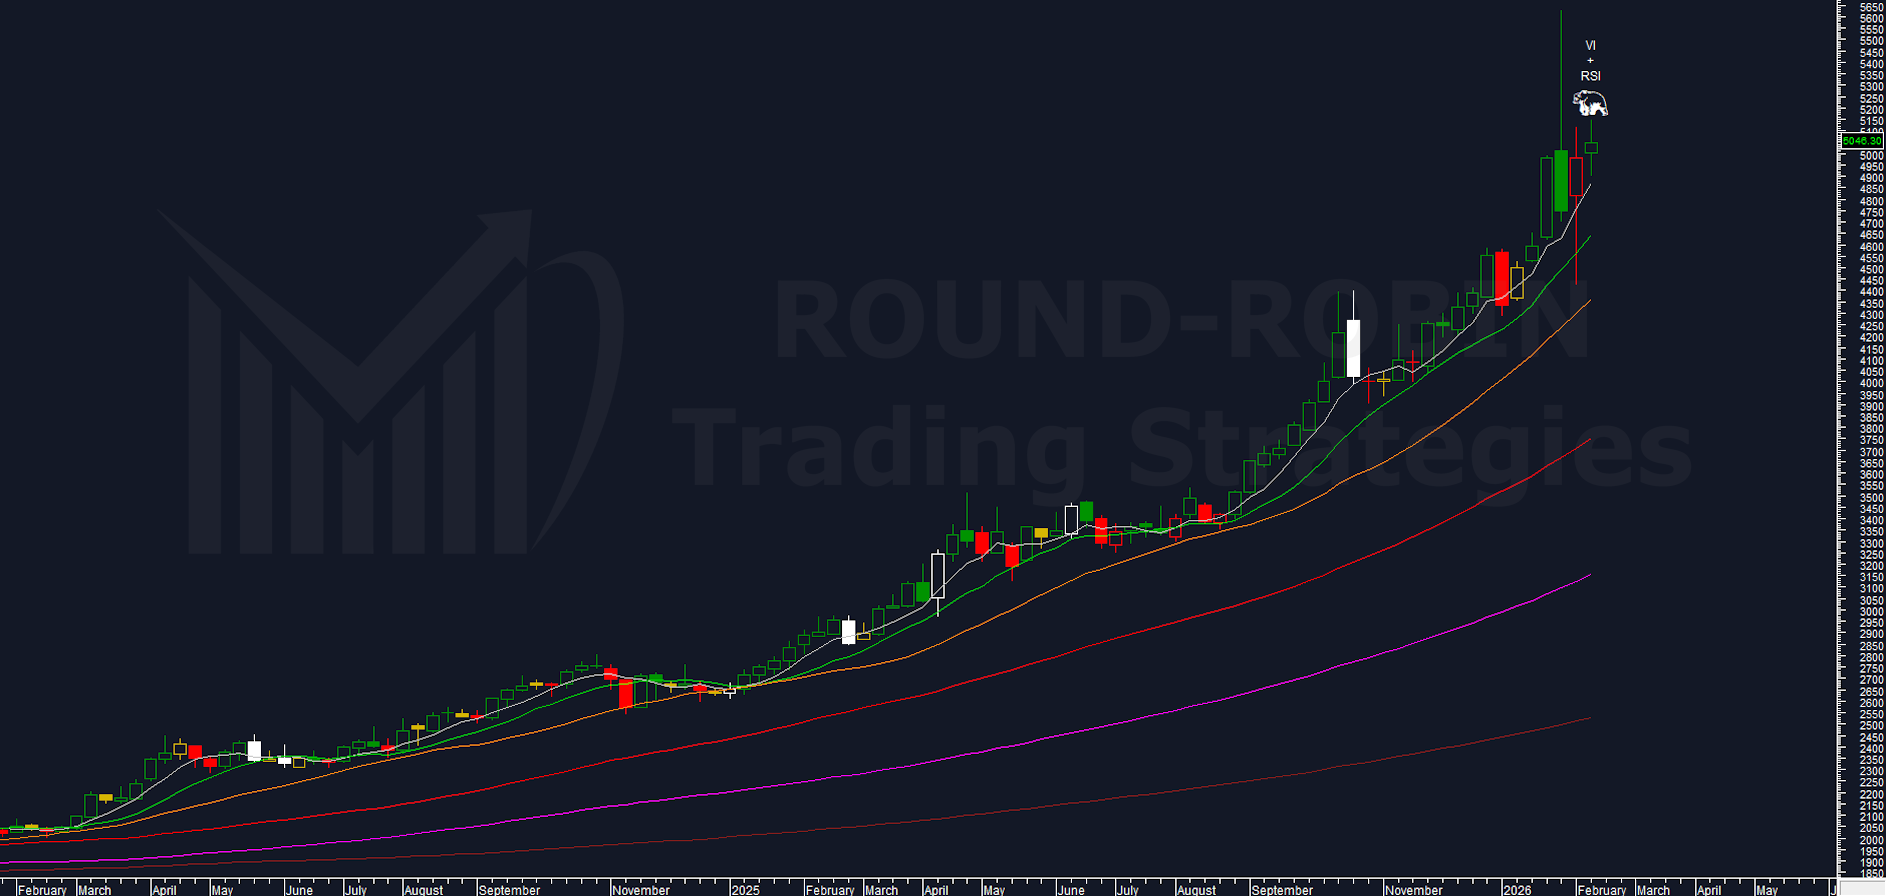
chart: Gold weekly
Prices are steadily above the MA5W (even in overextension this week), all moving averages are positively sloped and arranged from the fastest to the slowest one below the other.
The moving averages therefore tell us that the trend is intact.
Beginner’s voice: “But how can it still be bull with a 20% drop from the top?”
We’re talking about a weekly chart: the low (4,400 area) was effectively just noise on this timeframe because the close was positive (5,000 area).
How can we be absolutely certain it was just noise?
Close-Only Chart
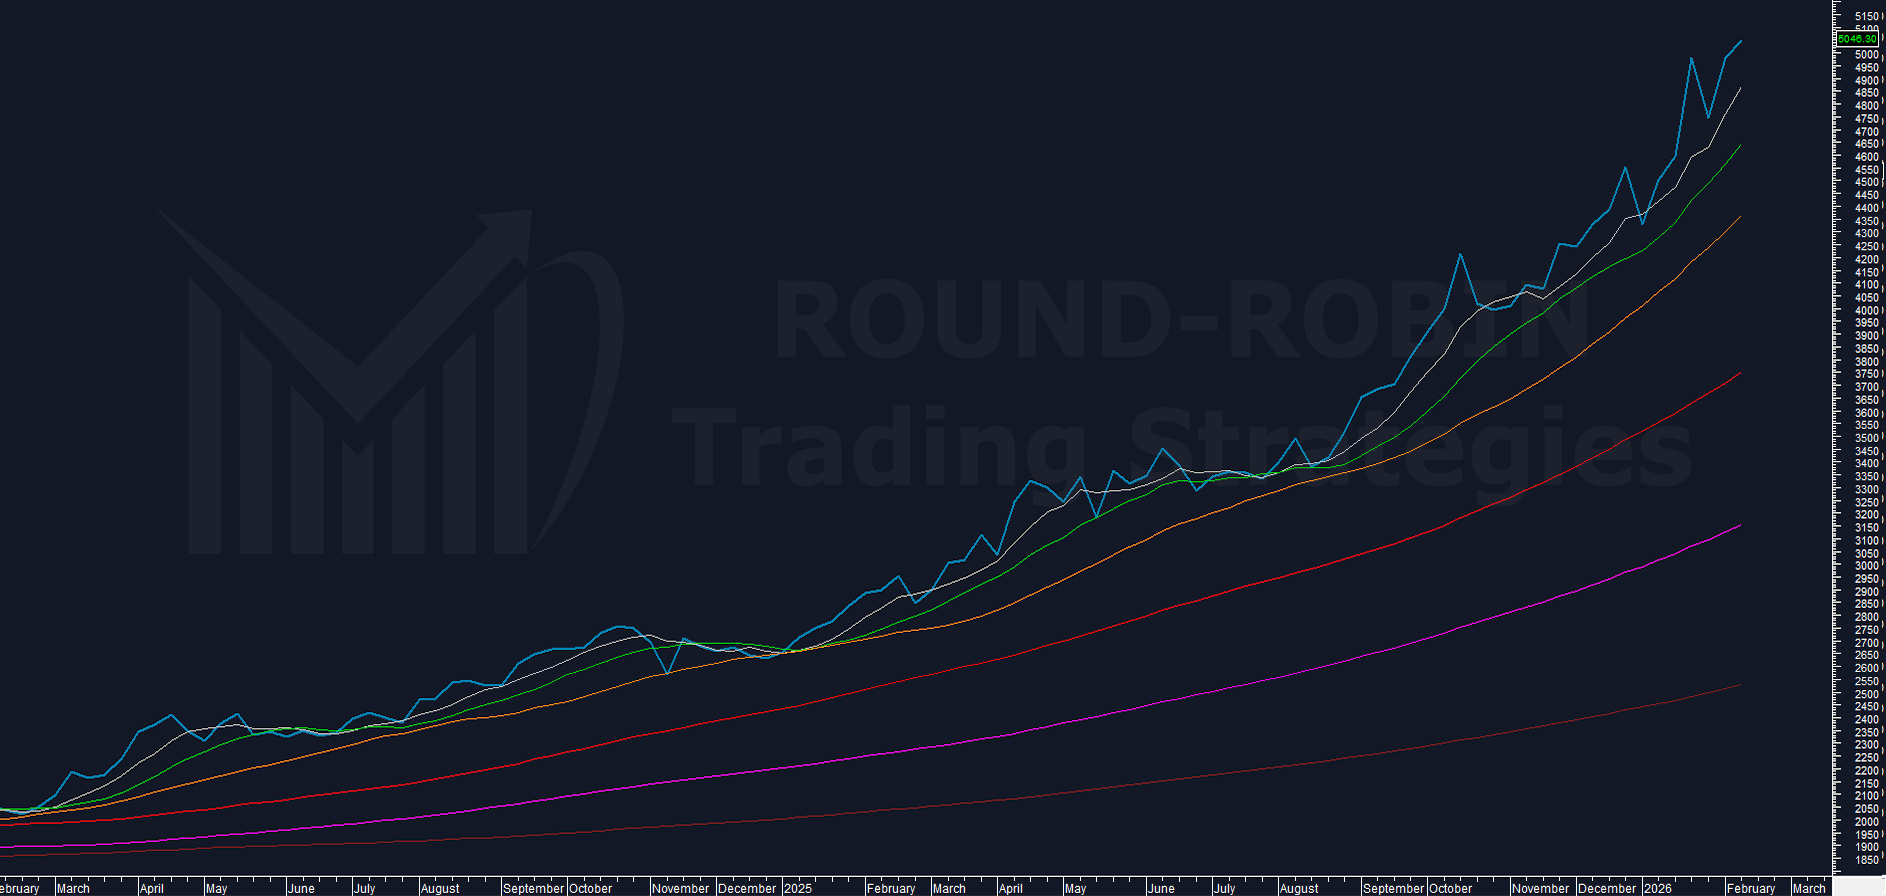
chart: Gold weekly closes
We reduce the information on the chart using the close-only chart—a method rarely used, especially by “traders” who use online tools convinced that the more complex the chart, the higher the probability of a correct analysis.
The chart not only tells us that Gold never dropped below the MA10W (since August 2025), but that during the crash (intraweek) of the previous weeks, closes were never below the MA5W—in fact, they never even came close.
Cherry on top: this week’s close is a new all-time high.
Beginner’s voice: “So it’s super bull, we can keep buying!”
Not quite.
We’ve established that there are no bear reversal signals, but that’s not a sufficient condition to say the bull trend will continue.
The top of the long wick from 3 weeks ago (5,626) is still over 10% away, and we certainly can’t dismiss that bear push as a fluke.
The bears aren’t only at the top but along the entire length of that wick.
The logical expectation is to anticipate a new bear attack as soon as prices enter even deeper into that wick.
Do we have other elements supporting this supposed logic?
Let’s try to see together.
Volatility
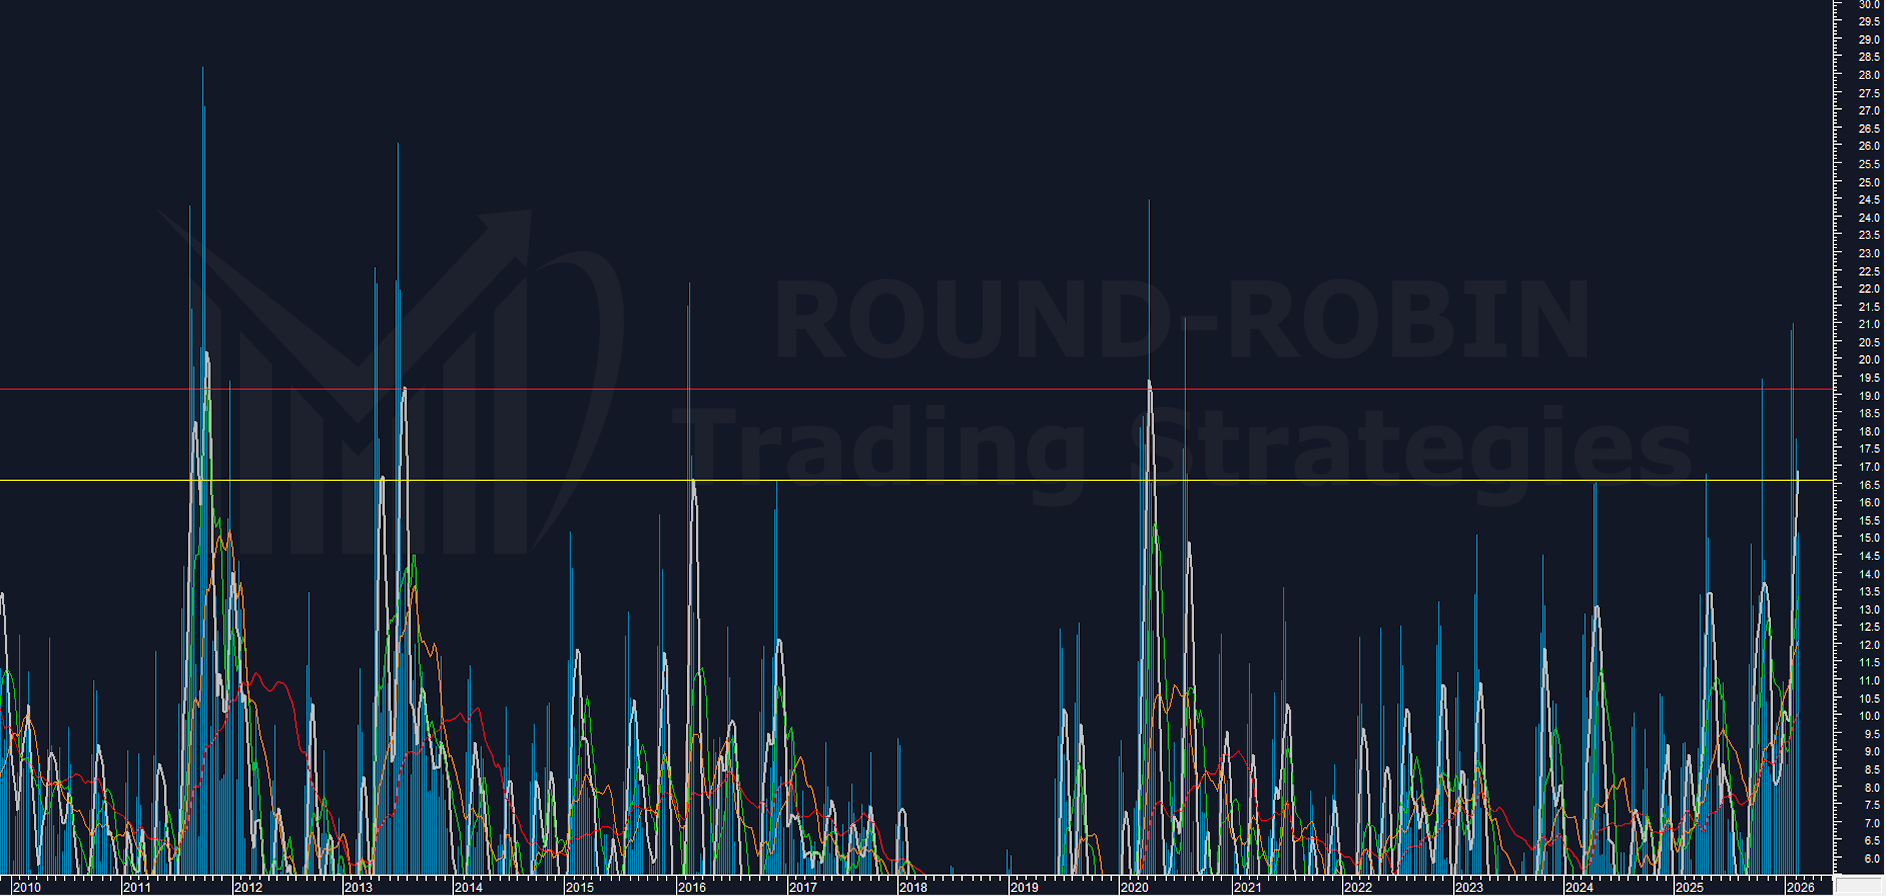
chart: proprietary Volatility Indicator on Gold weekly
Our volatility indicator shows we’re at historically very significant levels from a statistical standpoint.
In the last 15 years, the indicator has gone above 20 only in 7 phases—this is the eighth occurrence.
But what’s crucial for our analysis is the MA5W (white) calculated on the indicator, which surpasses the horizontal yellow line (2013 relative high and 2016 absolute high).
What happens when volatility is this high?
We don’t have a univocal answer—we have both strong continuation and reversal.
This isn’t useless information as it might initially seem: it tells us we should expect notable movements before volatility settles back to normal average values.
We then need to cross-reference the data with another indicator.
Volatility + RSI Combined Algorithm
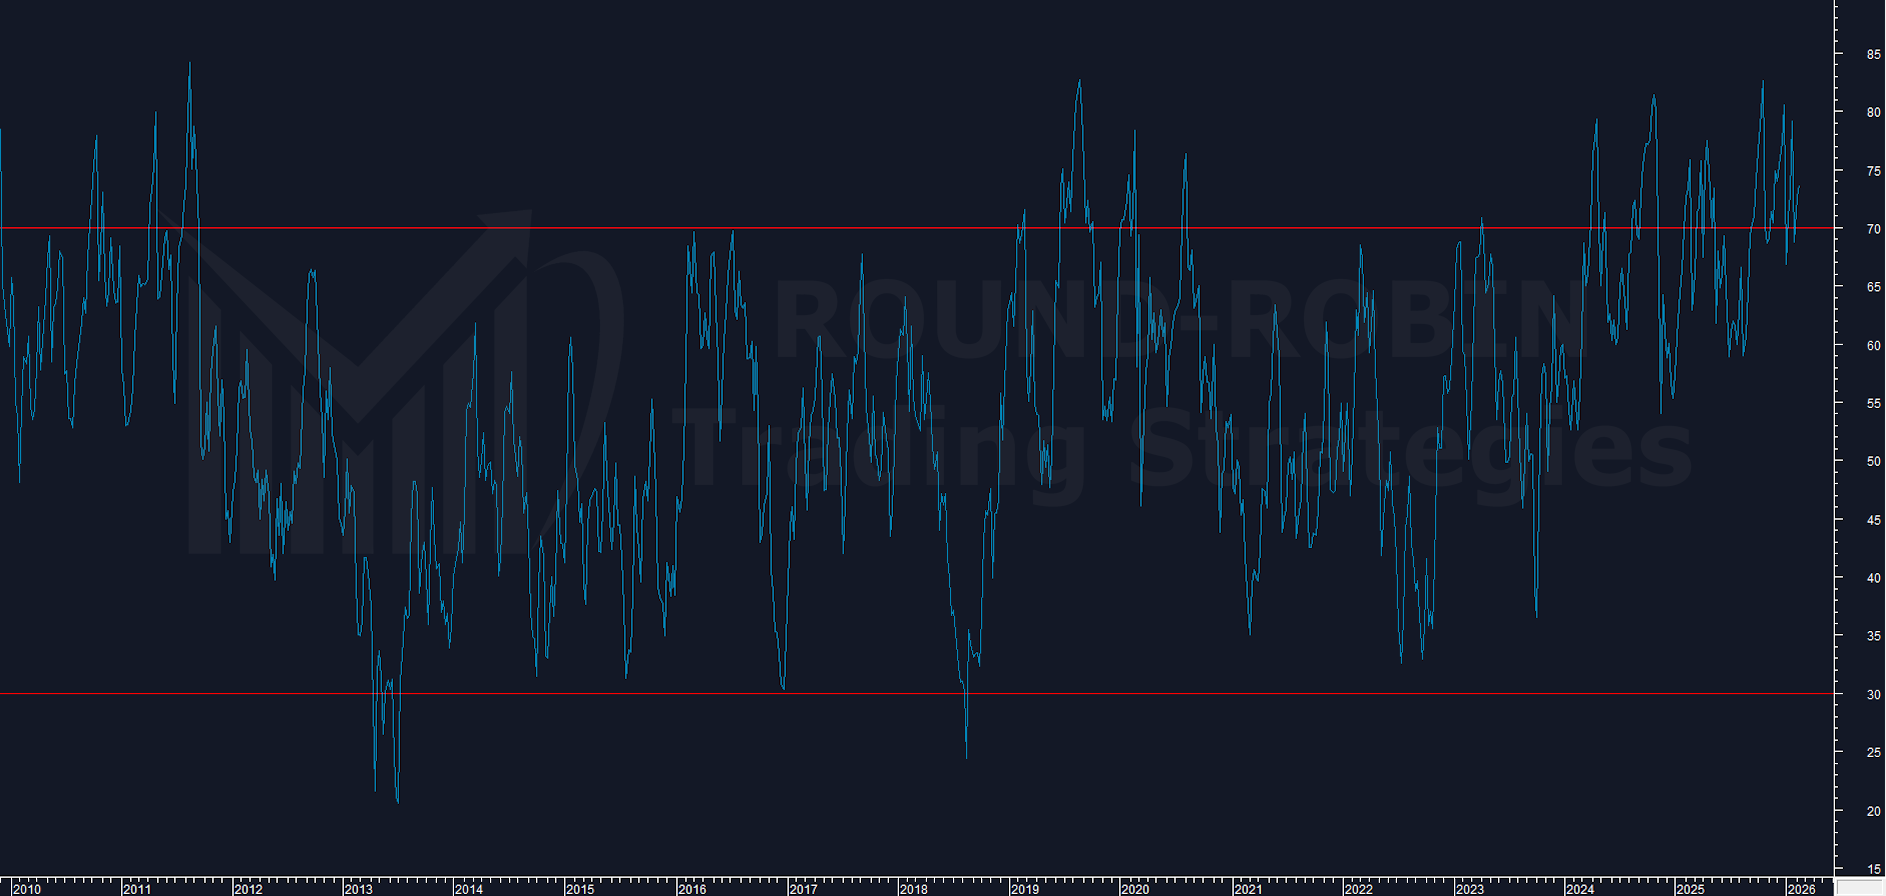
chart: RSI on Gold weekly
Our approach when a proprietary indicator shows something important but with an imprecise direction is to combine it with a classic indicator.
In this case we’ve created a specific algorithm that combines our volatility indicator with what is perhaps the most classic oscillator of all: the Relative Strength Index.
The RSI alone tells us little: Gold is in overbought territory, and there’s a negative divergence against August 2025.
Those who use RSI know that these situations can persist for a long time and aren’t a price signal.
The axiom overbought = sell is a demonstrably false myth.
However, combining our Volatility Indicator with RSI in overbought territory, we get extreme and rare events.
Besides this week’s occurrence, we have 7 cases:
| Year | Outcome | Timeframe |
|---|---|---|
| 2011 | Reversal | 3 weeks |
| 2006 | Reversal | 2 weeks |
| 1999 | Reversal | 2 weeks |
| 1990 | Reversal | 1 week |
| 1986 | Reversal | 5 weeks |
| 1982 | Reversal | 2 weeks |
| 1979–1980 | Full retracement of the rally | 7 weeks |
The only fail is the most distant case, straddling December 1979 and March 1980.
The price of Gold doubled before retracing (the reversal came much later).
So we can say that in terms of extreme patterns, the expectation is for at least a short-term reversal to repeat.
The algorithm combining Volatility Indicator and RSI confirms what we’d seen with the volatility indicator alone, contextualizing the trend.
If Gold has high volatility, it’s highly probable that strong movements will continue—and if RSI is in overbought territory, it’s highly probable that these movements will be a reversal.
When they’re not (1 case), the continuation is violent.
The 2011 Precedent
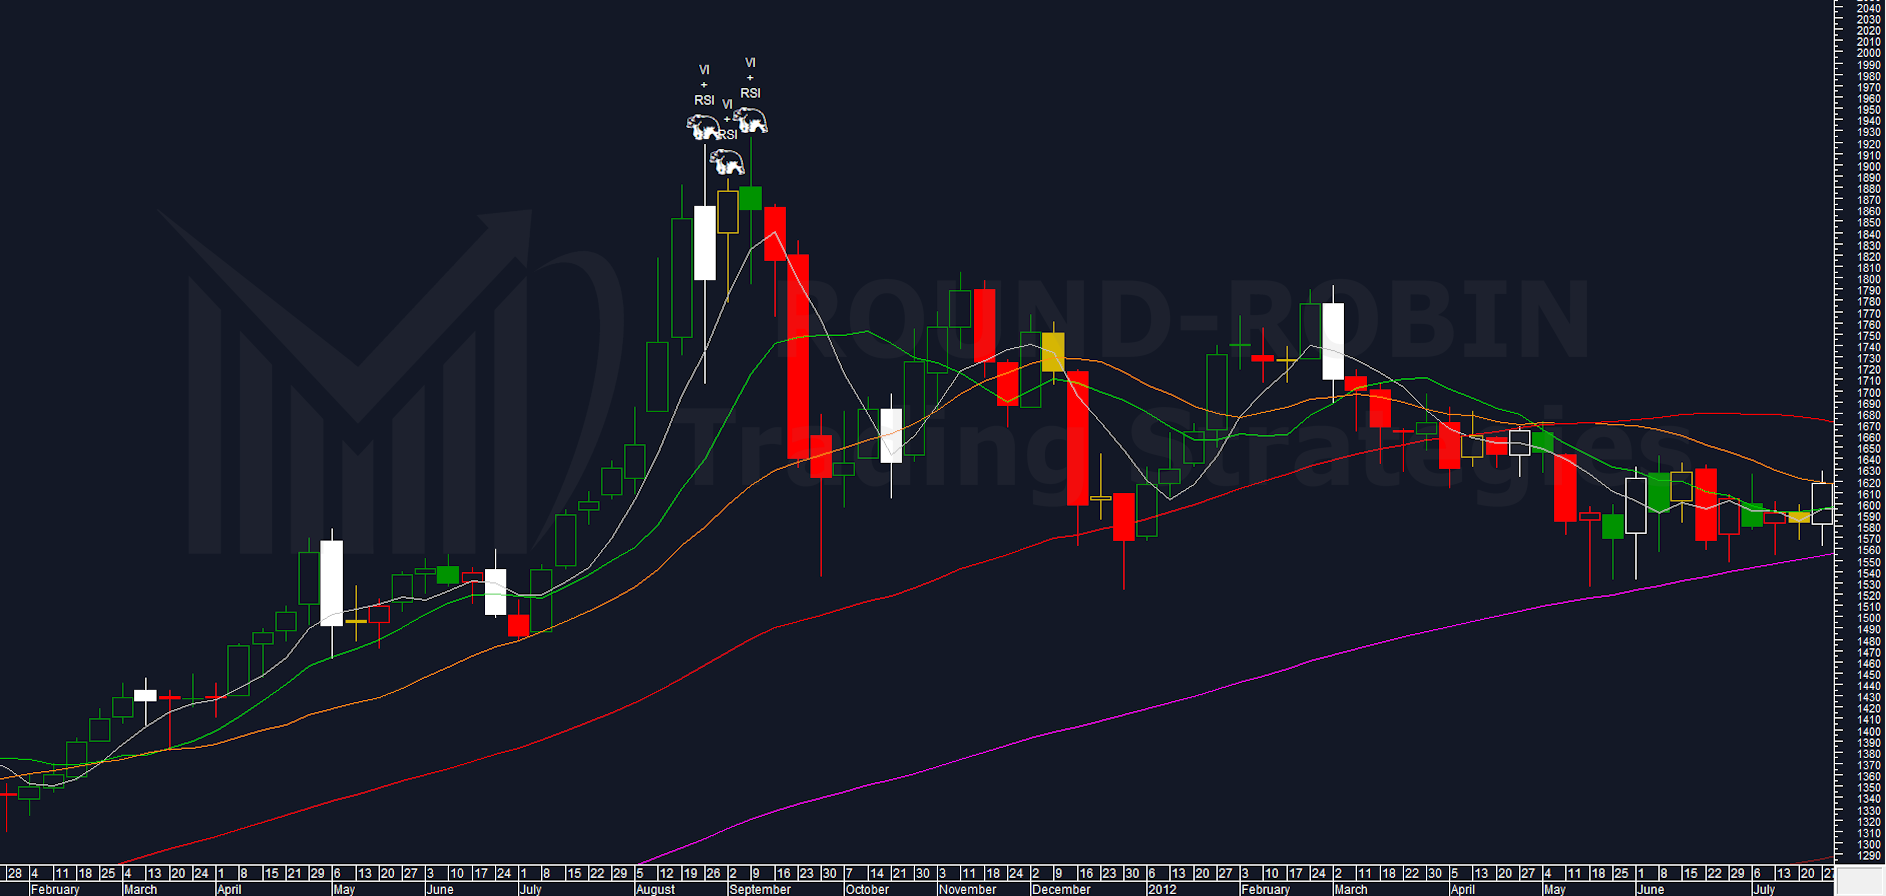
chart: Gold weekly + algo VI+RSI overbought 2011
In the chart above, the most recent case in which the combined algorithm applied to Gold provided the alert: August 26, 2011.
It made a new high (only intraweek) 3 weeks later but without any break at week’s end.
From there, the decline began.
Summary
| Indicator | Signal |
|---|---|
| Moving Averages | Trend still intact, no bear reversal signals |
| Close-Only Chart | New all-time high close; crash was intraweek noise |
| Long wick (5,626) | Bears present along the entire wick; potential resistance ahead |
| Volatility Indicator | Historically extreme levels; notable movements expected |
| Volatility + RSI Algorithm | 7 out of 8 historical cases produced a reversal within 1–5 weeks |
Conclusions
Sufficient to take a position immediately?
In my opinion, no—but at the first sign of bear presence inside the long wick of the January 30, 2026 week, then it becomes a strong yes.
It could take up to 5 weeks, but at the first opportunity from next week, every bear signal is worth following.
Money management is complex because the combined algorithm gives us another piece of information: a potential breakout above the high isn’t necessarily bullish (it could be a bull trap).
You must therefore be willing to always wait for the weekly close and only stop out if there’s a candle providing a clear breakout signal—for this reason, at least initially, exposure must be contained and compatible with your own financial plan.
The probabilities are higher for a bear scenario, at least in the short term.
Using this analysis combined with the one on Silver, one can hypothesize that Gold, in case of a bear market, could outperform Silver—for this we refer to the strategy proposed pre-crash: Long Gold – Short Silver (spread trading).
Operating exclusively on Gold: if the historical pattern is confirmed, the market will tell us—but taking a bear position at the first price signal is perfectly coherent with what the data is telling us.
Until there’s a different price signal: the long term remains bullish, but a short-term reversal is the highest-probability scenario.
Soon only members will access this content. Subscribe free.
Leave a Reply