


Weekly tracking of the Italian benchmark index.
Why do we do this?
Check out our strategy page.
My proprietary DBBT indicator identifies misalignments between current price and expected technical levels on major indices.
Every week, the FTSE MIB is in our crosshairs.
The hunt is on.
The quarterly expiration week delivered on its promise.
A brilliant start. Then a second half completely in bear hands.
Close at 42,840.90 — a solid -3.33% on the previous week.
Let’s try to bring some order to the volatility chaos.
Bulls vs Bears
Let’s start with the numbers.
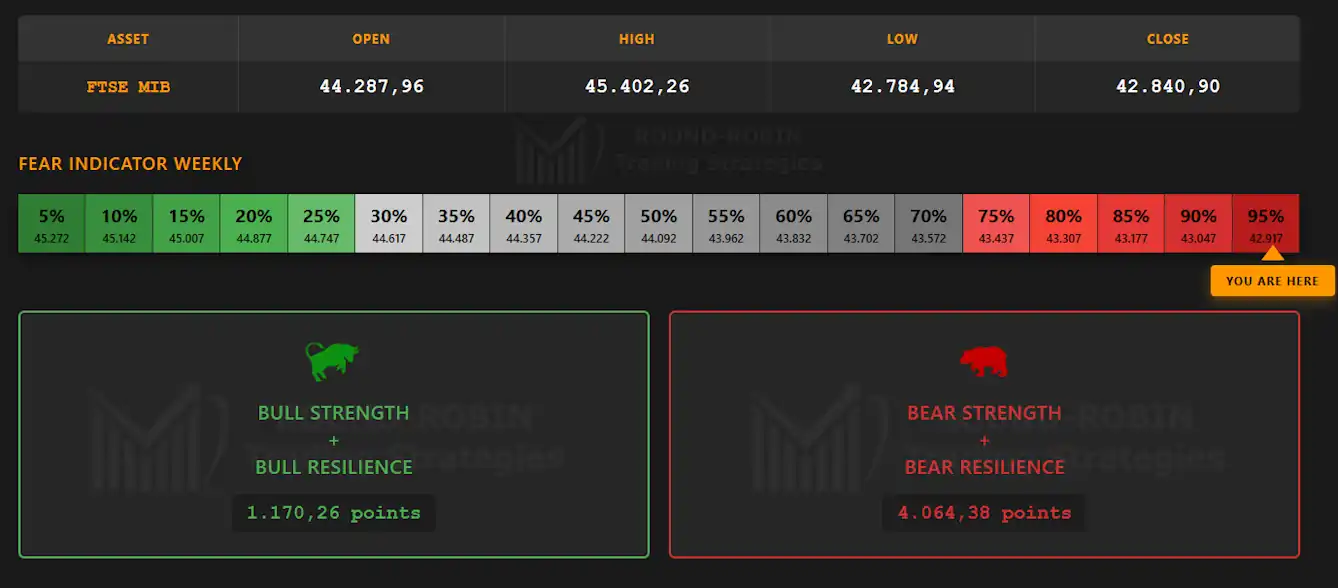
Open 44,287.96 — High 45,402.26 — Low 42,784.94 — Close 42,840.90.
A candle almost mirroring the previous week. Nearly identical body. Open and close reversed. Highs and lows still declining.
A visual coincidence that catches the eye, but adds nothing to the analysis.
The fear indicator is back at the edge of panic: 95%.
Last week’s recovery into neutral territory was short-lived.
The market has immediately plunged back toward extreme levels.
Bear strength is overwhelming: 4,064.38 points against 1,170.26 for the bulls — it wasn’t even close.
Next week could be the one where panic manifests openly.
The Big Picture
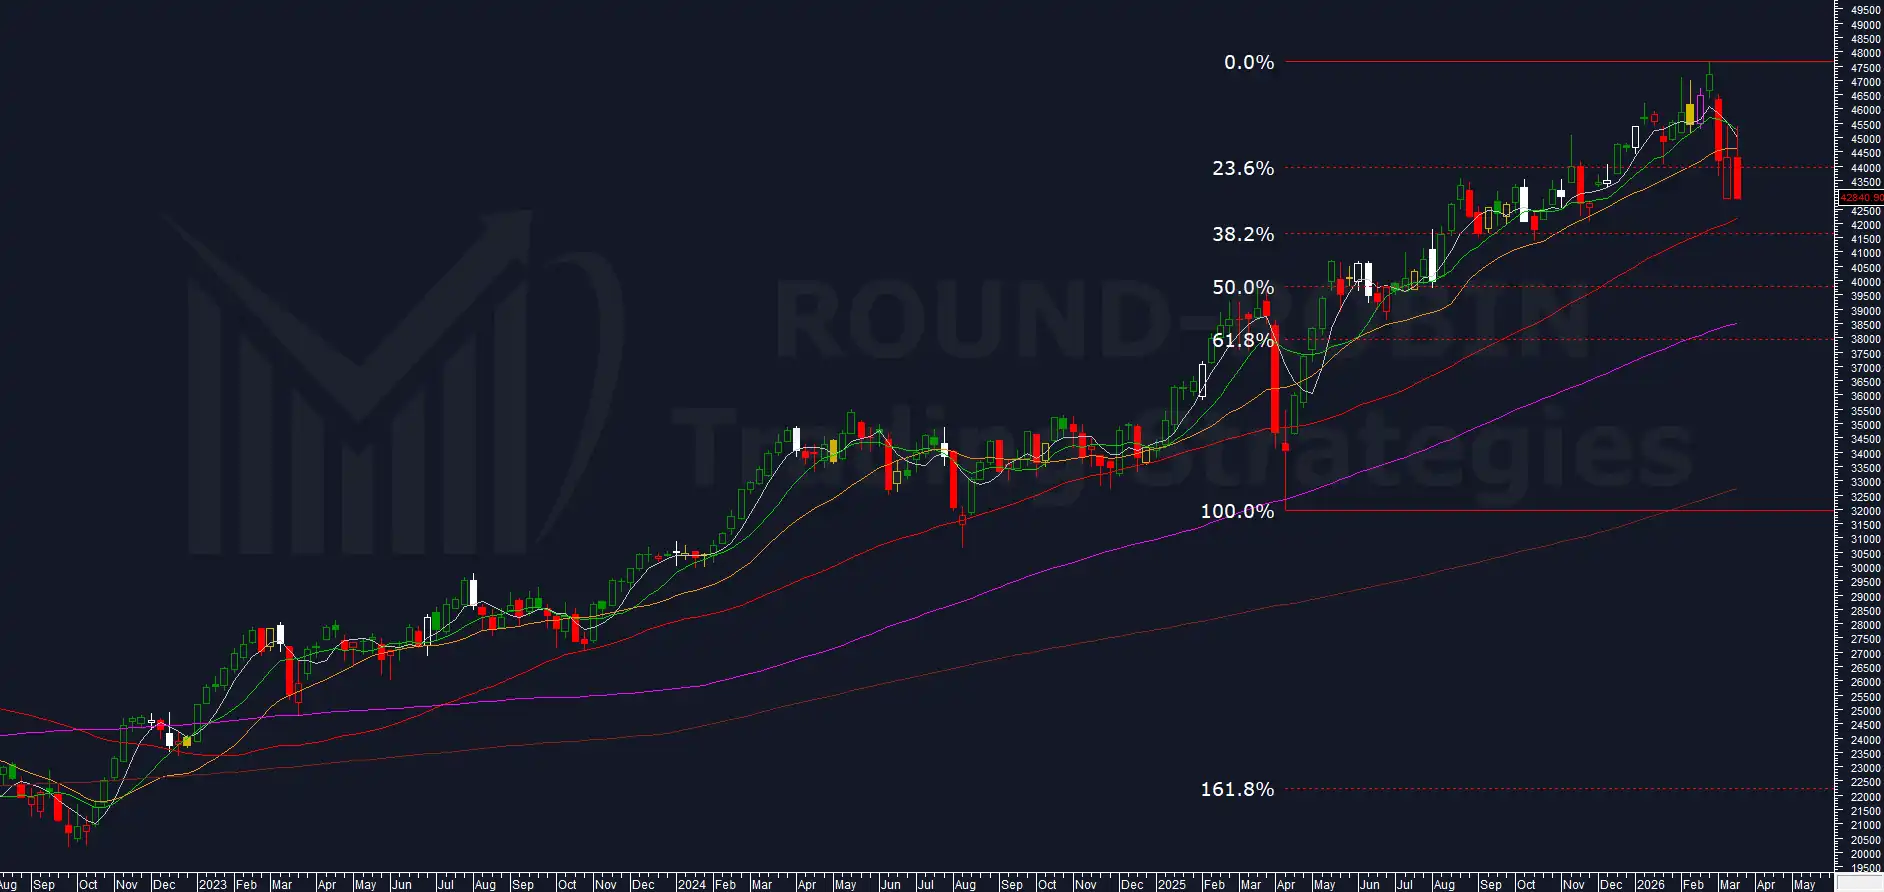
Third consecutive week closing below the MA20W.
In the meantime, the MA20W has reversed its slope and is now bending downward.
A structural deterioration that goes beyond a simple correction.
MA5W and MA10W acted as resistance for the second consecutive week. They pushed prices back down every time the market attempted a recovery.
The short-term bear trend remains intact.
The target remains the 42,000 area, where the FTSE MIB MA50W currently sits.
On the bull run from April 2025 to February 2026, the 50% retracement falls exactly in that zone.
It is a conventional level. The 50% does not belong to the Fibonacci sequence.
But the market treats it with the respect reserved for key technical levels.
Coincidentally, that area also corresponds to the March 2025 highs.
A detail that may reinforce the case that, should prices reach that zone, bulls will be present.
In a few months, if the decline is not vertical, the MA100W will reach the same zone.
A technical cluster that could become a medium-term intervention area for bulls.
Volatility Indicator
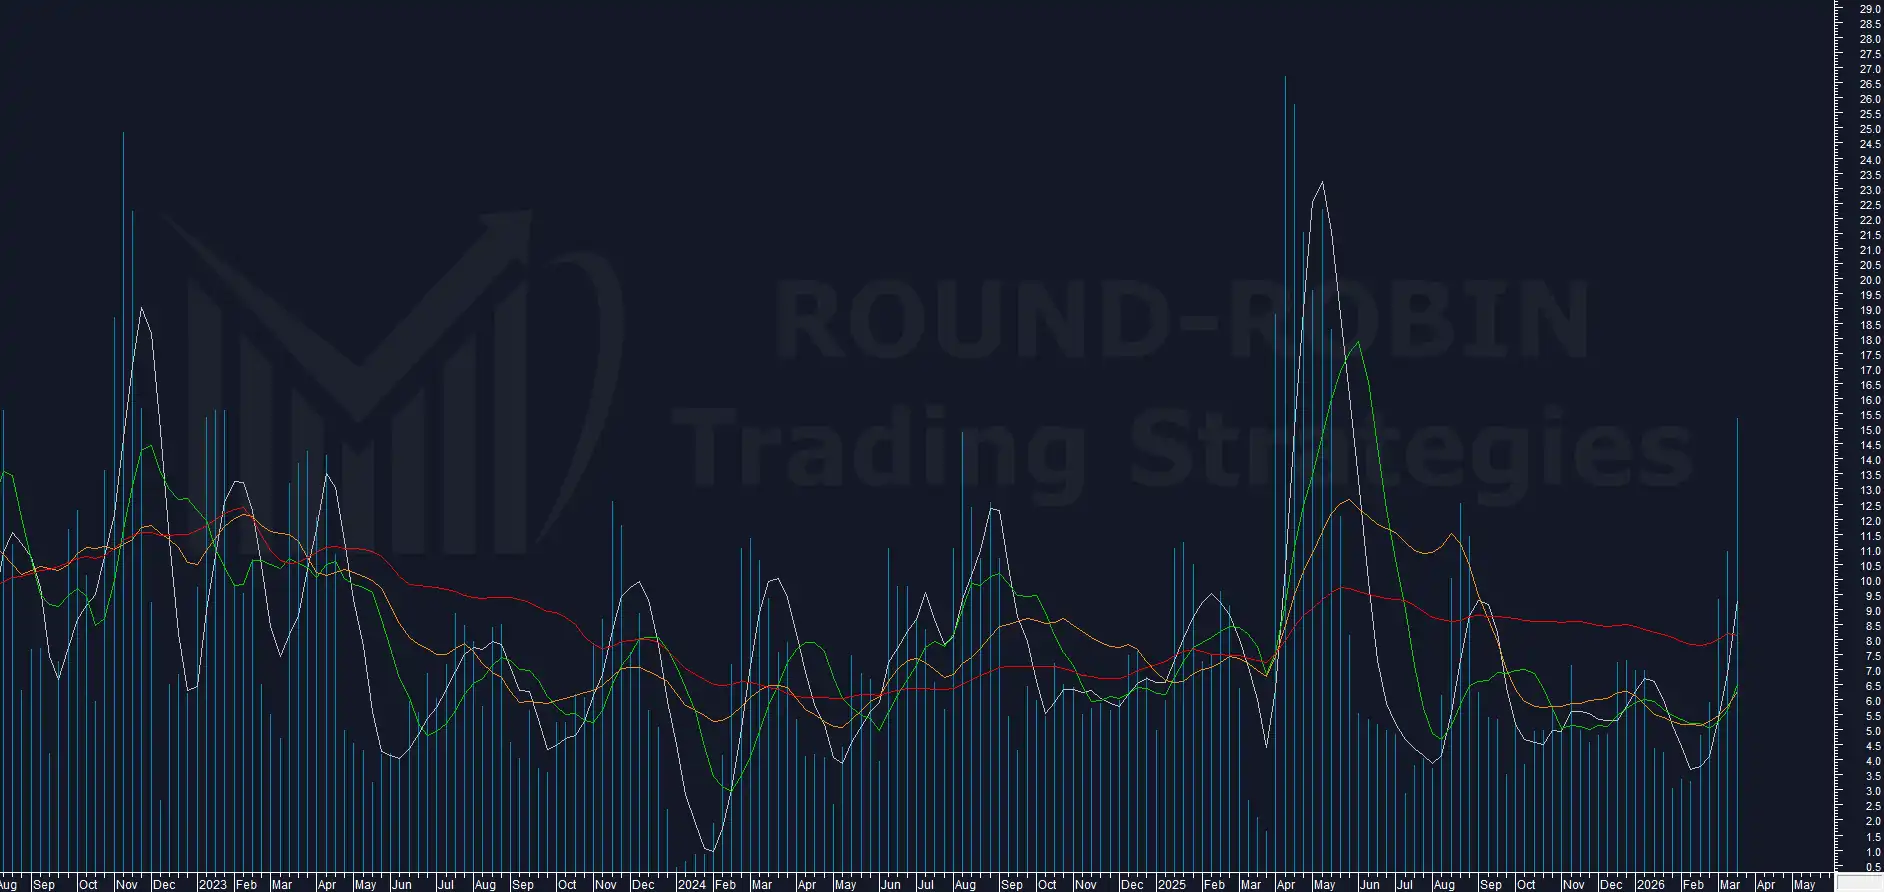
Spike to 15.38%.
The same level touched in August 2024. Not an absolute high since then — in April and May 2025 it went well beyond.
But that comparison is relevant for a different reason.
In August 2024, the spike coincided with the FTSE MIB reaching the MA50W.
That MA50W held, and the subsequent rally started from there.
The same setup could repeat. The MA50W is less than 1.5% away from current prices.
This is not an immediate operational signal, but a warning.
When the FTSE MIB reaches that moving average, the combination of a volatility spike and a key technical level will demand full attention.
For those who have ridden the entire decline, that will be the moment to consider hedging or taking profit — if the MA50W holds.
RSI
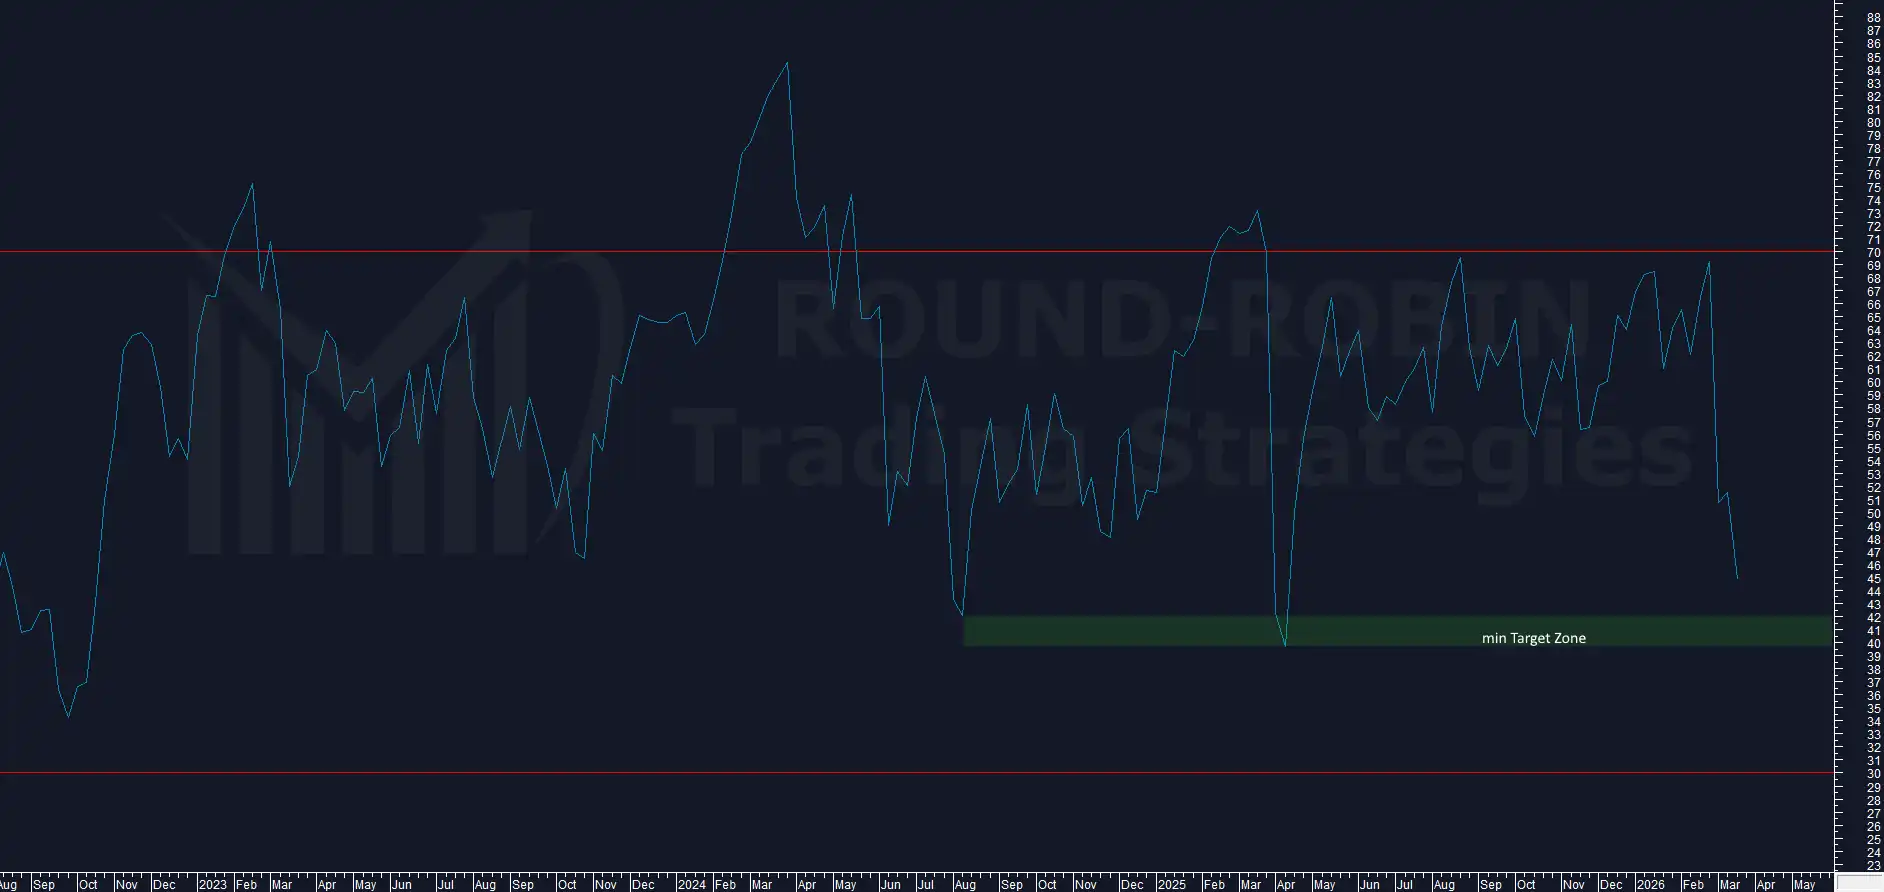
RSI at 44.87.
Approaching the 40-42 target zone indicated in recent weeks.
The path remains consistent with the ongoing scenario.
Strategy Update: Inside Week on Top
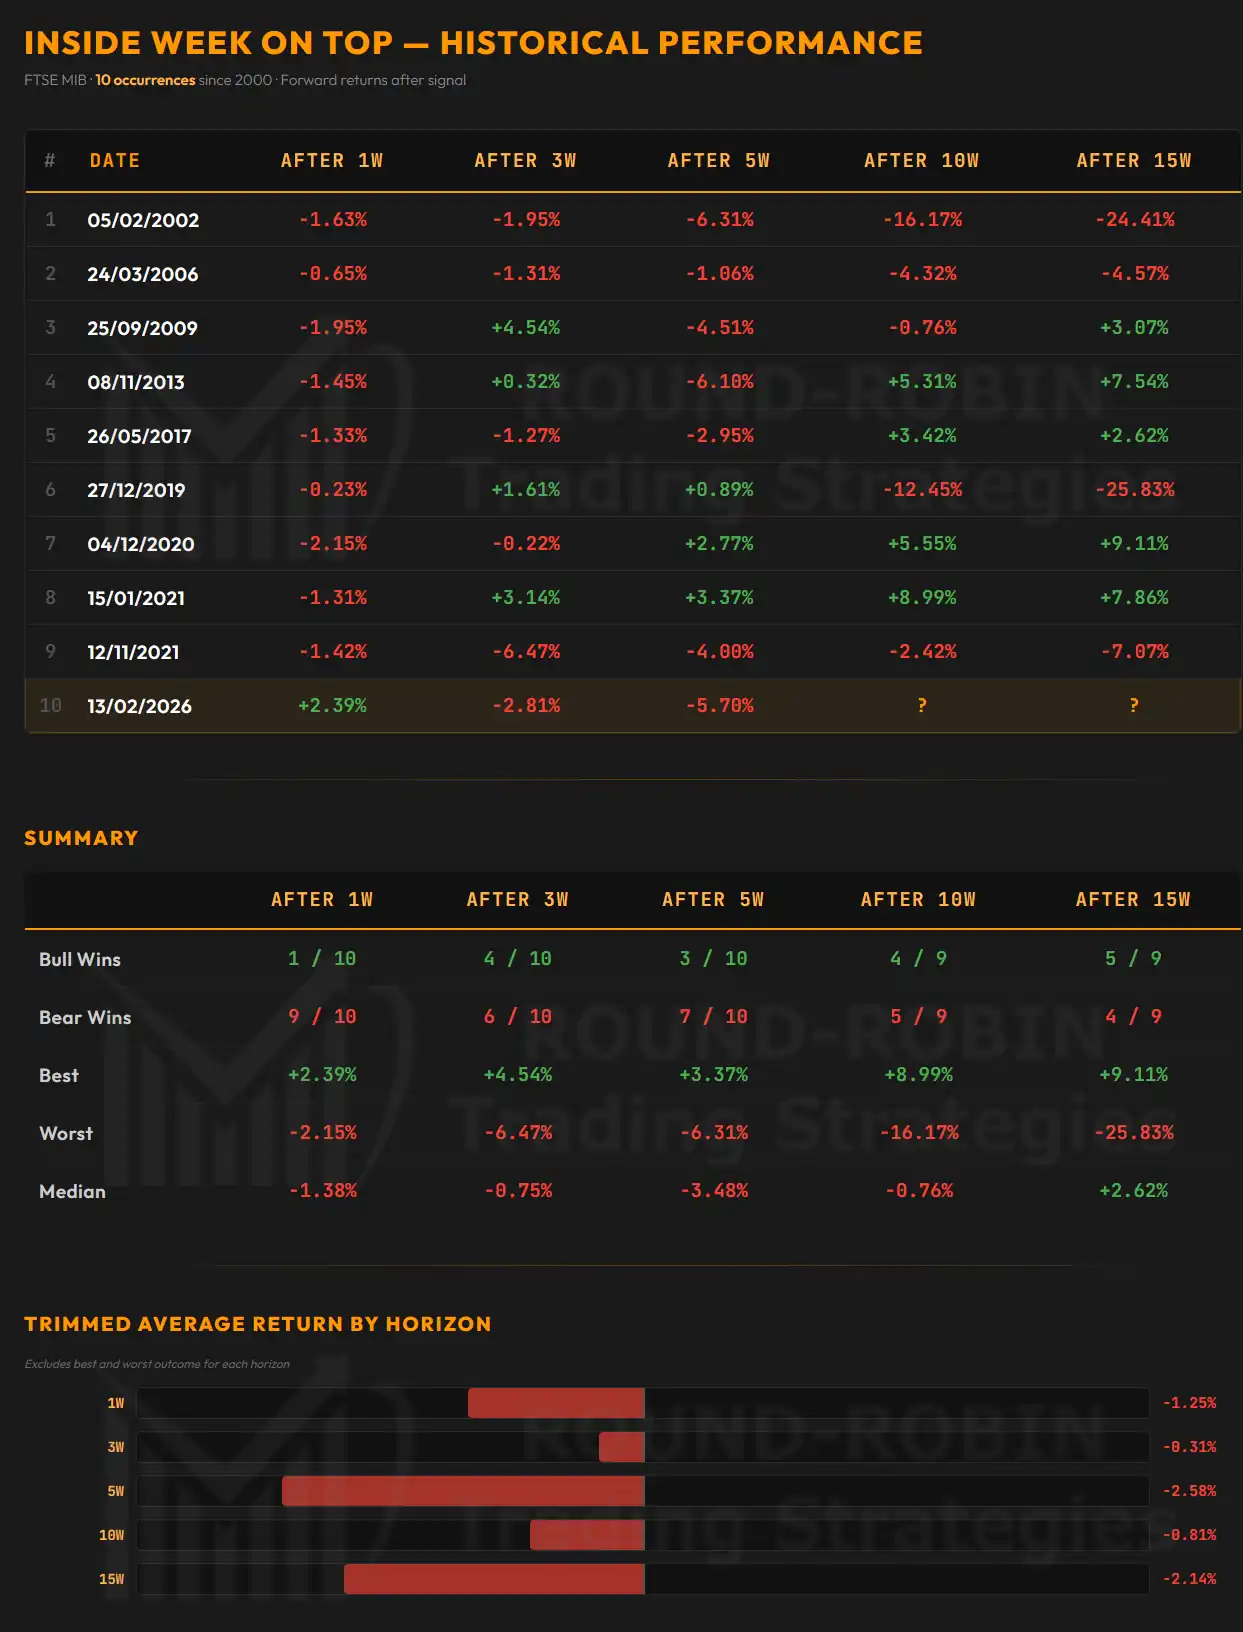
This week marks the completion of the fifth week since the Inside Week on Top signal of February 13.
The one that historical research identified as the most statistically critical.
The pattern allowed us to ride the entire decline — 100%.
-5.70% at five weeks from the signal.
The peak drawdown coincided exactly with the quarterly expiration week.
A precision that is hard to ignore on a pattern with only 10 historical cases.
The market delivered exactly what the model indicated. Point by point.
Looking ahead to 10 weeks from the signal, no definitive statistical conclusions emerge yet.
It is worth noting, however, that the median tends to recover. The trimmed mean remains negative, but already shows improvement compared to the 5-week reading.
At 15 weeks, two cases show drawdowns of approximately -25%.
While in 5 out of 9 cases the outcome favors the bulls.
Only a strong recovery before week 10 would support a positive outcome at week 15.
Otherwise the probabilities favor a continuation of the bearish trend at least through the next expiration.
Which means at least through May.
Conclusion
The FTSE MIB short-term outlook remains bearish.
The question is not whether or when the index will reach the MA50W around 42,000.
The question is what the market will do once it gets there.
If the week closes below the MA50W, we stay bear.
If the MA50W holds and the market closes above it, we close the trade and take profit.
Watching closely to see whether a recovery for the next 5 weeks begins from there.
Starting next week this content will be for members only.
Leave a Reply