


Quick observations on the charts that caught our eye this week.
This week’s flash covers EUR/USD, Nikkei 225, Gold, Silver, Bitcoin and – for the first time, given the current geopolitical backdrop – Brent Crude. EUR/USD relentless in its descent and now at the doorstep of our first target, the Nikkei piercing and recovering the MA20W with a long upper shadow, Gold printing an inside candle at all-time closing highs triggering a short signal, Silver following with its own inside and breaking through both the MA5W and MA10W, Bitcoin resolving its inside candle to the upside now pressing against resistance, and Brent posting one of the most extreme weekly ranges in 25 years.
This is not meant to be a full analysis – just food for thought on a few charts that caught my attention this week.
⚡ EUR/USD
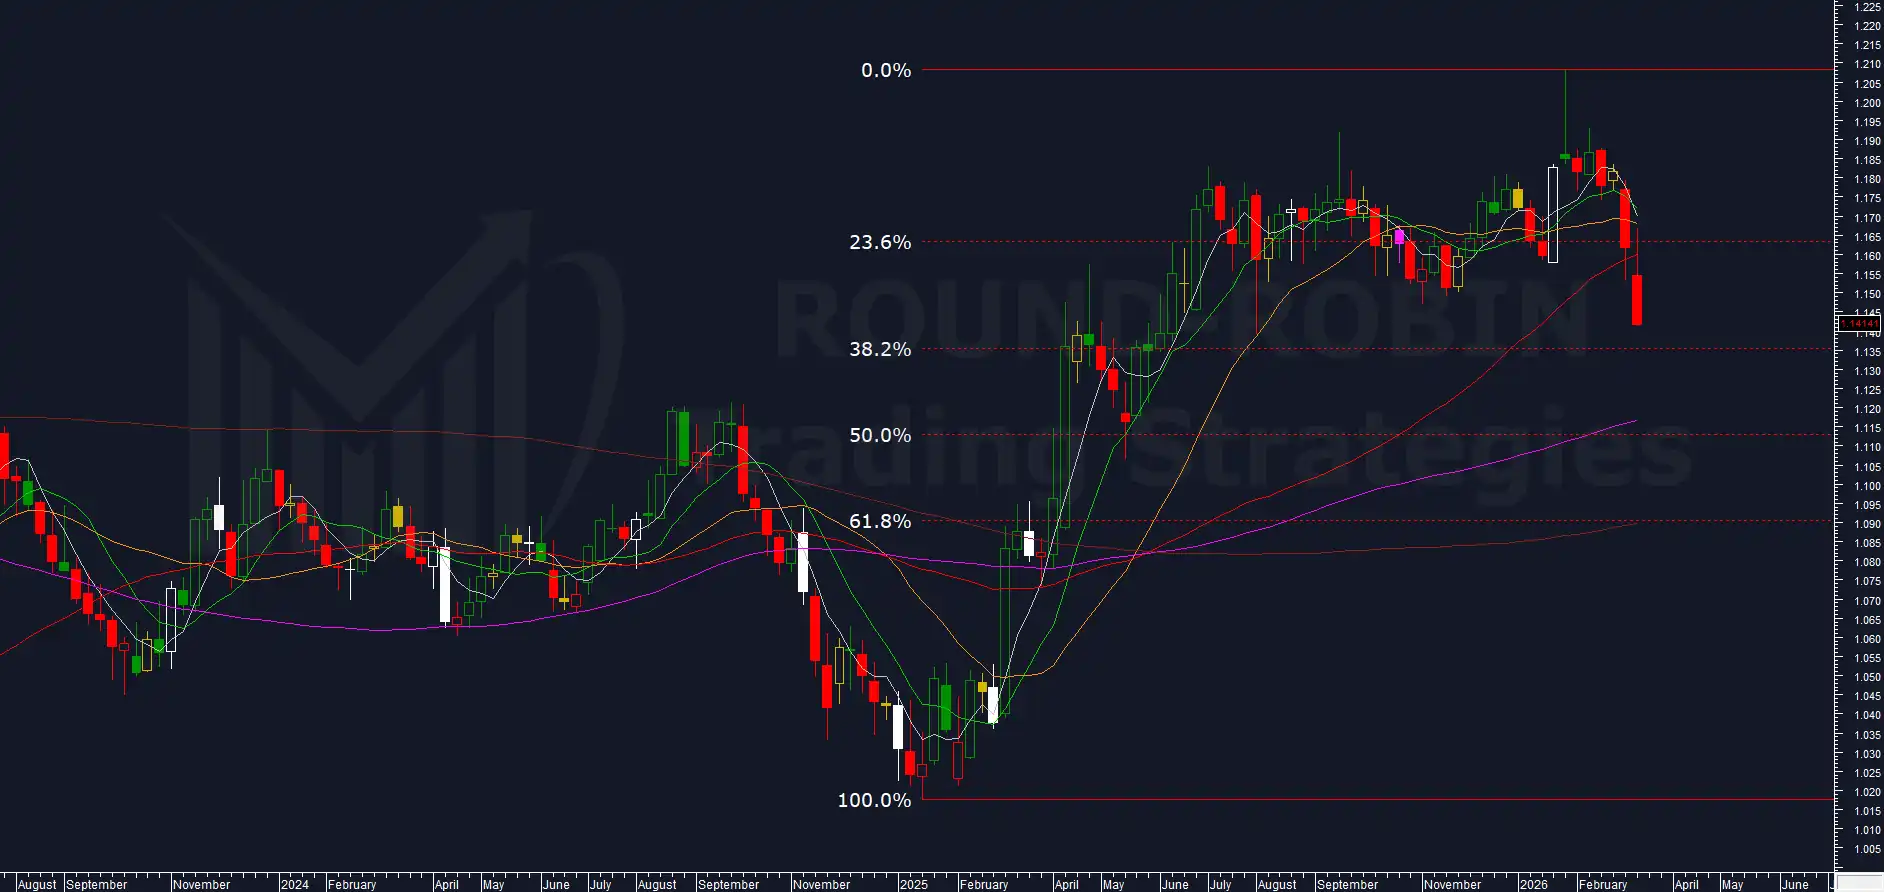
chart: EUR/USD weekly
The King of Shooting Stars continues to reign.
After the bearish confirmation two weeks ago, EUR/USD has been relentless – testing the MA20W as resistance before accelerating further, closing the week at 1.1414, one step away from our minimum target of 1.14.
Should prices confirm a weekly close below 1.14, the next reference becomes the MA100W in the 1.11-1.12 area.
Beyond that, the confluence of the 61.8% Fibonacci retracement and the MA200W points toward 1.09 as the more ambitious objective.
Our approach remains step by step: we confirm each target before extending, verifying at each stage whether the bearish momentum is still intact.
For last week’s update, see our Charts Flash Week 10. For the full EUR/USD framework, see our Chart of the Week and the original King of Shooting Stars pattern study.
⚡ NIKKEI 225
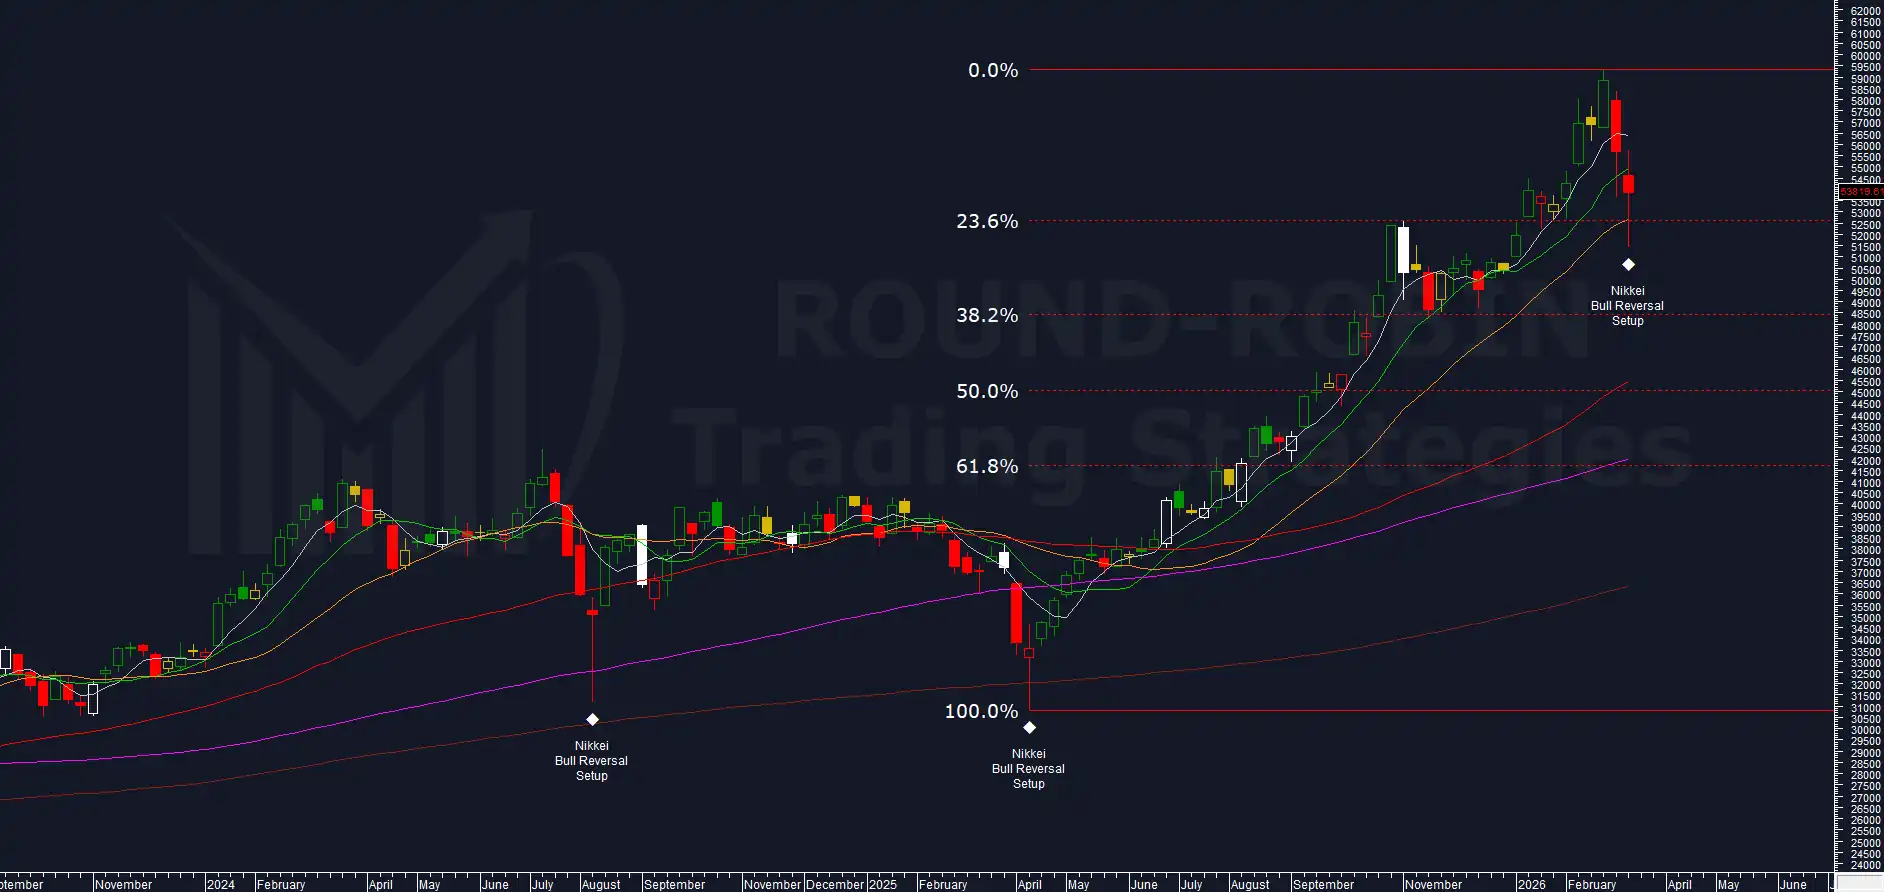
chart: Nikkei225 weekly
The bears delivered – but couldn’t sustain it.
The MA5W was never challenged to the upside: prices bypassed it entirely and drove straight through the MA20W to the downside, reaching an intraweek low of 51,407.
From there, a sharp recovery with a long lower shadow pulled the weekly close back to 52,653, above the MA20W.
That loss of bearish momentum triggers the exit on our short. The next signal on this chart would be a bullish break of the MA5W, which would open a long entry for the very short term.
The base case on the short-to-medium horizon remains bear.
For the full Nikkei framework and the MA200W overextension thesis, see our Chart of the Week.
⚡ GOLD
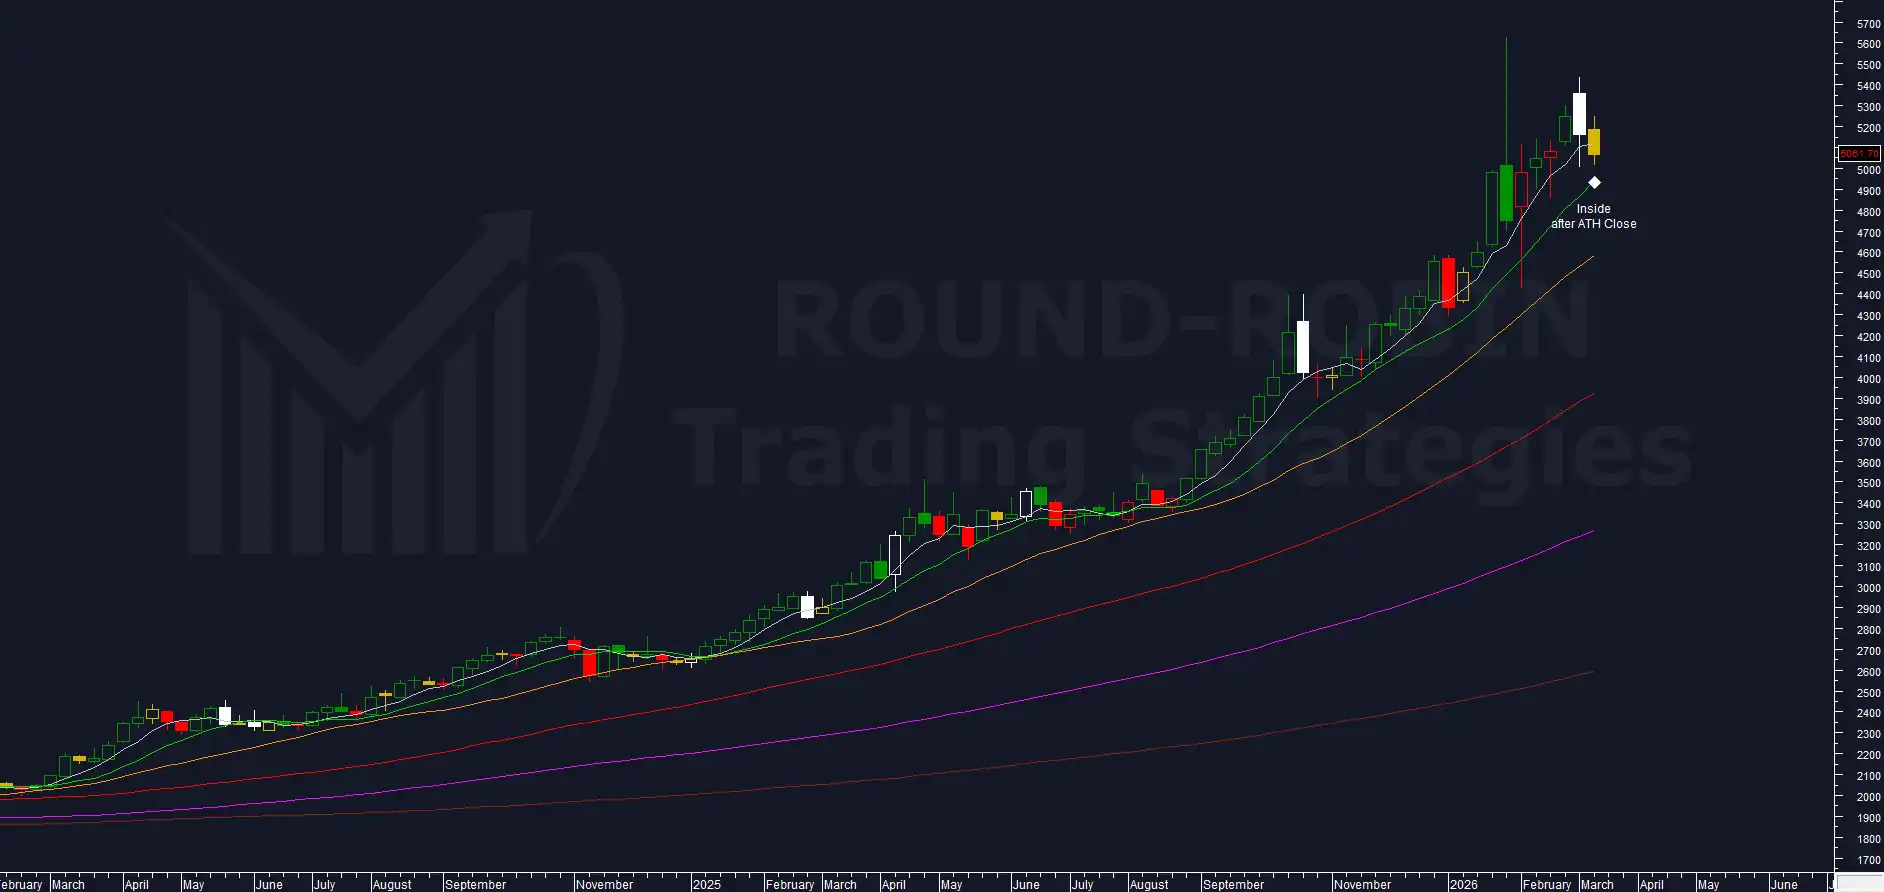
chart: Gold weekly
The MA5W gave way this week, but more importantly Gold printed an inside candle at all-time closing highs – a bearish signal in this context, and one that is sufficient to trigger a short entry.
Further confirmation will come with a move below the low of last week’s outside candle.
Short setup:
- Entry: ~5,061 (inside candle close)
- Stop: weekly close above 5,450 (~389 points)
- Target: 4,585 area (MA20W zone, ~476 points)
- Risk/Reward: ~1:1.22
Next week will tell us whether the Volatility + RSI countdown delivers its final bearish confirmation. For last week’s update, see our Charts Flash Week 10.
⚡ SILVER
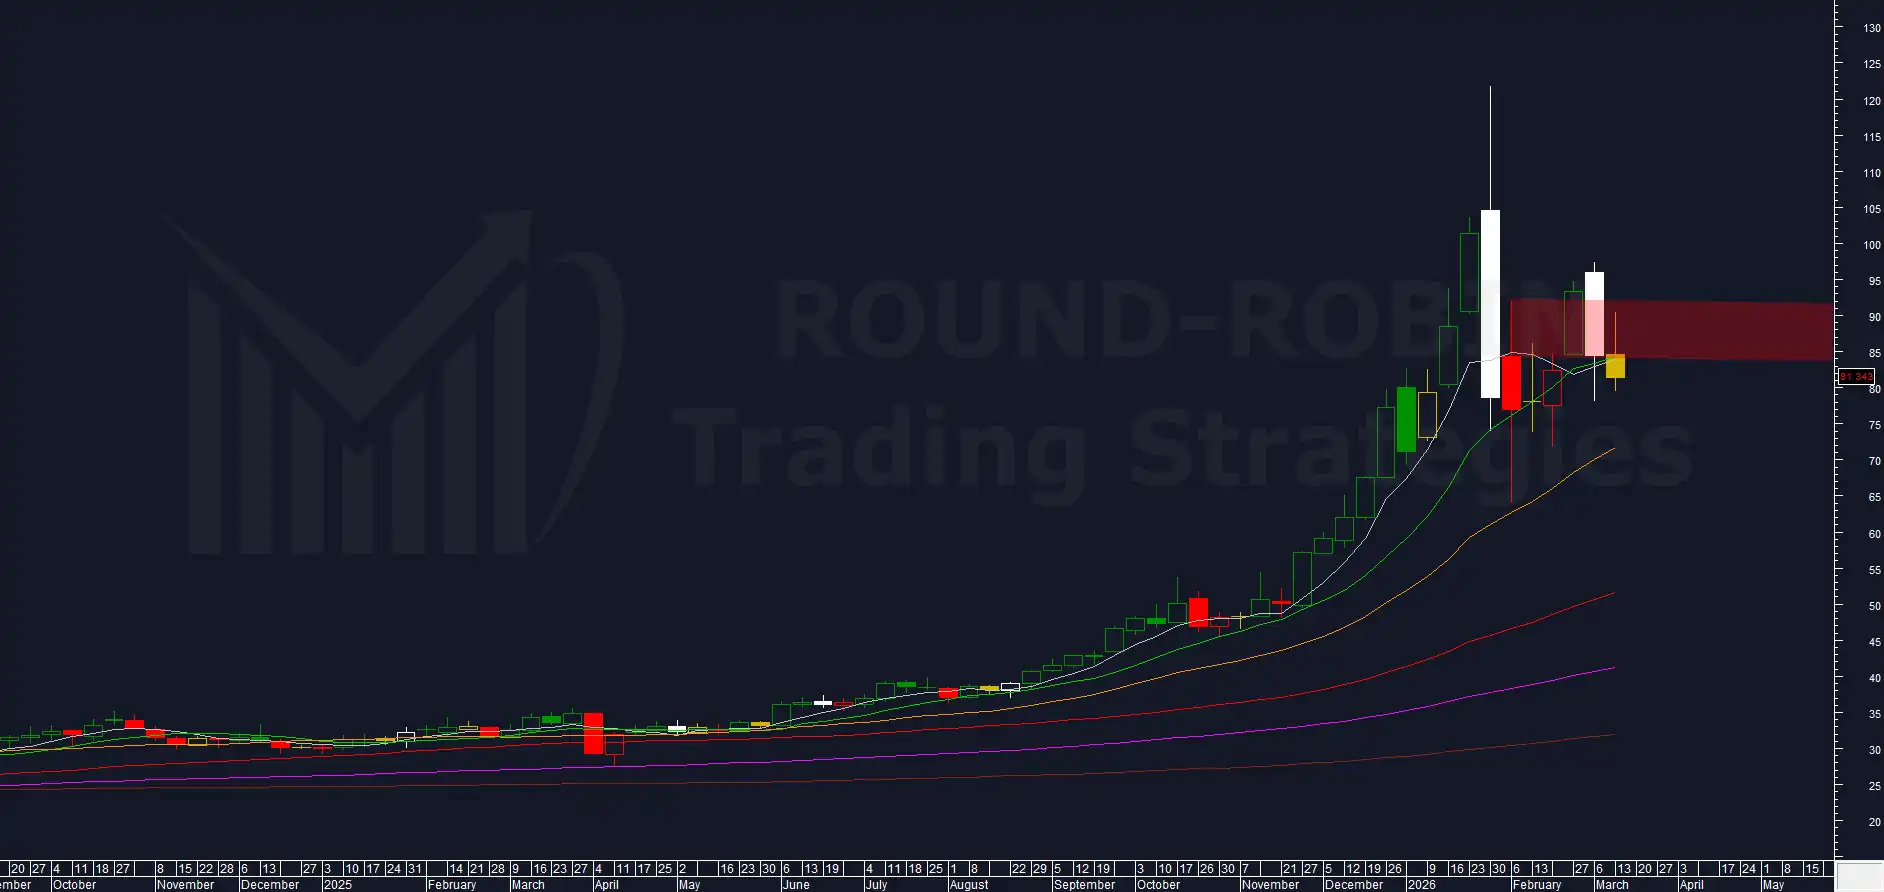
chart: Silver weekly
Silver mirrors Gold with its own inside candle – and goes further. Last week we said to watch for a weekly close below $82 for bearish confirmation.
That level has been broken, and the weekly close cut through both the MA5W and the MA10W – something that did not happen even after the crash at the end of January. This is a bear signal, and a meaningful one.
The caveat: the inside candle body is entirely contained within the shadow of the prior week’s candle, which means the signal requires immediate confirmation next week. If that confirmation does not arrive, it suggests stopping out and rebalancing.
Both Gold and Silver are now short. The spread trade paid out and it’s now closed. These are two independent short positions.
For last week’s update and the full Silver thesis, see our Charts Flash Week 10 and The Anatomy of a Bubble Burst.
⚡ BITCOIN
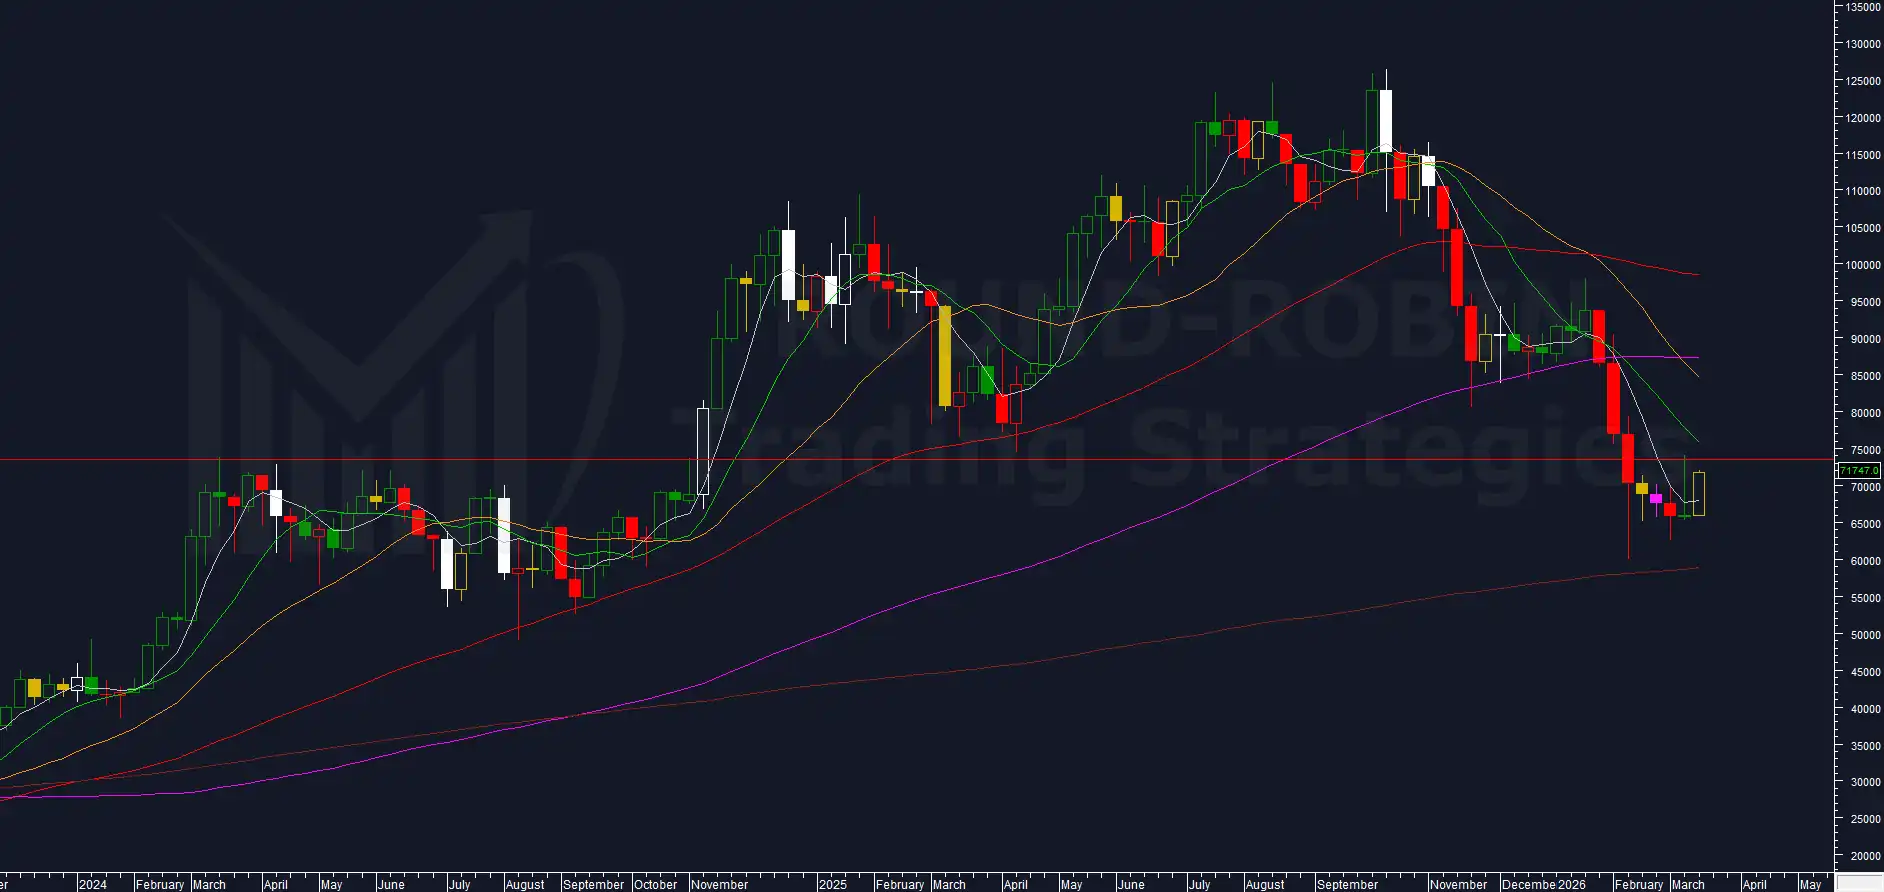
chart: Bitcoin weekly
Bitcoin prints an inside candle this week – but not a bearish one. The candle has reasonable size, closes above the open, and prices have recovered the MA5W, now trading around 72,000 and pressing back into the 73,000-75,000 resistance zone we have been watching for weeks.
Last week we said prices below the MA5W kept the bearish structure alive – that condition is now under pressure. Not enough to close the short, but more than a warning.
The short remains valid only if Bitcoin is promptly rejected from this zone again. For next week: watch the MA10W and the 73K-75K resistance.
A confirmed break above changes the picture. Until then, the $58,000 target remains intact.
For last week’s update and the full breakdown of levels and scenarios, refer to our Charts Flash Week 10 and Bitcoin Chart of the Week.
⚡ BRENT CRUDE
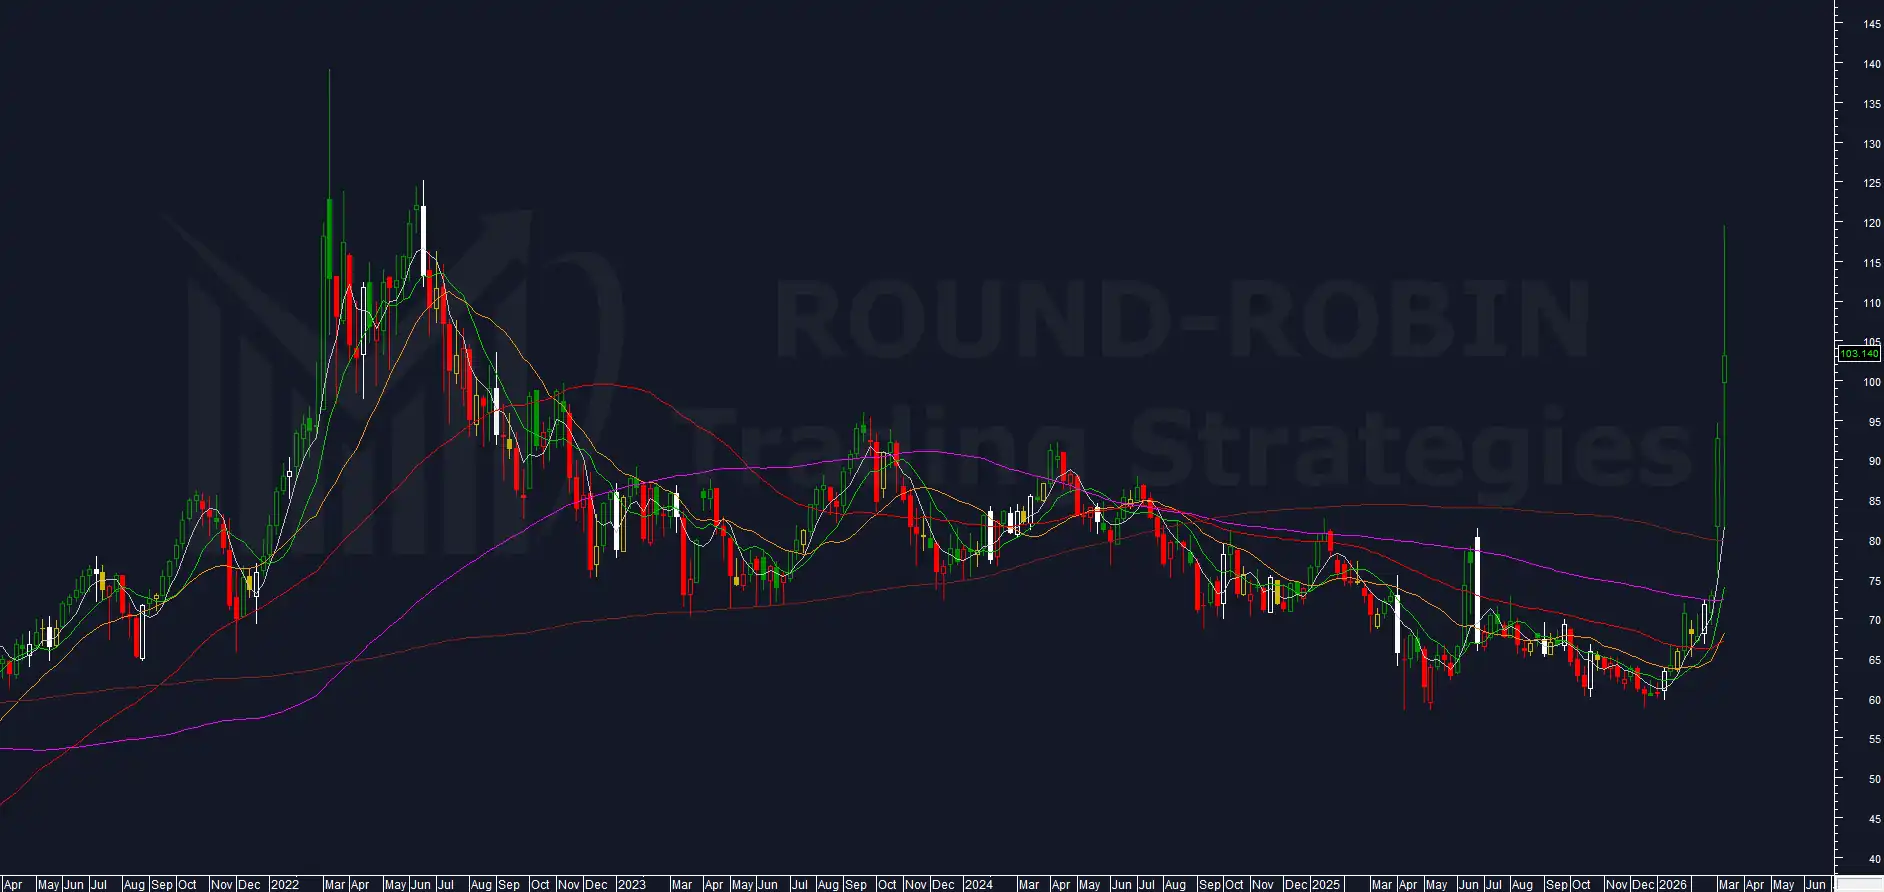
chart: Brent weekly
A chart that demands attention. From a low of $60 on January 2nd, Brent nearly doubled to a high of $119.50 – and the week just closed with a weekly range of 47.24%, the third largest in 25 years. Only the week of April 26, 2024 (76.78%) and April 3, 2020 (48.00%) were wider – though in 2020 Brent was trading around $20, making the comparison largely meaningless in absolute terms.
In dollar terms, the current range of $38.34 is an all-time record, surpassing the $33 registered in March 2022.
What do these range extremes historically signal? Excess.
The kind of volatility spike that, once exhausted, tends to revert.
Our volatility indicator has reached levels seen only during the Covid period – which suggests it is too early to enter short, but not too early to start watching.
The working hypothesis is that extreme events tend to repeat in their outcome: these are the conditions that precede major reversals, not the reversals themselves.
Brent goes on the radar.
Soon only members will be able to access this content. Sign up for free.
Leave a Reply