


Weekly monitoring of the Italian benchmark index.
Why do we do this?
Check out our strategy page.
My proprietary DBBT indicator identifies misalignments between current price and expected technical level on major indices.
Every week, the FTSE MIB is in our crosshairs.
The hunt is on.
Another short week, another bull run.
The FTSE MIB posts a new closing high for 2026 at 47,609.36.
The market seems to be back to shrugging off the real or perceived dangers of the war in Iran, every day everything and its opposite is said and we are back to good news is good news and bad news is good news.
The weekly high at 47,770.38 surpasses the previous top at 47,650.97 but the market fails to close above it.
Let’s try to understand if this is just a coincidence or if at these levels prices are starting to look a bit stretched.
Bulls vs Bears
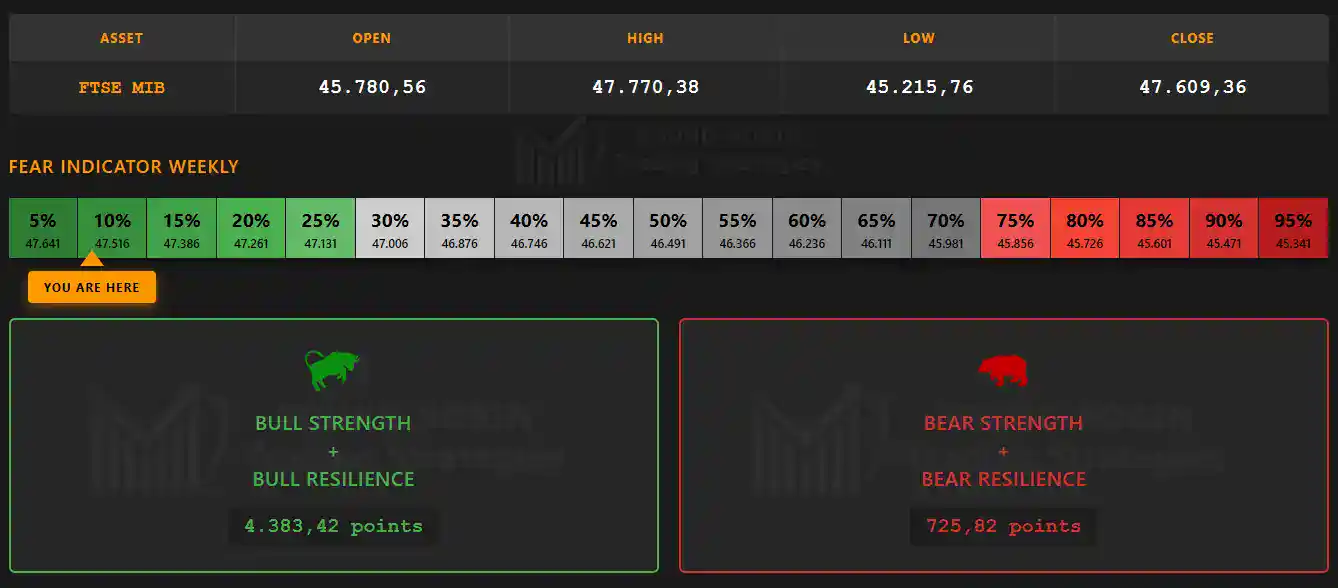
Open 45,780.56, High 47,770.38, Low 45,215.76, Close 47,609.36.
Weekly close at 47,609.36: a 4.35% gain over the previous weekly close.
Bull Strength and Bull Resilience total 4,383.42 points. Bear Strength and Bear Resilience stop at 725.82.
Total bull dominance, no debate. The Fear Indicator sits at 10%, almost no one is thinking about hedging.
The Big Picture
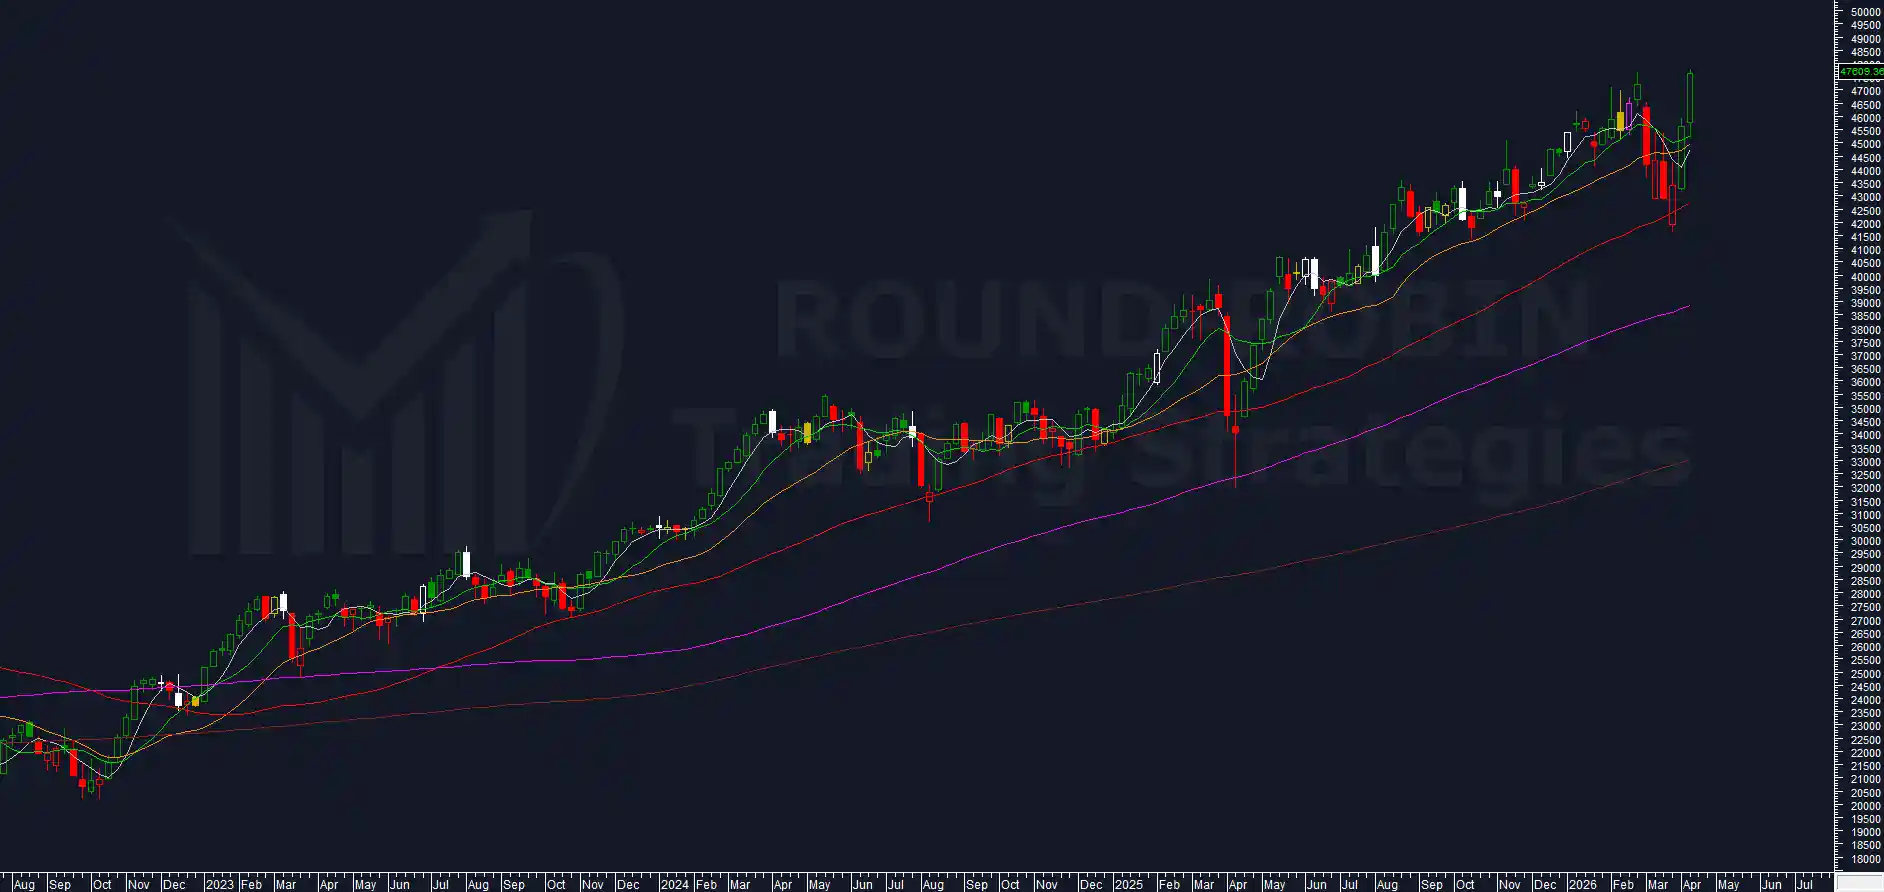
Another large-bodied candle with higher highs and higher lows. The weekly low rested perfectly on the MA10W.
This is not just hysteria. It is also the opposite of what technical analysis textbooks teach: declines are typically faster than rallies. In this case it took 5 weeks to go from the high to the low and only 3 to cover the same ground in reverse.
Pure strength, but neither healthy nor sustainable in the medium term.
Once again an angle of ascent that has already proven unsustainable in the past: last week’s lows had increased by roughly 1,500 points over the previous week, this week’s by over 2,000 from last week.
All moving averages are positively sloped. This week the MA5W turned back up and sits slightly below the MA20W and the MA10W. If it realigns above both, we could see a new bullish impulse.
Volatility Indicator
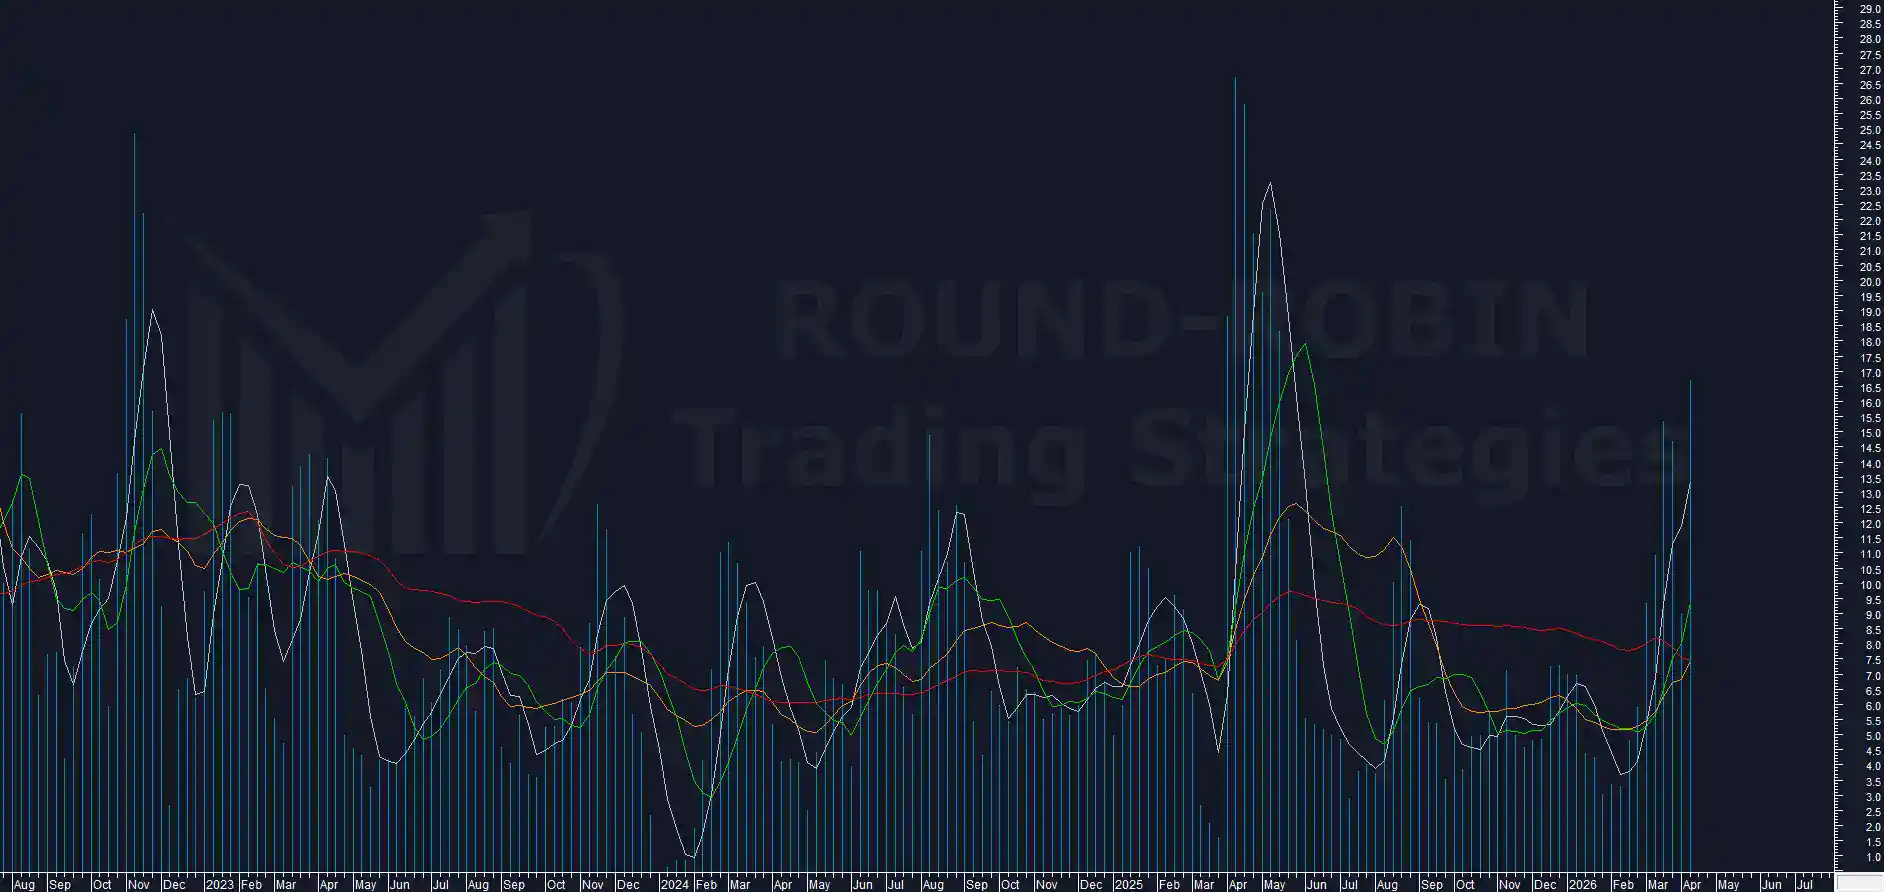
The violent spike and new yearly high at 16.74% was the setup that contributed to triggering the EXIT LONG in our system.
For the FTSE MIB rally to be considered sustainable, it should have been accompanied by a reduction or stabilization of the indicator. Instead, it reached its highest point for 2026.
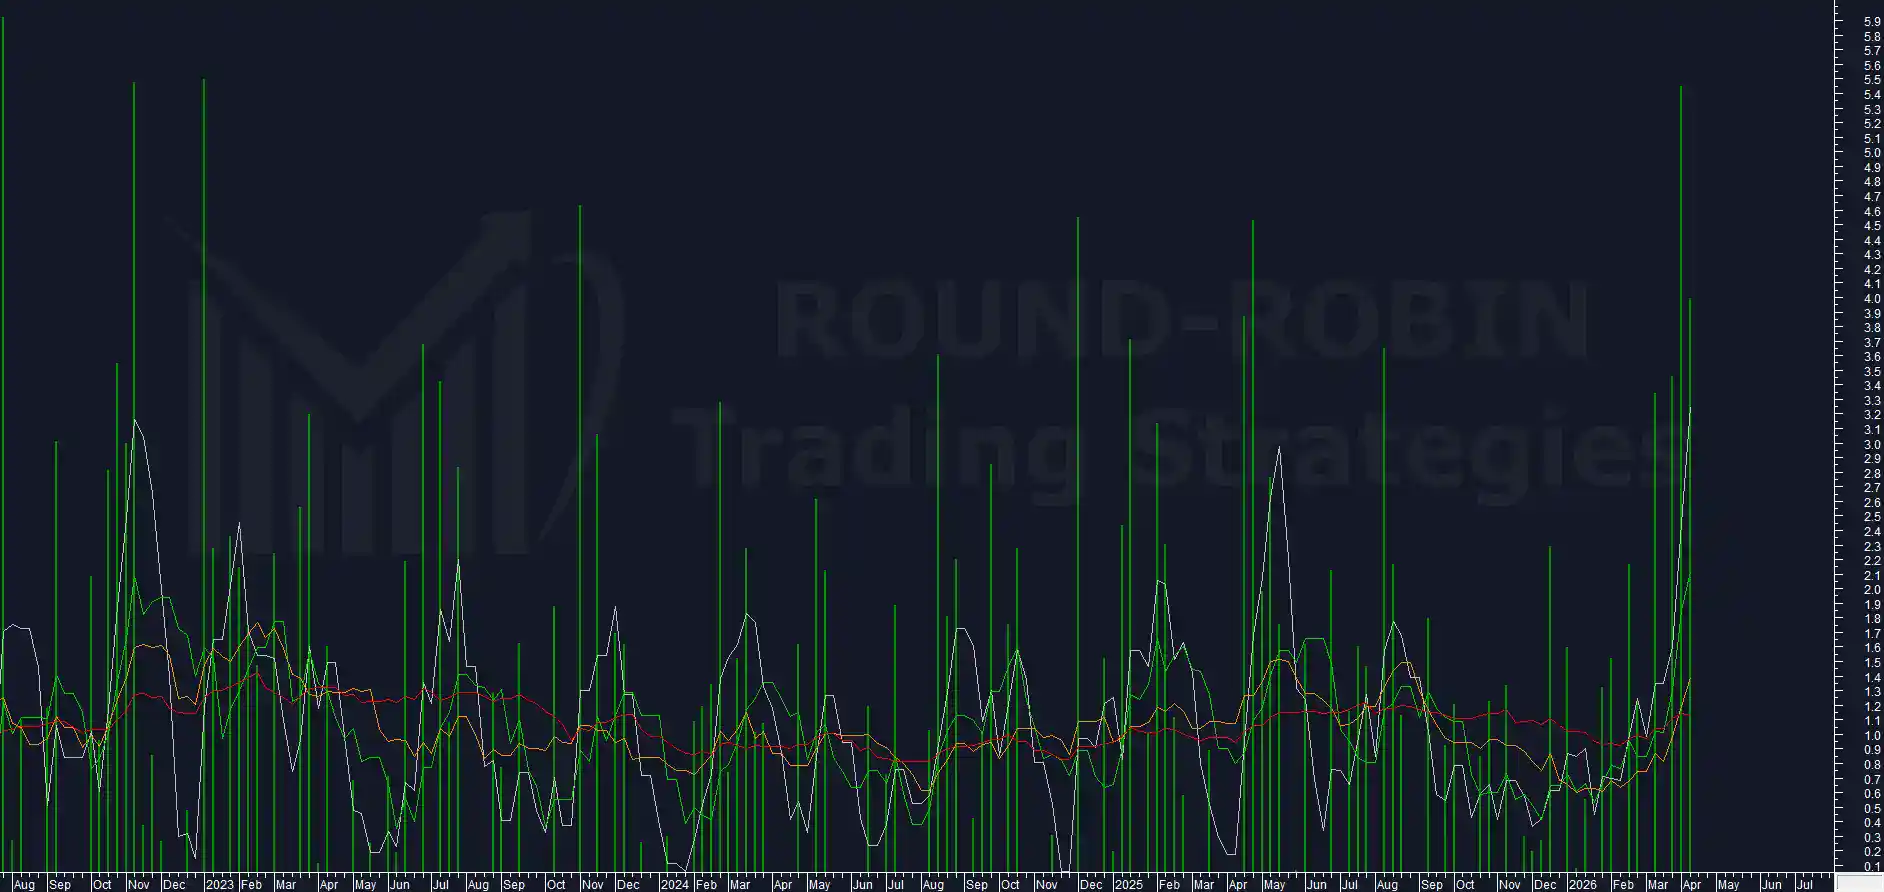
Range Weekly %
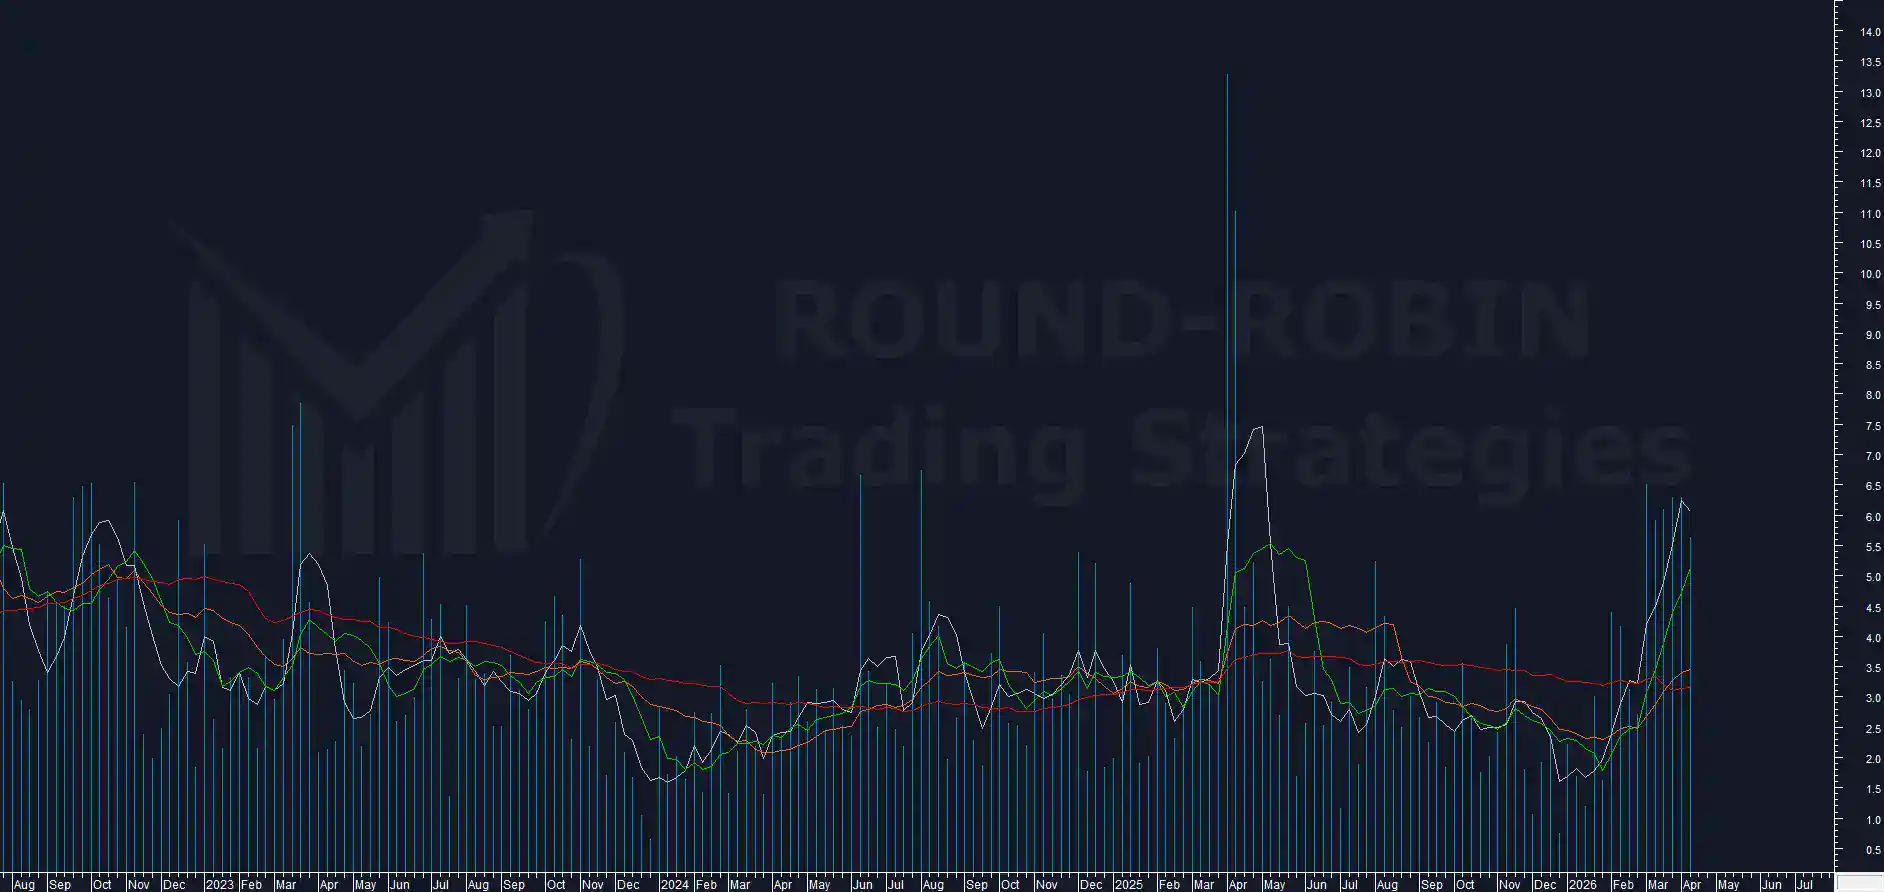
This week too, despite only 4 trading sessions, the range exceeds 5% (5.65%), albeit down from the previous week (6.31%).
That makes 6 consecutive weeks above 5%. The MA10W of the range has now reached 5.13%, matching the levels seen in March-April 2025.
Range and Volatility Indicator are a necessary but not sufficient condition for the Exit Long because other elements supporting the short-term trend could intervene.
Classical oscillators and indicators still have plenty of room.
BCP3
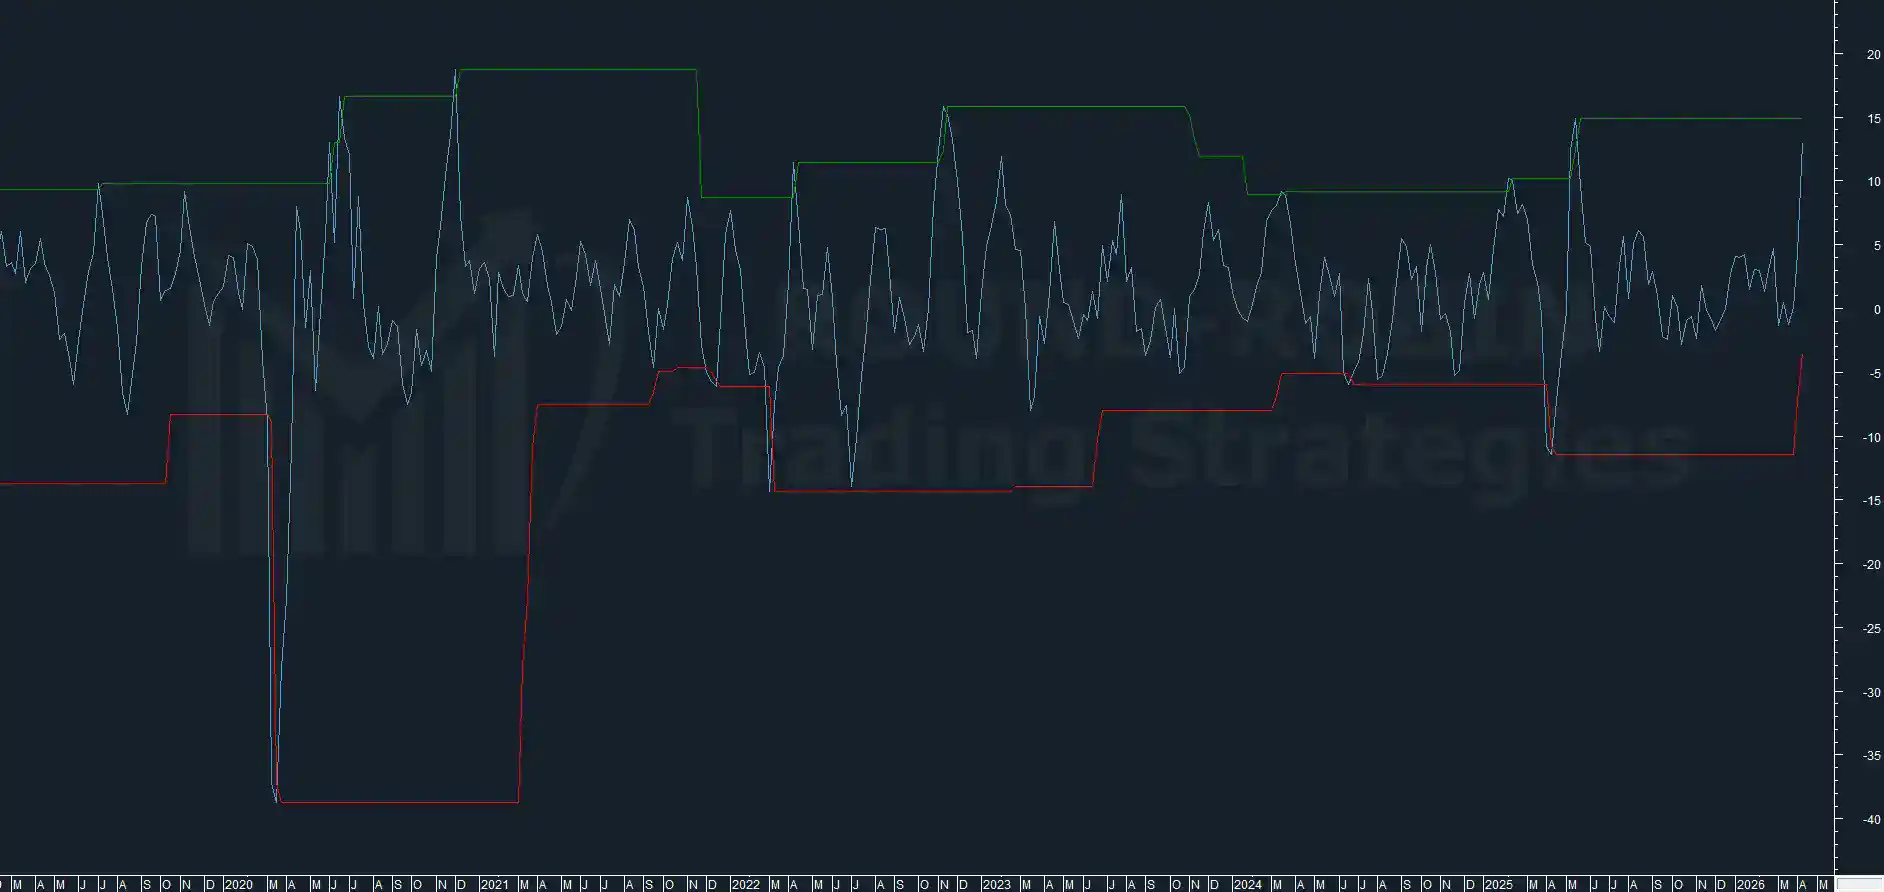
The bullish swing is practically complete: 12.97% against the 14.89% level. There might still be a small window to extend, but the remaining gap is not wide enough to avoid the Exit Long signal.
The risk of holding is calculated as greater than the risk of missed gains from an early exit.
Body %
The body has settled at 4%, still very large: the fourth widest in the past year.
This too is aligned with an exit on high probability of momentum decline.
In our latest analysis we noted that record candles like last Friday’s close (April 3rd) had coincided with at least a short-term market bottom 9 times out of 9.
This week the count rises to 10 out of 10.
This week’s is the third consecutive large bullish body.
The system assumes that a fourth bullish body of significant size is unlikely: in practice, momentum could fade.
Conclusion
The system rode the trend well, stepping in on trend following and riding the wave of the largest bullish body in terms of points since 2001.
The 47,300 target was reached and surpassed in a single week, not the usual three.
The stress on the indicators and oscillators within our system signals a potentially toppish situation.
There are no reversal signals, only conditions under which the market could slow its ascent and push the risk/reward ratio of holding the position below 1.
Our system goes flat and will likely remain so for at least 2 weeks, waiting for rare high-probability setups.
In the meantime we will continue to monitor both bulls and bears to provide a weekly technical commentary as well.
Leave a Reply