


Weekly monitoring of the Italian benchmark index.
Why do we do this?
Check out our strategy page.
My proprietary DBBT indicator identifies misalignments between current price and expected technical level on major indices.
Every week, the FTSE MIB is in our crosshairs.
The hunt is on.
The rally is not slowing down.
The FTSE MIB closes the week at 48,869.43, a new multi-year closing high, with a high of 48,957.89 also a record. Roughly 1,260 points above last week’s close.
In our latest analysis we flagged potentially toppish conditions and the system had gone flat.
The market responded with yet another strong rally week, the third consecutive one with higher highs and higher lows.
As always, let’s dig into what happened and what the numbers are telling us.
Bulls vs Bears
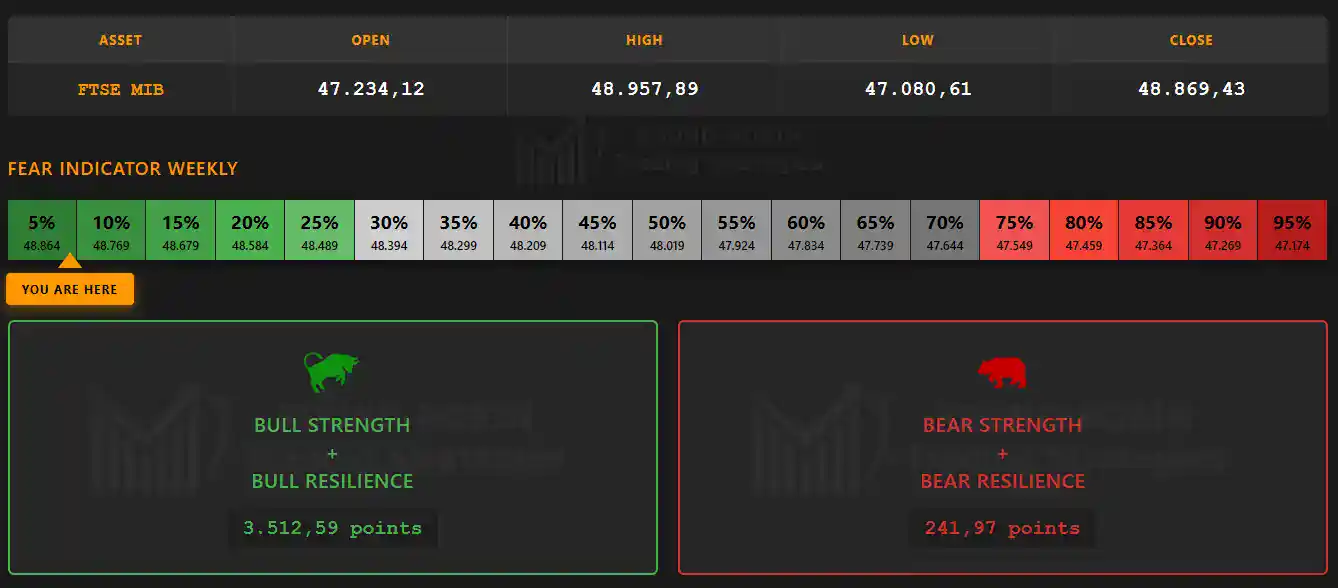
Another one-sided week. The bull-to-bear strength ratio exceeds 14 to 1.
The Fear Indicator hits 5%, the lowest level on the scale.
Total complacency: nobody feels the need to hedge, nobody is pricing in the risk of a reversal.
The Big Picture
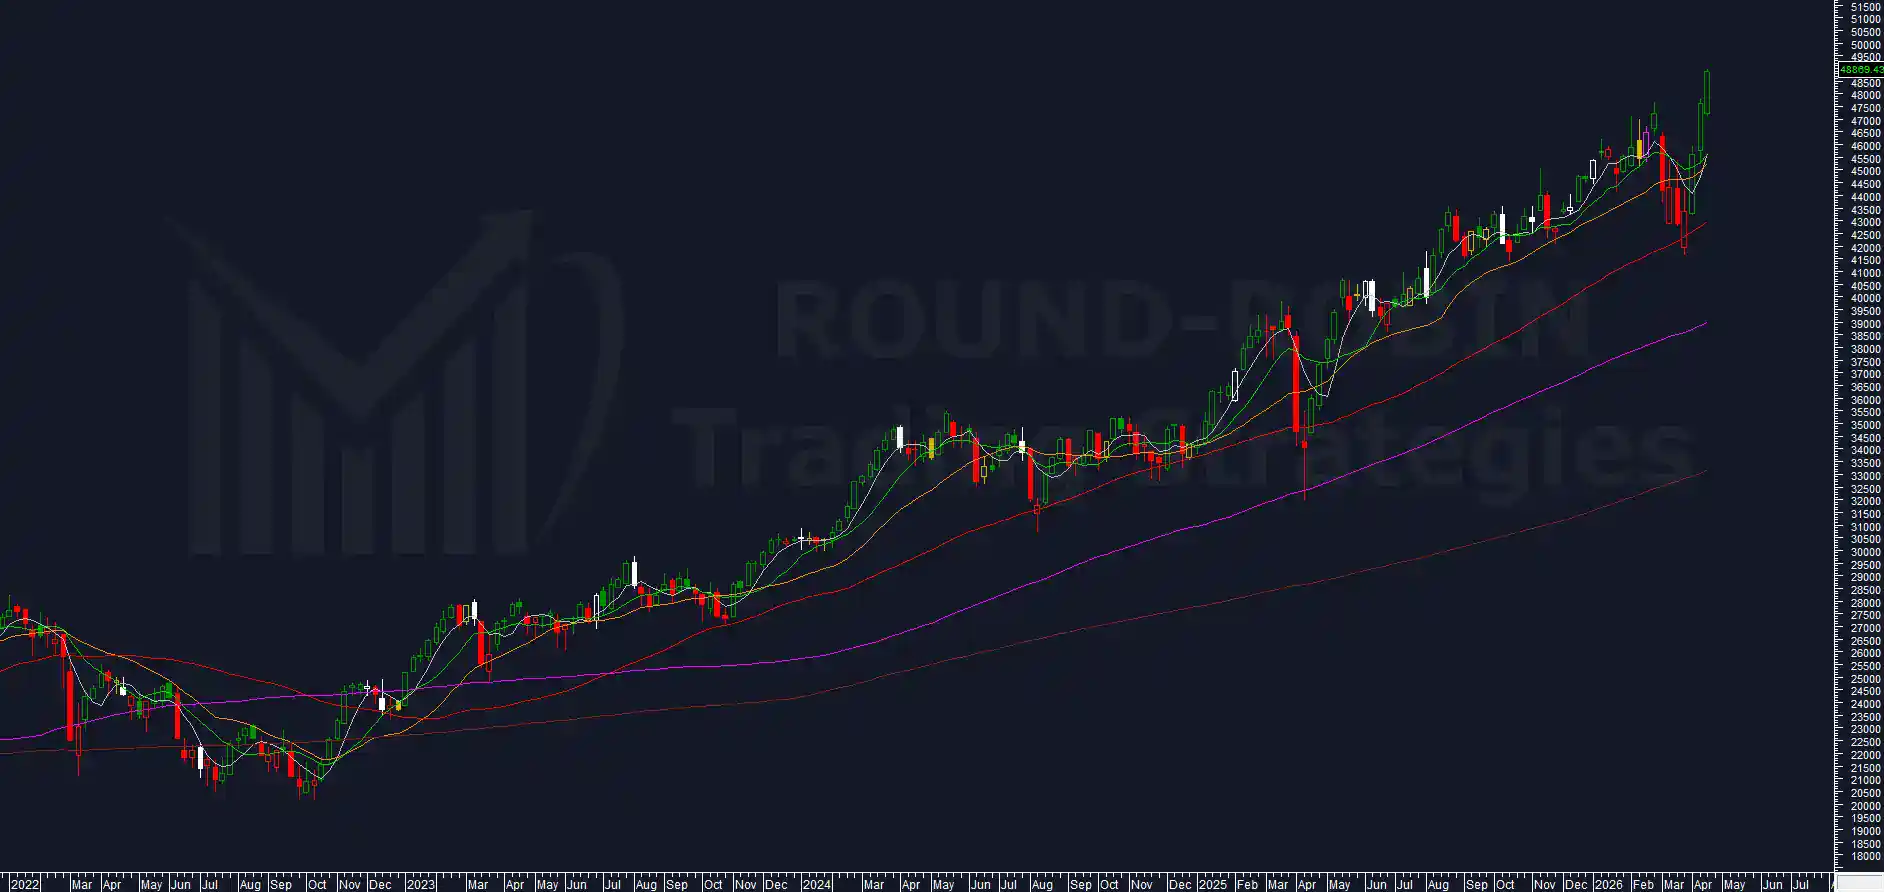
Third consecutive candle with higher highs and higher lows.
All moving averages are back in perfect alignment after the MA5W crossed back above the MA10W, showing decidedly strong momentum.
Worth noting: a 3.10% overextension on the MA5W. A spike above 3% has only occurred three times in the past three years:
- May 2025 – toppish
- January 2023 – bullish continuation, later entirely reabsorbed
- November 2022 – toppish
Two out of three marked a temporary high. The third produced a rally that the market eventually gave back in full.
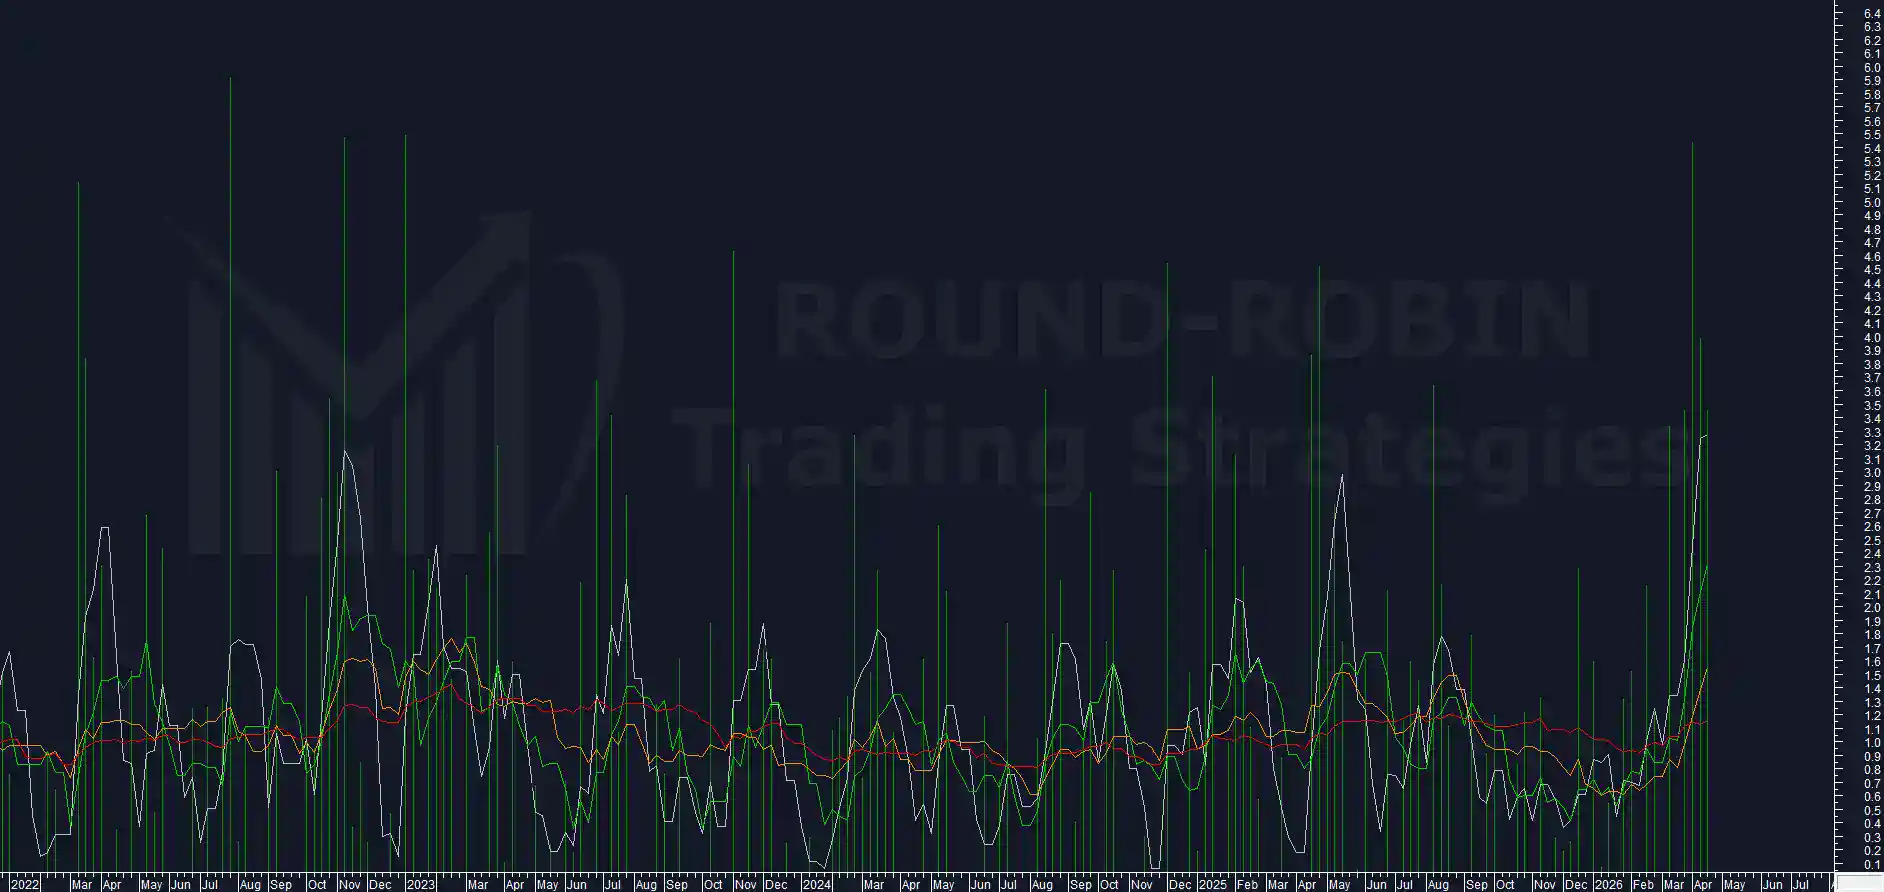
Volatility Indicator
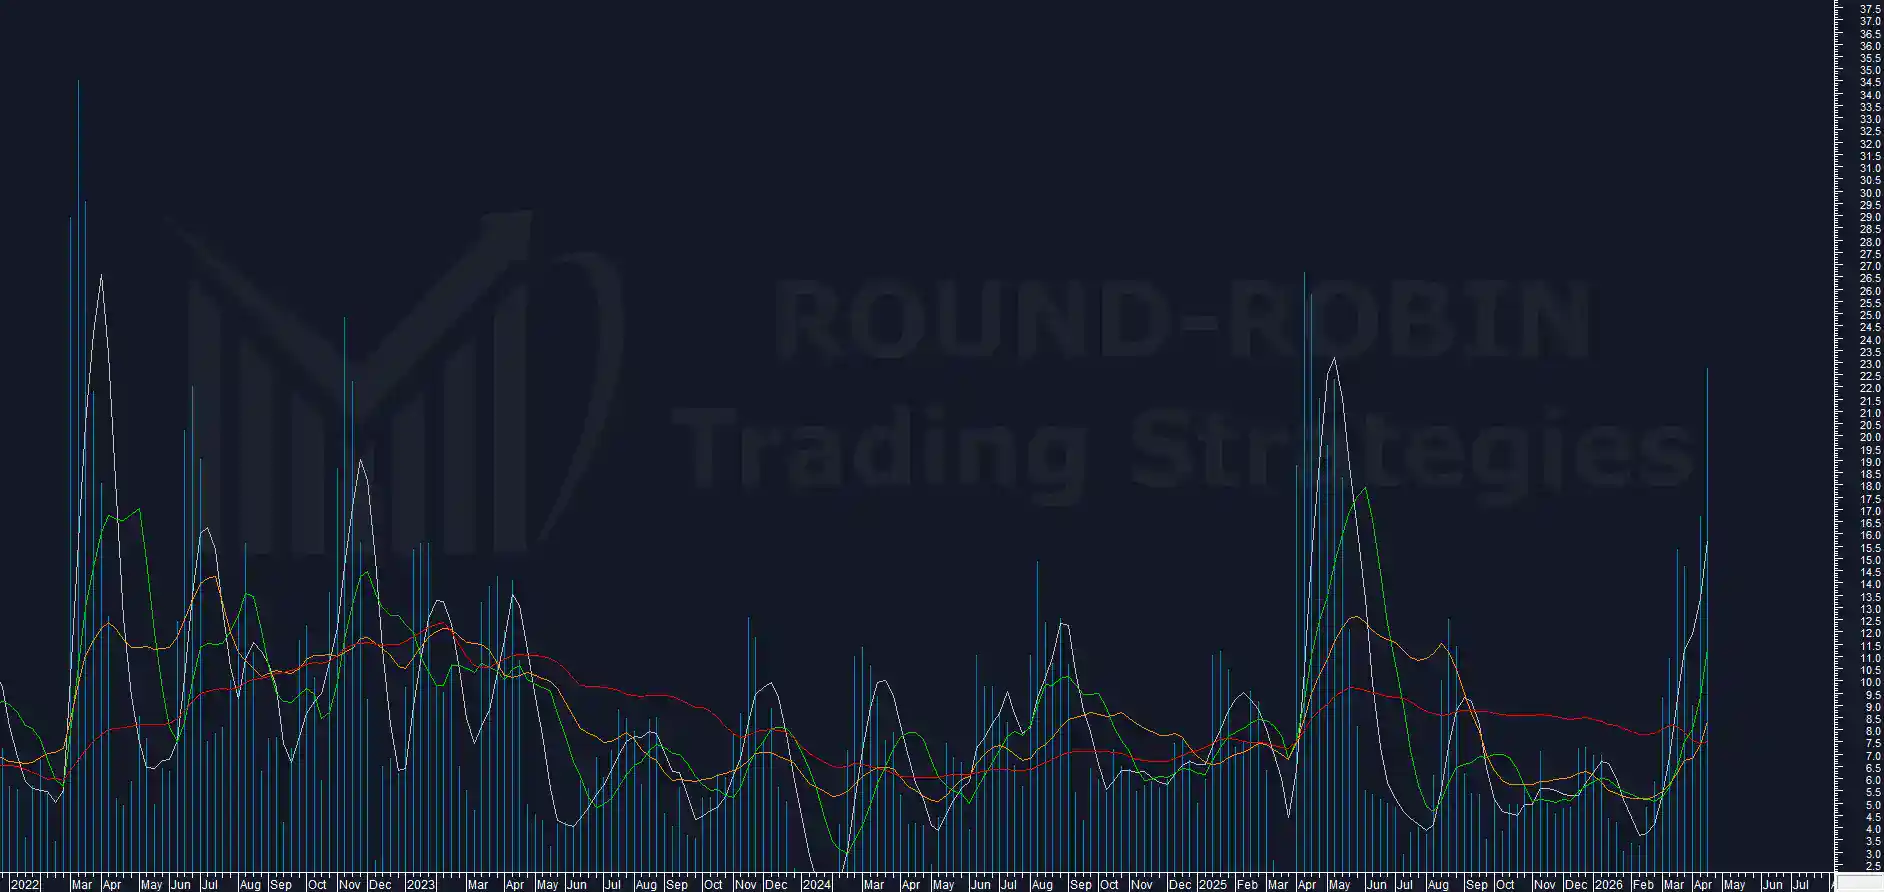
Another spike in the indicator, now at 22.80%, the fourth highest reading since 2022 regardless of trend direction.
To find a toppish reading above this level we have to go back to November 2020: the market topped out for a few weeks, dropping from 22,387 to 21,087 (-5.81%), before resuming its uptrend. A similar situation occurred in December 2016.
Further confirmation of a possible toppish setup, as already observed through other indicators.
Range Weekly %
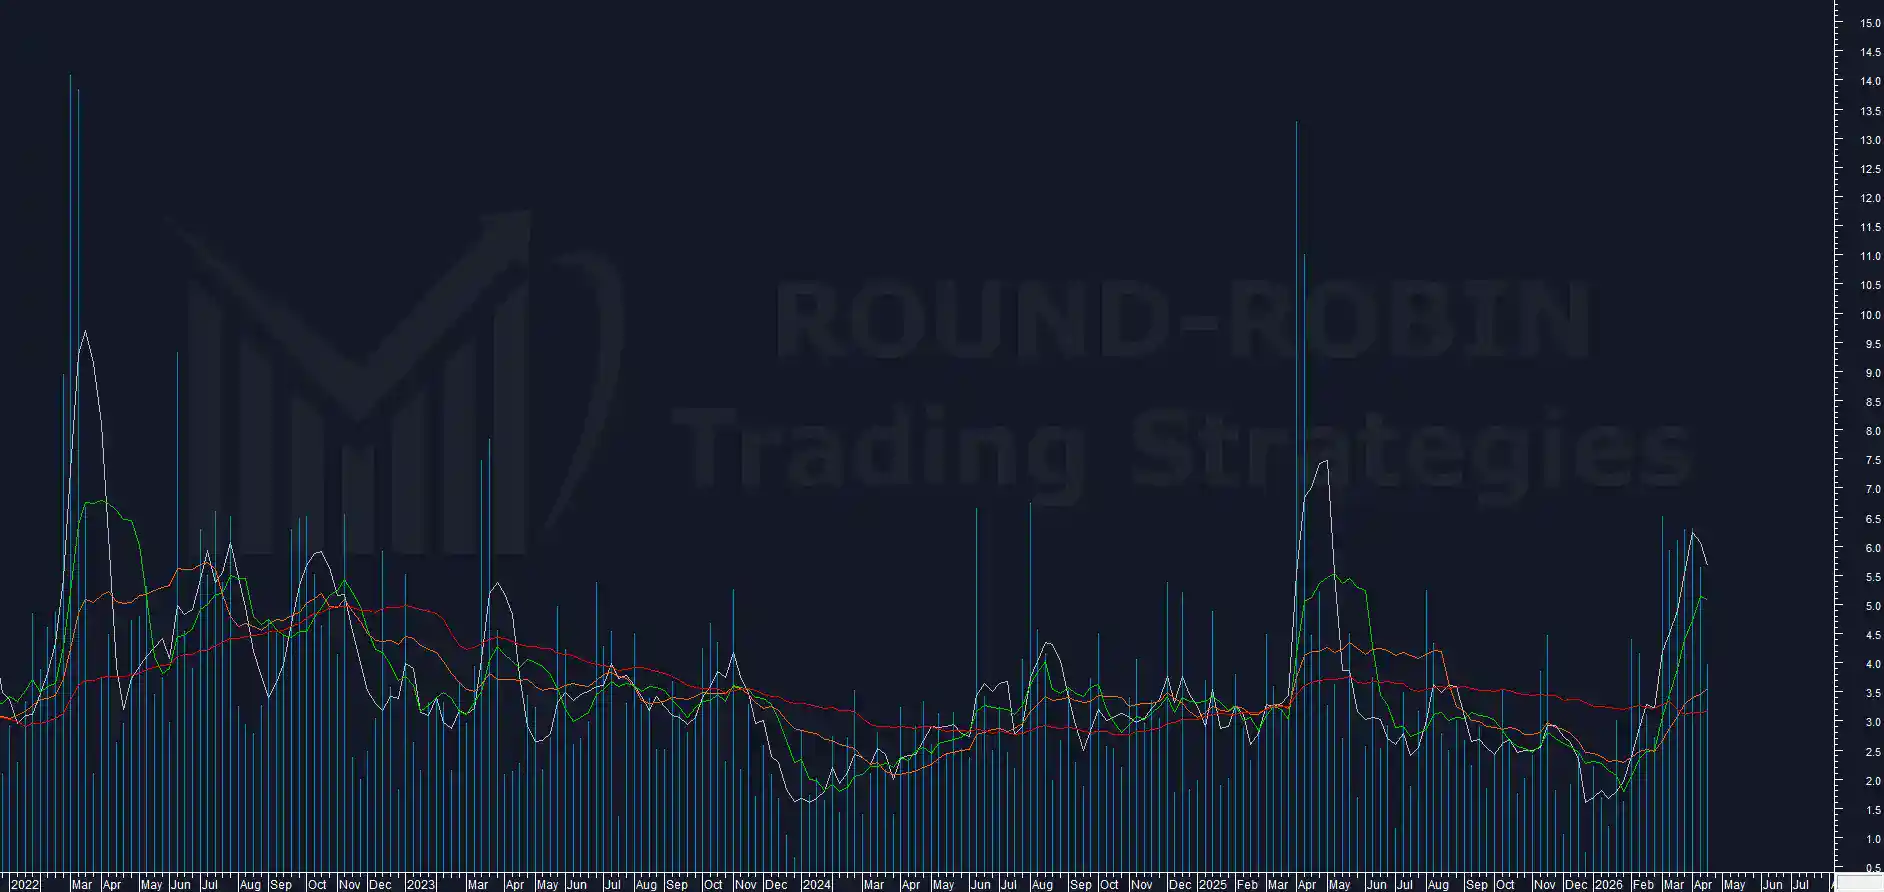
The weekly range drops to 3.99%, sharply lower than last week’s 5.65%. The streak of 6 consecutive weeks above 5% comes to an end.
The declining range in a context of rising risk could also align with a toppish reading, but it needs to be accompanied by other elements to support this interpretation.
BCP3
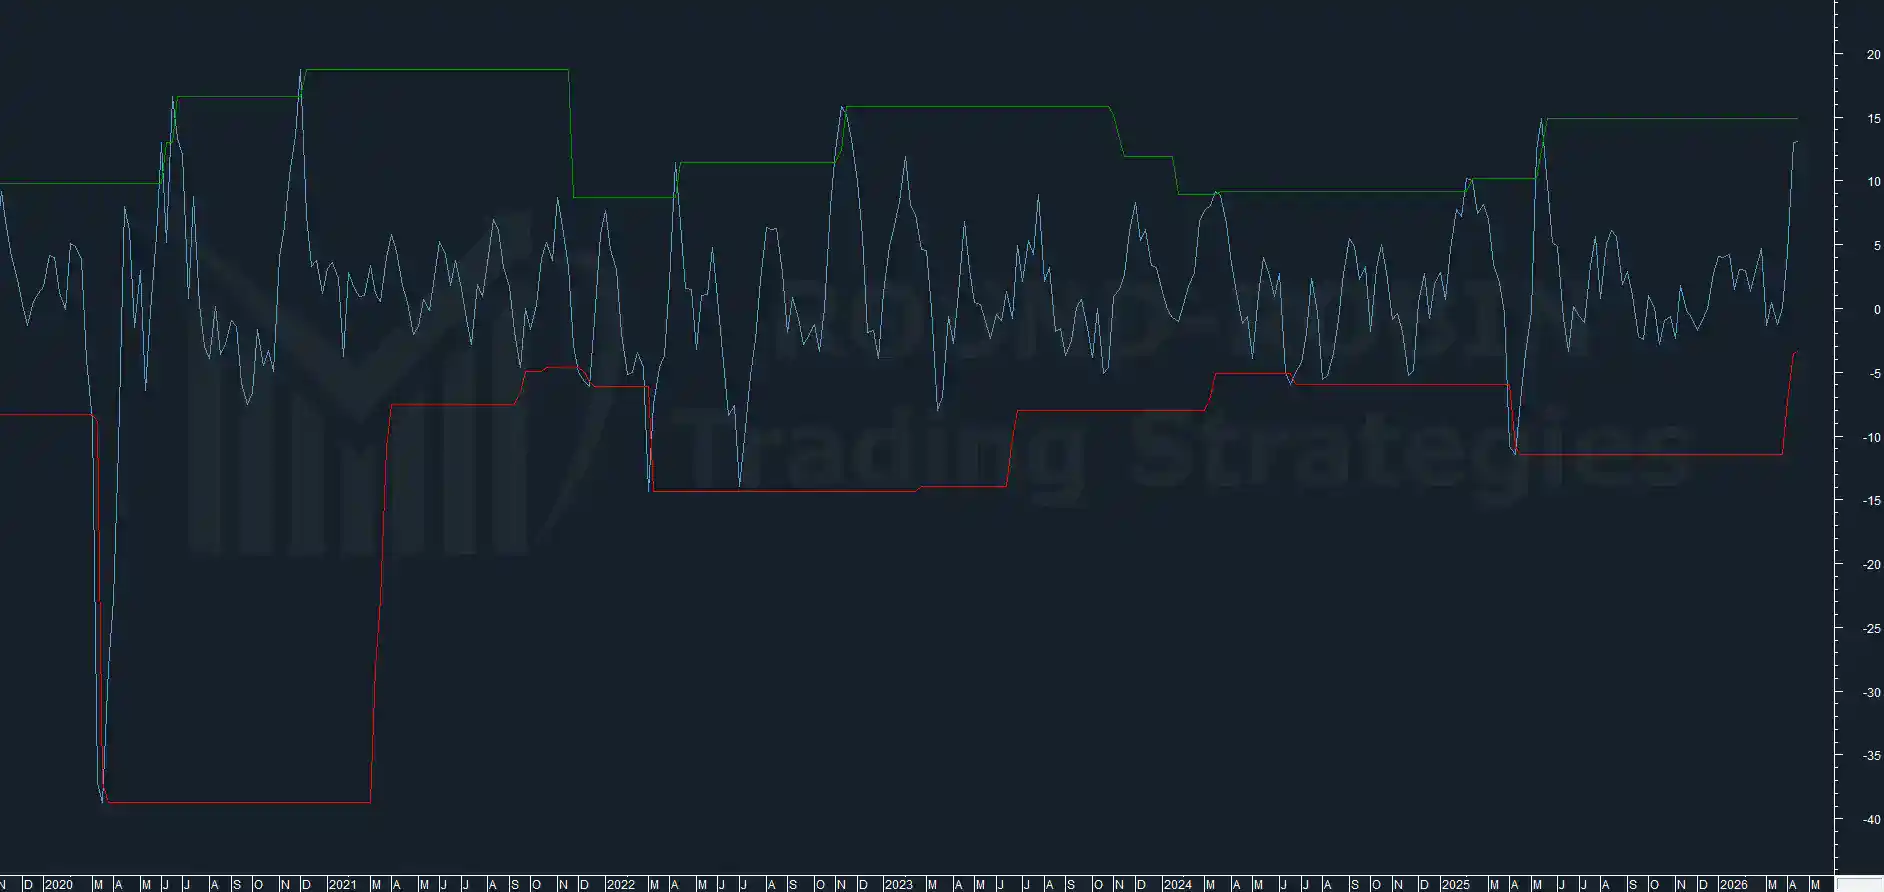
This indicator is showing strain more than any other. The swing is struggling to push toward 15% and we can only repeat what was said last week: statistically, the upside room is limited.
But tail events do exist and we cannot rule out that this is one.
My approach is to always consider the most probable scenario, which remains toppish.
Body %
The body has decreased compared to last week but the count of consecutive large bullish bodies has reached 4 weeks. 5 consecutive weeks were last seen a year ago. For longer streaks we have to go back to early 2024, in a completely different context.
Consecutive higher closes have also reached 4 weeks in a row. To see 5 consecutive we have to go back a year, and beyond that to early 2024.
Conclusion
Despite the market rising, and quite decisively, last week’s considerations remain fully valid.
The rally has pushed beyond expectations and the system clearly exited too early: we can say this in hindsight, with over 1,200 points of upside after the exit.
However, the decline in range and body tells us that, despite the total absence of sellers, buying pressure has diminished.
We have highlighted a series of toppish elements, to which this week we add the overextension on the MA5W.
This last indicator tells us something important: should this setup not prove toppish, contrary to what virtually every indicator we have analyzed suggests, any further rally from these levels will have to be considered a bull excess. It should not be fought, but followed with the awareness that the expectation is for a complete retracement.
The system remains flat.
Leave a Reply