


Quick observations on the charts that caught our eye this week.
This week’s flash covers EUROSTOXX50, Brent Crude Oil, Bitcoin and S&P 500.
Gold and Silver remain flat with no relevant changes and are not updated.
EUR/USD and DAX show no significant developments.
The Nikkei 225 will have a dedicated deep dive in the Chart of the Week.
The EUROSTOXX50 prints its fourth consecutive positive week with a wide body, low resting on the MA20W and MA10W and high still below the level that kicked off the decline in early March.
Brent is rejected from its recovery attempt and collapses violently, breaking the MA10W and closing fractionally below last week’s low.
Bitcoin marks its second consecutive week of higher highs and higher lows but is rejected at the MA20W.
The S&P 500 prints a new all-time high with an exceptionally large bullish candle and the widest weekly range since April 2025.
Let’s go into a bit more detail and try to figure out what lies ahead for next week.
⚡ EUROSTOXX50
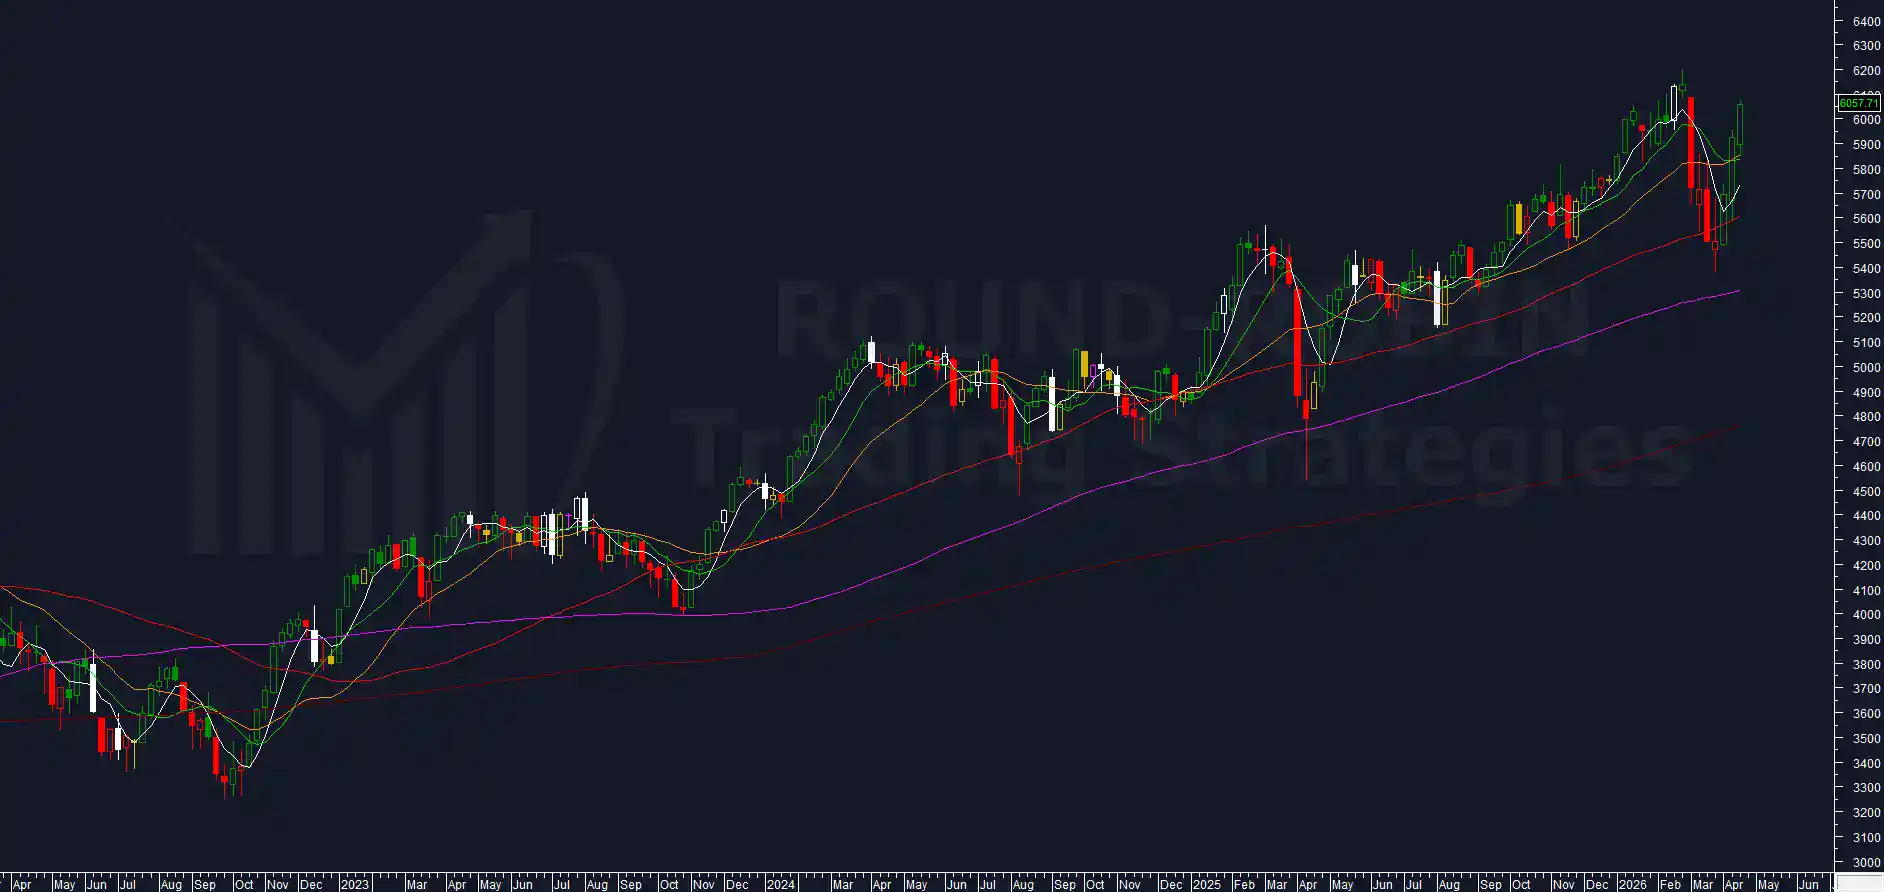
chart: EUROSTOXX50 weekly
Our Chart of the Week last week indicated room for one final positive week before a physiological pause, with the body counting and close counting at the natural ceiling of four consecutive weeks.
The candle was indeed less extended than the previous one but with a significantly wider body than expected. The low rested on the MA20W and the MA10W and from there prices bounced back to the upside.
The MA20W, whose bearish break had kicked off the decline, was perfectly tested as support and from there the bullish impulse started. Weekly close at 6,057.71.
The high at 6,073.55 remains below the high of the candle from the week of March 6 (6,086.79) that had triggered the selloff.
Fourth consecutive week for the body counting.
Worth monitoring next week whether the proximity to the highs will trigger at least a pause and a weekly close below the open.
⚡ BRENT CRUDE OIL
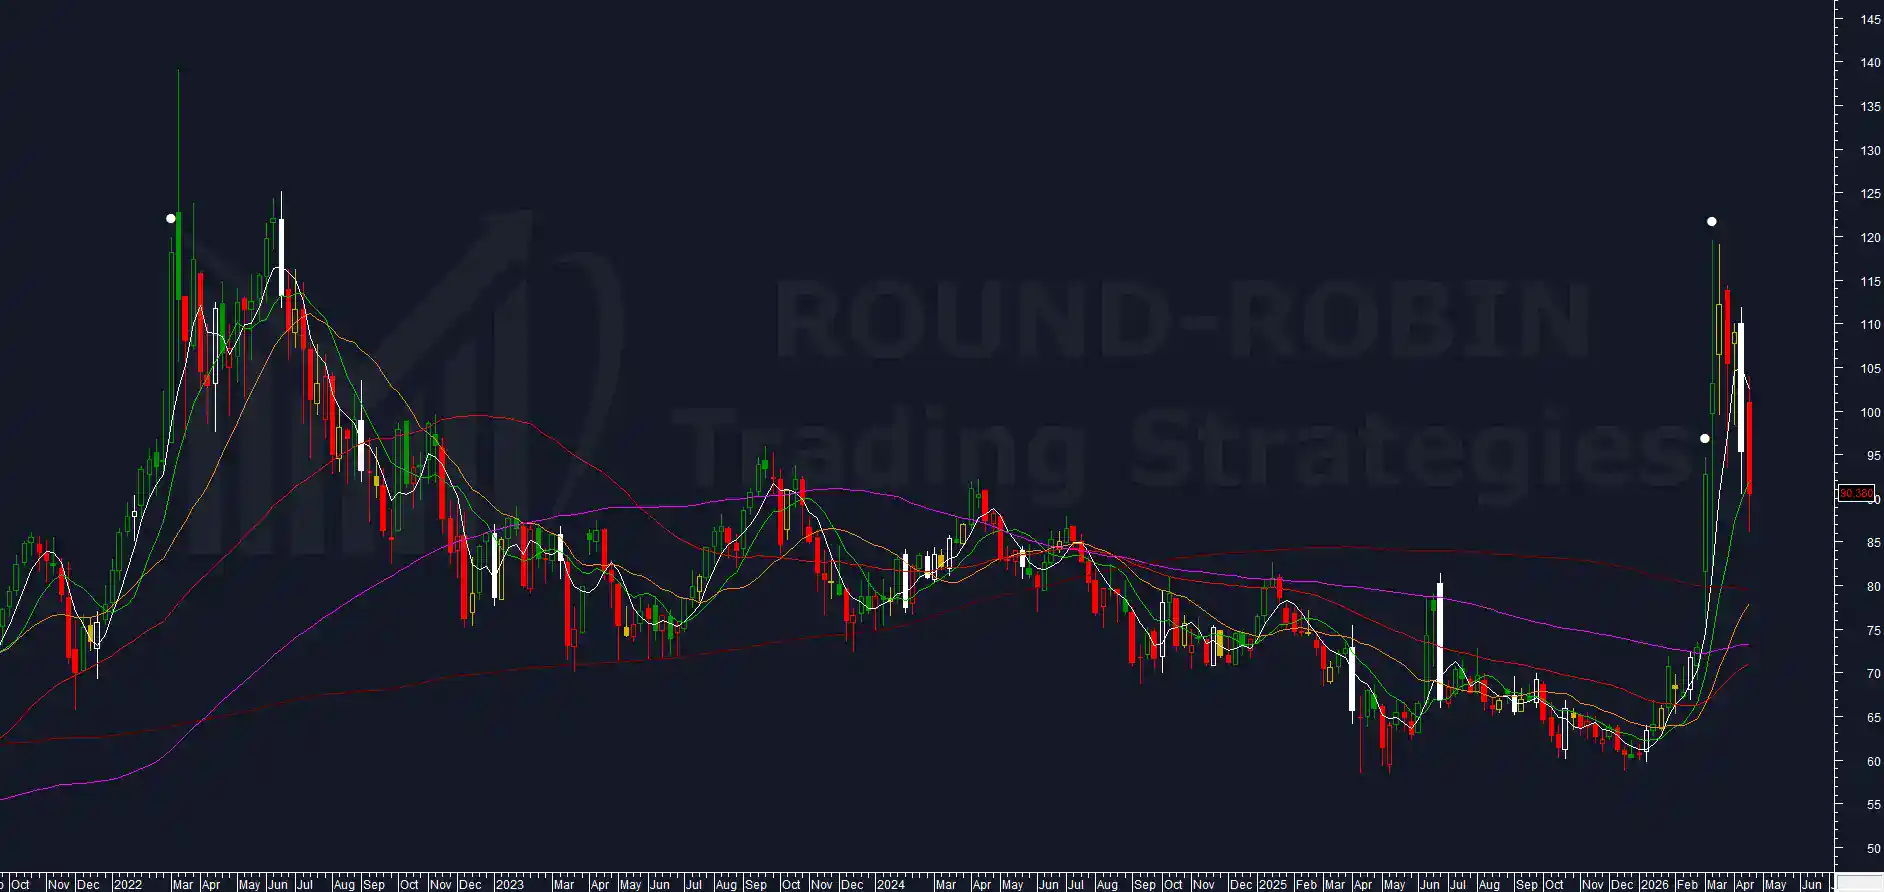
chart: Brent Crude Oil weekly
Last week the position remained short but very close to the exit trigger.
A close above the MA5W would have been the necessary and sufficient condition for the exit short.
The recovery attempt above the MA5W failed. Prices were rejected and collapsed violently, with a break of the MA10W.
However, prices remained above the lows of the massive candle from the week of March 13.
Weekly close at 90.38, fractionally below last week’s low (90.40).
Bearish momentum confirmed, although not convincingly. A good step forward that could lead to a continuation of the move toward the target at 80 indicated in our Chart of the Week Week 13.
For last week’s update, see our Charts Flash Week 15.
⚡ BITCOIN
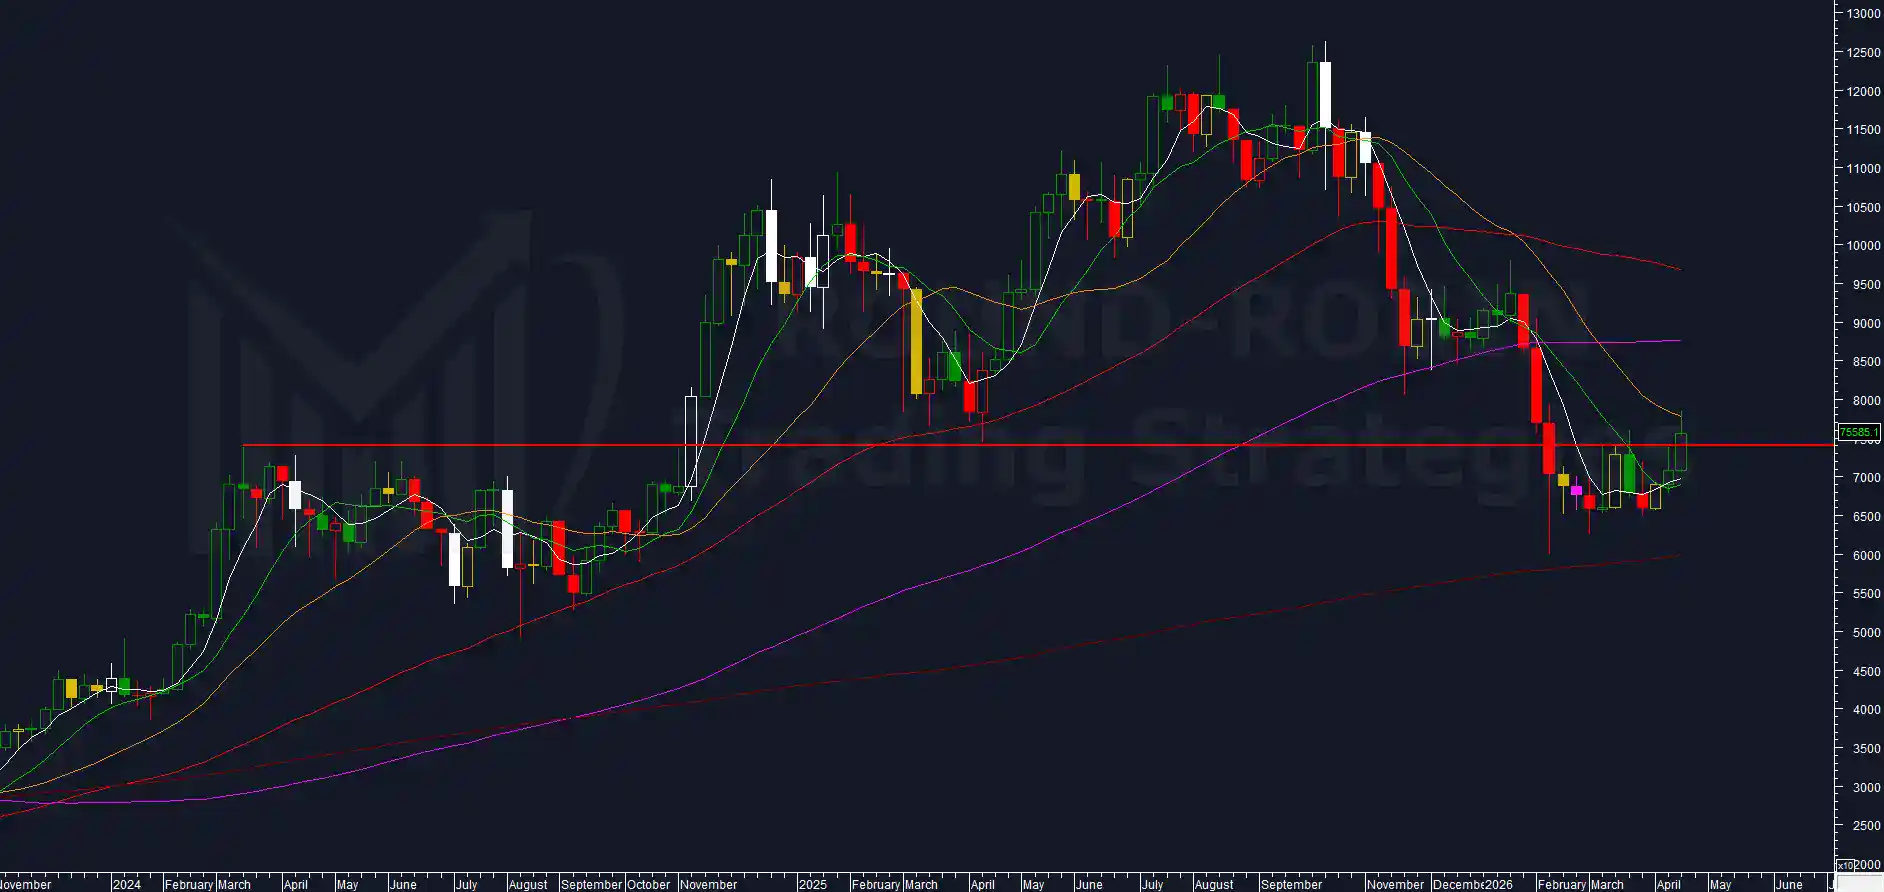
chart: BITCOIN weekly
Second consecutive week of higher highs and higher lows and third with higher lows.
Prices moved above the 72,000-75,000 band but were rejected at the MA20W.
In Charts Flash Week 14 we wrote that in the most recent cases, range collapses of this nature have led to one final bullish spike before the dump.
The rejection at the MA20W appears to carry weight in this regard.
At the time of writing, the situation is still in the balance. If prices retrace below 75,000 before the weekly close, the short would be maintained.
For the full breakdown of levels and scenarios, see our Charts Flash Week 15 and the Bitcoin Chart of the Week.
⚡ S&P 500
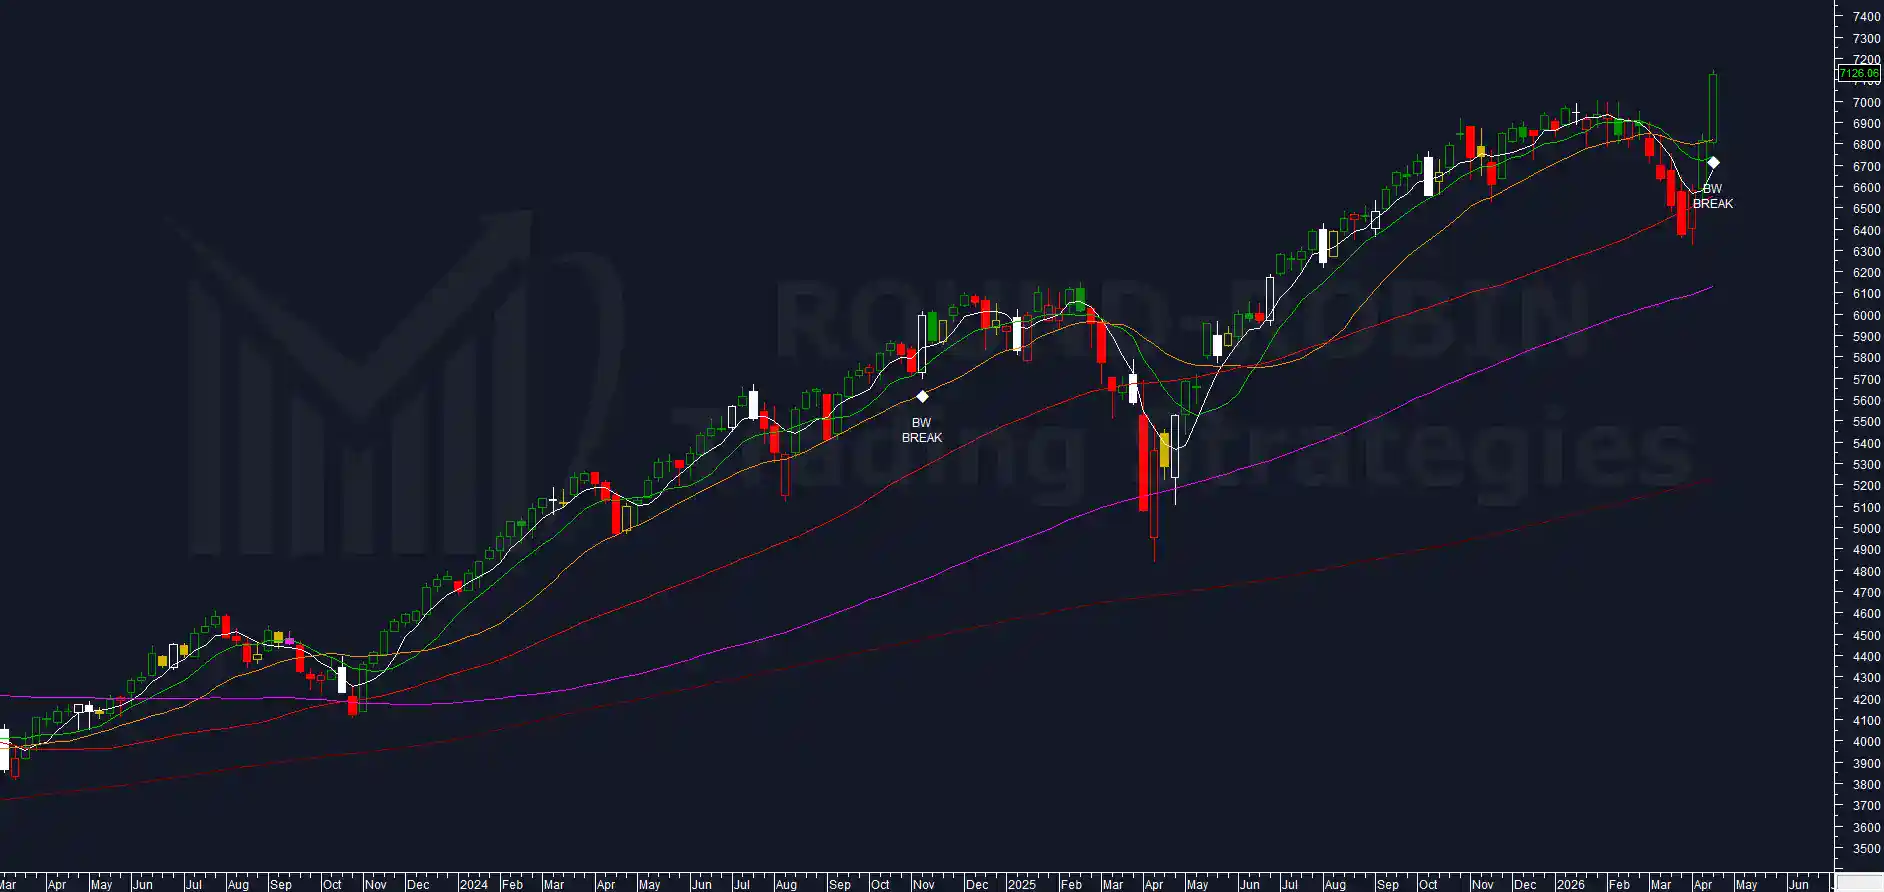
chart: S&P 500 weekly
Last week we wrote that historically, a configuration with a wide range and body recovering from a relative low manages to deliver a small continuation of the move but not to extend it immediately beyond the period highs, with the expectation for a toppish phase.
The S&P 500 defied expectations in the magnitude of the move. Starting with an extreme incline from the low two weeks ago, it printed a new all-time high.
Weekly close at 7,126.06.
A rare event
A massive bullish candle with the widest weekly range since April 2025.
Our proprietary volatility indicator reaches April 2025 levels. The body stands at 4.70%, among the 5 widest in the last 3 years, and the second instance in 20 years where a body of this magnitude corresponds to an all-time high.
The first: November 2024 (high at 6,012.45), which in the following weeks reached 6,147.43 before collapsing on the tariff shock in March 2025.
Going back 30 years, there is only one other case: July 1999, also toppish, with the index declining until November.
The rarity of this event demonstrates once again how this multi-year phase keeps accumulating historically rare or unique events.
The succession of these events leads to two brutally opposed scenarios: either we are witnessing a paradigm shift, likely driven by the massive adoption of artificial intelligence and quantitative methods that lead automated systems to act in the same direction amplifying moves, or a situation is building that is not destined to end well.
Can you ignore such a violent break of the all-time high and think only in toppish terms? From a basic technical analysis standpoint, probably not, but unless different conditions emerge, it is very unlikely that our system will participate in this bullish phase.
The S&P 500 would have been the obvious choice for Chart of the Week this week, but the implications of the Nikkei 225 could provide a complete and forward-looking view on global equity markets.
The system remains flat.
For the full S&P 500 framework, see our Charts Flash Week 15, the Chart of the Week Week 11, the February Deep Dive and the original W02 analysis.
Leave a Reply