


Weekly monitoring of the Italian benchmark index.
Why do we do this?
Check out our strategy page.
My proprietary DBBT indicator identifies misalignments between current price and expected technical level on major indices.
Every week, the FTSE MIB is in our crosshairs.
The hunt is on.
In our latest analysis, we left off with a convergence of indicators pointing toward a potentially toppish setup.
Overextension at 3.10% on the MA5W, Fear Indicator at 5%, BCP3 in exhaustion territory: everything was suggesting the same scenario.
The FTSE MIB closes the week at 47,656.11.
One data point captures this week above all else.
Over the past six weeks, even the weakest ones, the index had always touched at least one price above the prior week’s close at some point during the week.
This week the FTSE MIB never did: the weekly high stopped at 48,439.61, over 400 points below the prior weekly close of 48,869.43.
As always, let’s dig into what the indicators are telling us.
Bulls vs Bears
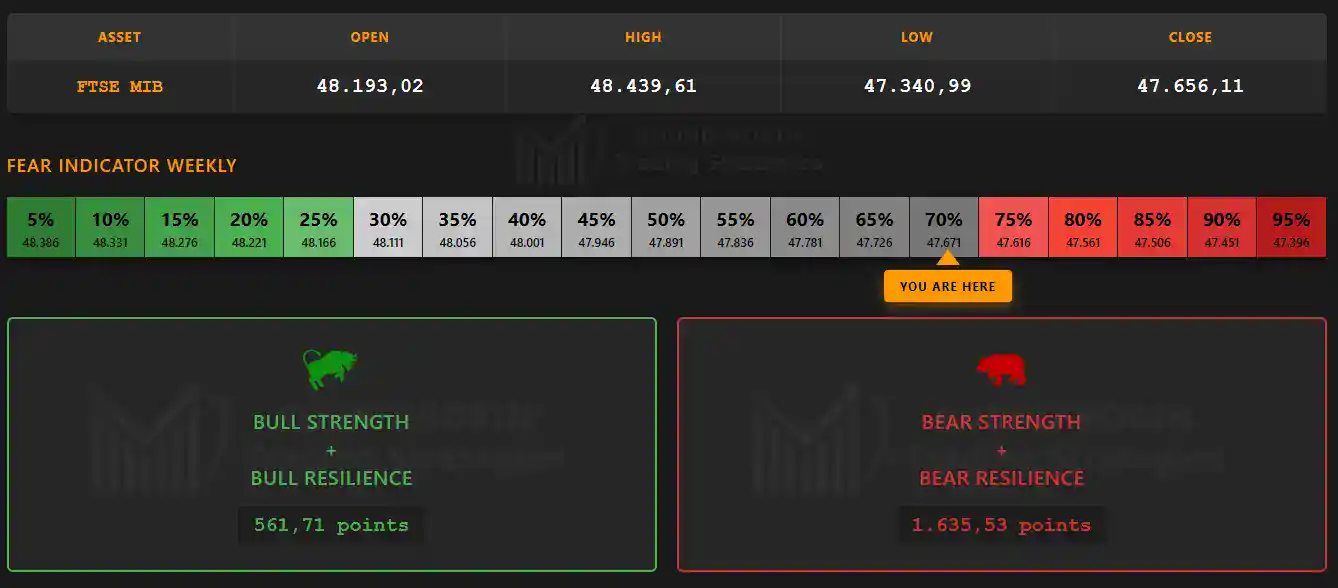
For the first time after weeks of bull dominance, the bears take control with a roughly 3 to 1 ratio.
The Fear Indicator sits at 70%.
A moderate acknowledgment by the market: things have run far and a period of consolidation could be entirely natural.
The overall reading is that of a simple consolidation pause within the bull market. No violent switch.
The Big Picture
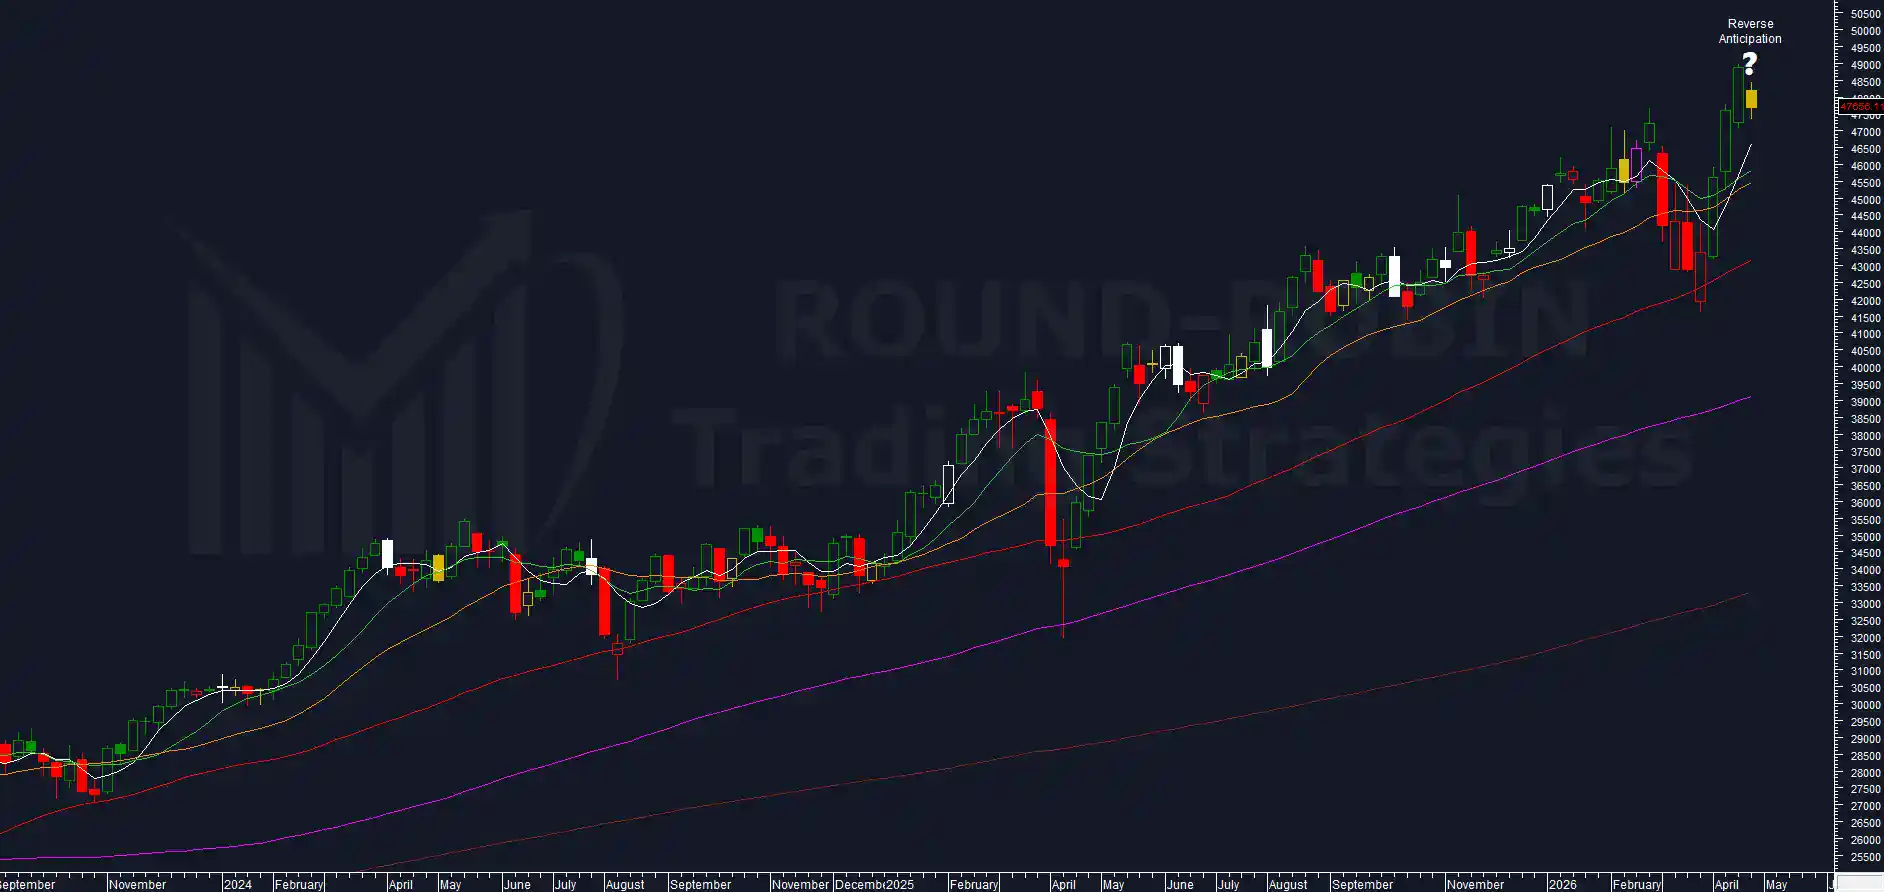
Weekly inside candle with close below open.
Two consecutive weeks closing below the open have not been seen since October 2025.
Next week, according to our system, is a strong candidate to break this streak.
The MA5W, as expected, crosses with steep inclination through both the MA10W and the MA20W.
The latter two are running practically side by side.
A note of caution on the candle body, entirely below the relative high of February 27, 2026, with the weekly high only fractionally exceeding that level.
Volatility Indicator
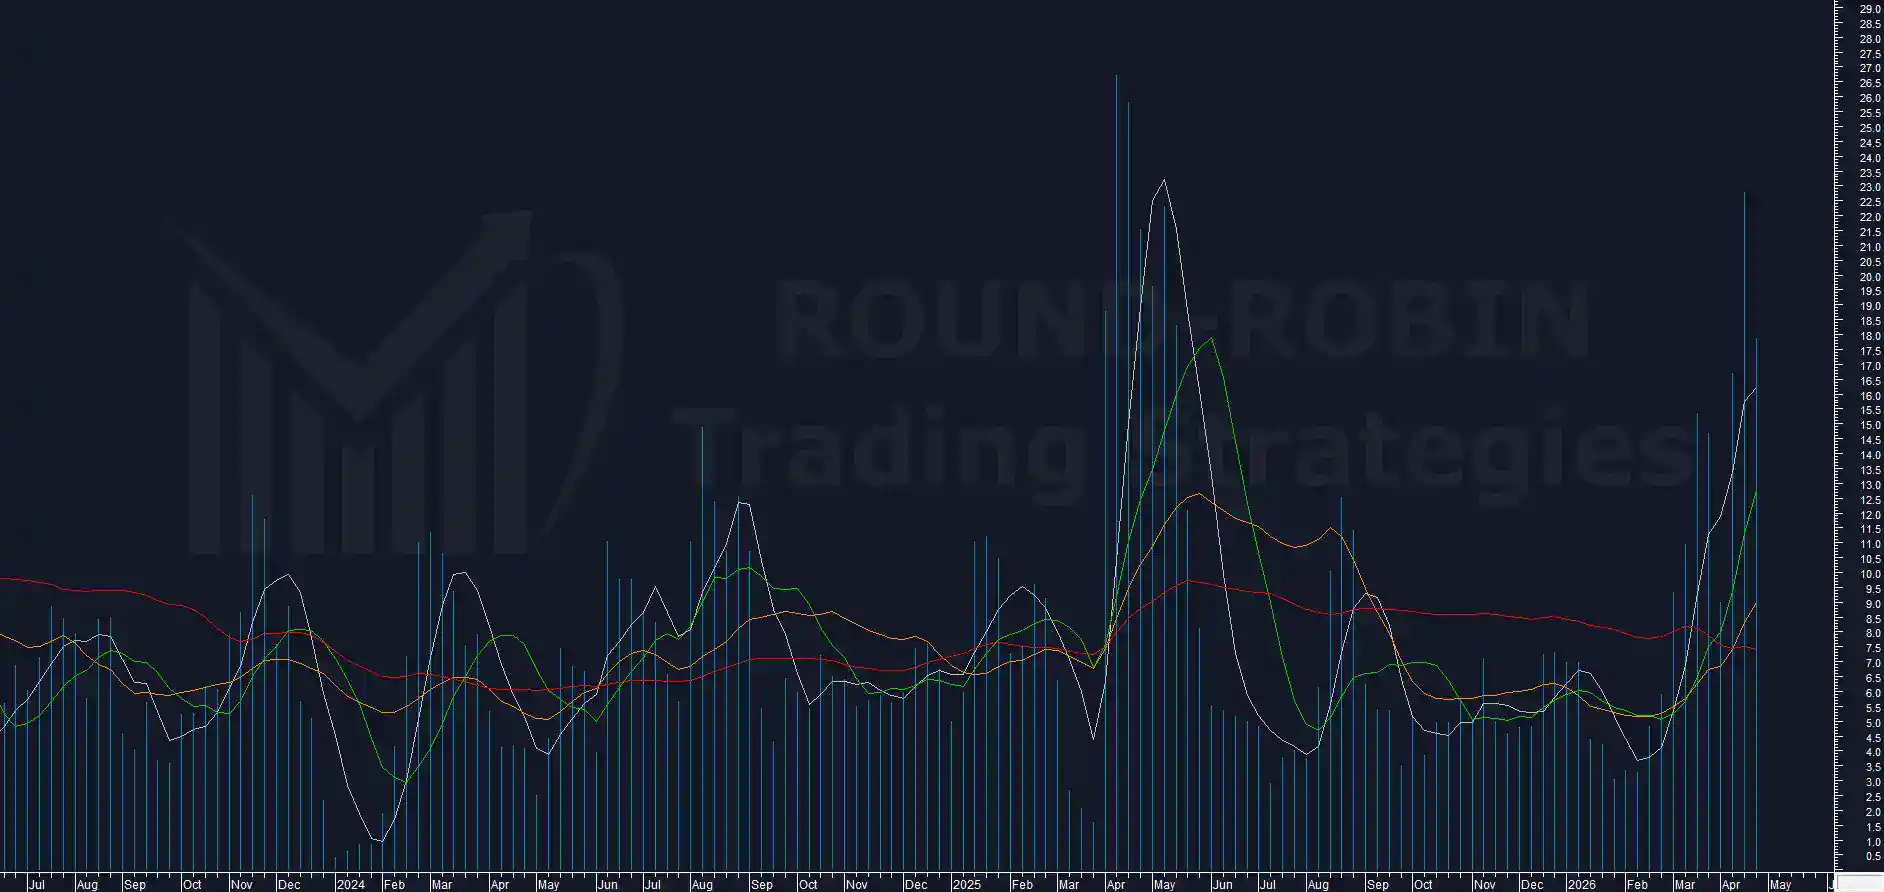
The indicator drops to 17.90%, as the inside candle compresses the range.
It remains the second highest reading of 2026.
The indicator’s moving averages are rising sharply, but still far from the extreme levels reached in April and May 2025.
Range Weekly %
Drops to 2.32%, just three weeks ago it was consistently above 5%.
A decline fully consistent with the toppish setup outlined in the previous analysis.
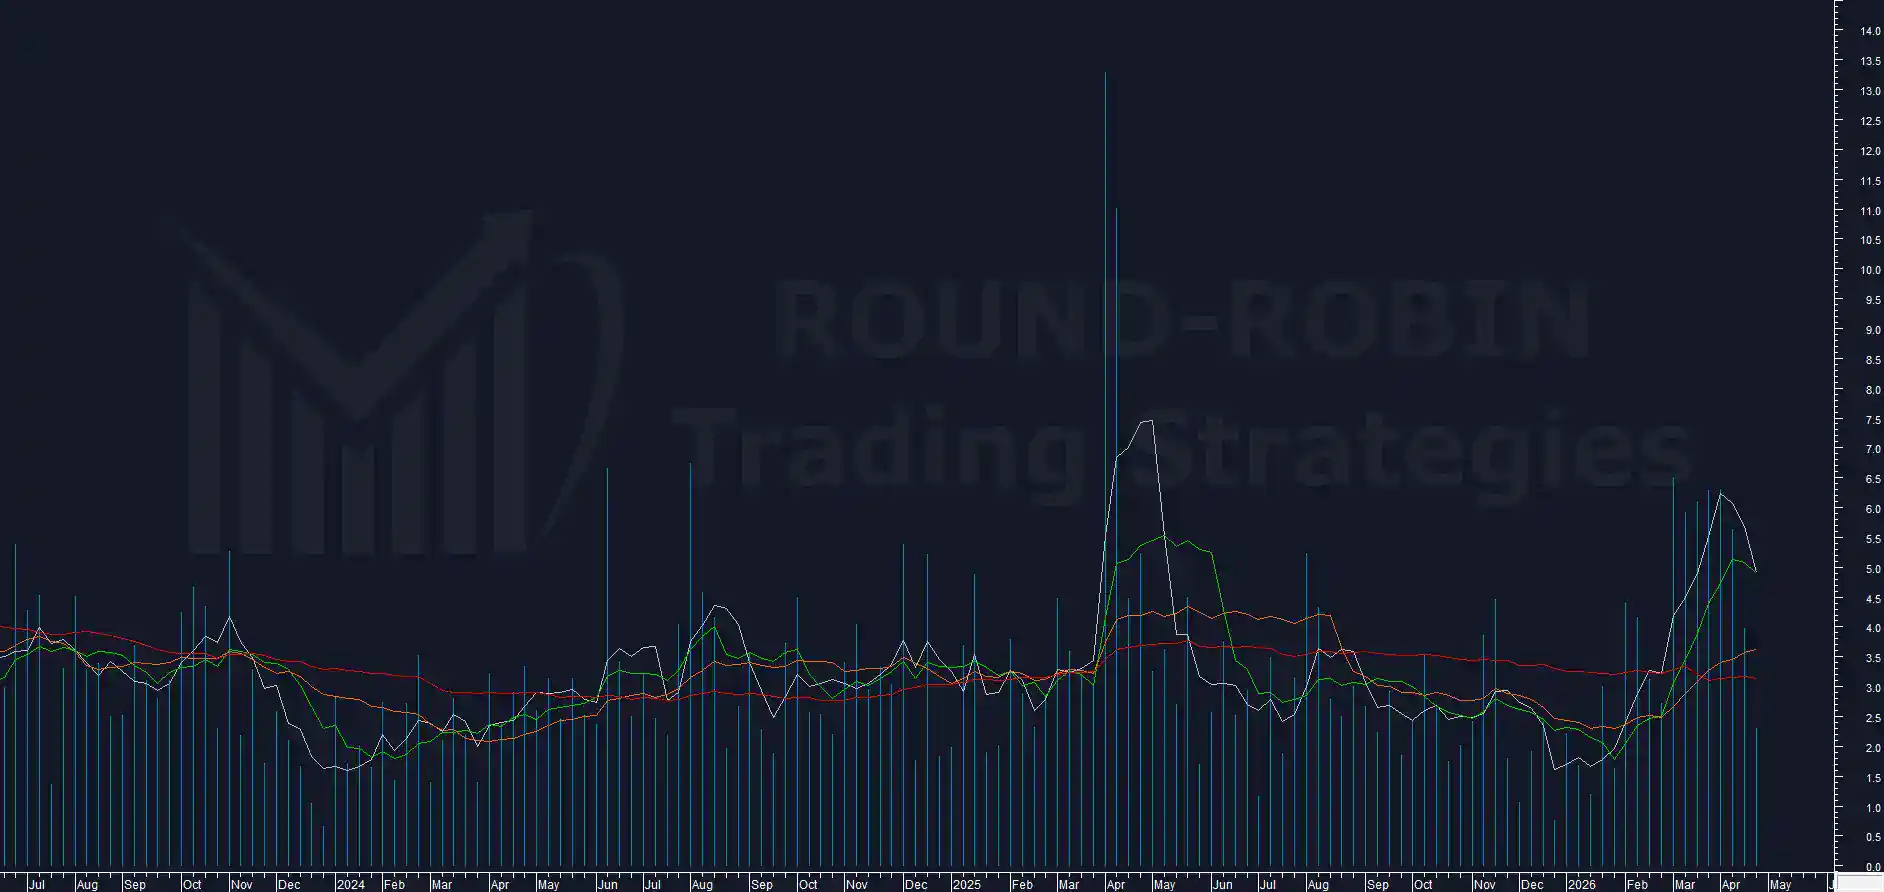
BCP3
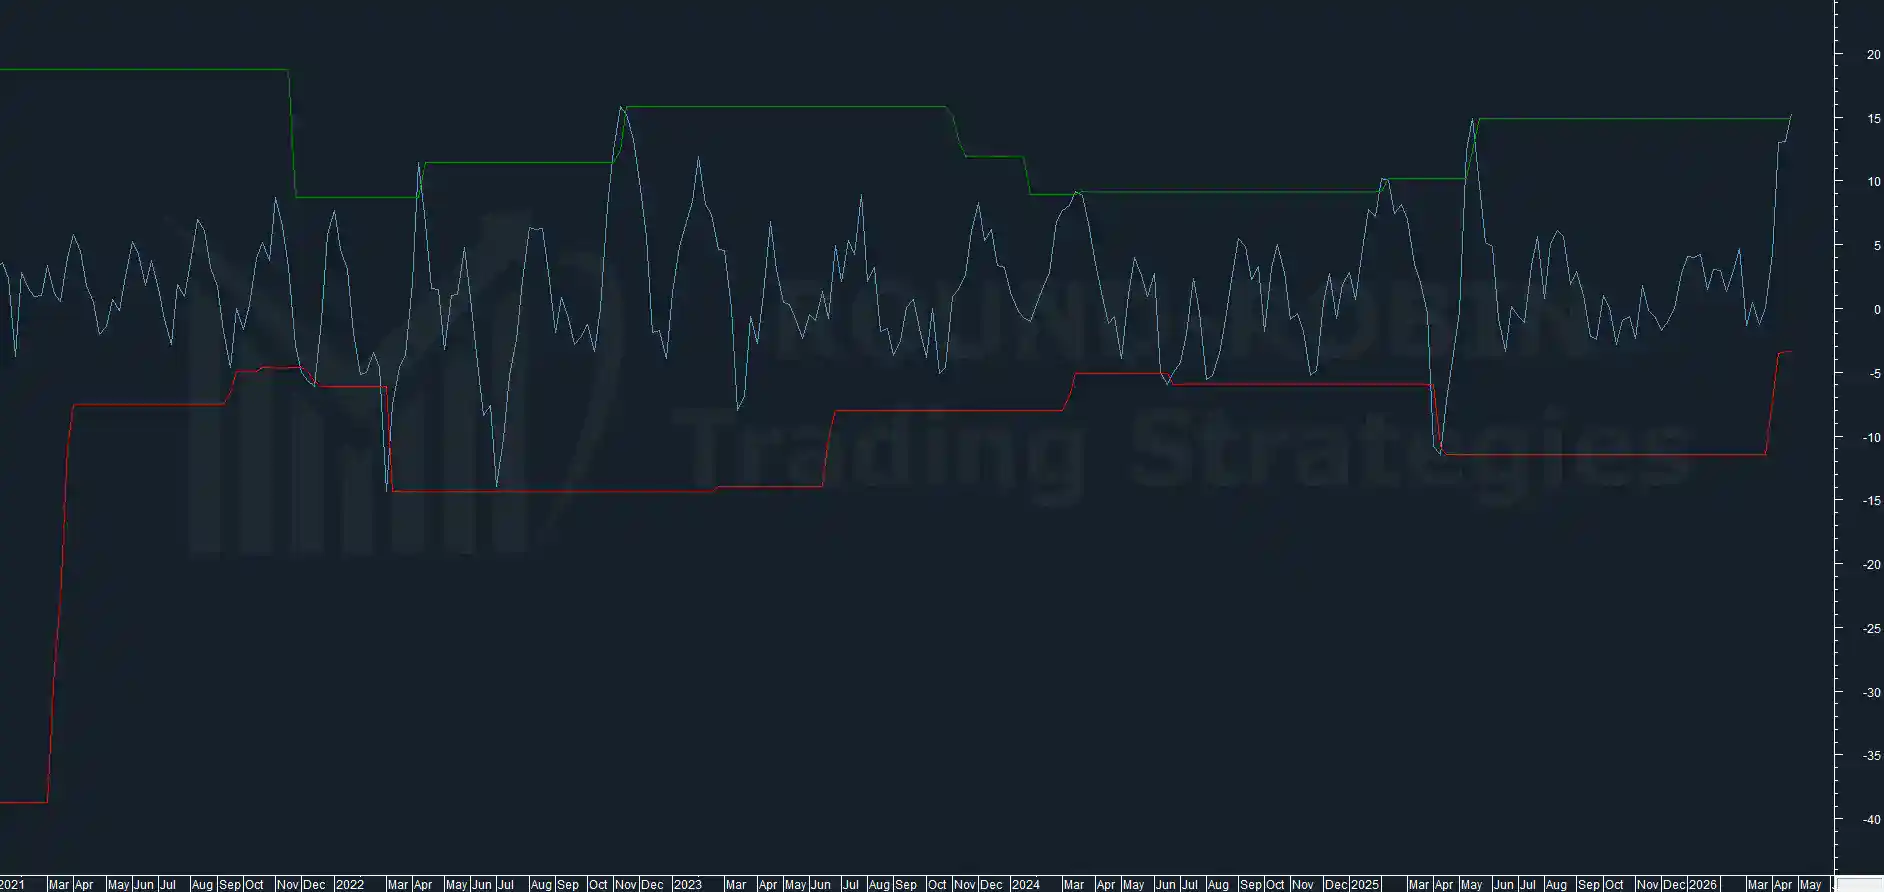
Posts what is likely its final flare, reaching the year’s top at +15.25%.
The previous top was May 2025 at +14.90%, which did not exceed 15% and sent the market into a 10-week bear/sideways phase.
To find a reading above 15% we have to go back to November 2022 at 15.80%.
In both cases the reading proved toppish, triggering sideways/bearish phases lasting several weeks.
Conclusion
The convergence of indicators analyzed this week outlines a rare setup.
We have to go back to November 2021 to find a comparable one, and historically only one instance did not prove toppish.
New highs relative to this week cannot be ruled out: in the vast majority of cases the following week saw the formation of a bearish outside candle.
The system enters short.
An aggressive entry, perhaps too much from a pure technical analysis standpoint.
Under certain conditions it could also increase exposure in this direction, should prices first print lower highs and then lower lows, creating the expected bearish inside resolution.
From a strictly technical perspective we only have a confirmation of the probable toppish phase we discussed last week.
In this context the most consistent trading strategy is selling out of the money CALL options.
Key level: 47,100 area, with a first potential target around 46,000 where the MA20W and MA10W are traveling.
Leave a Reply