


Weekly appointment with the world’s most watched charts.
Last week in Charts Flash we called the S&P 500 the obvious pick for Chart of the Week, deferring to the Nikkei 225.
Another week of higher highs and higher lows, a new all-time closing high. But in a context of compressed moves and a market that is not pricing risk.
Our volatility indicator tells a different story. We are at levels that in a bull market context have been seen only once in the last 26 years. It was March 2000.
Bulls vs Bears
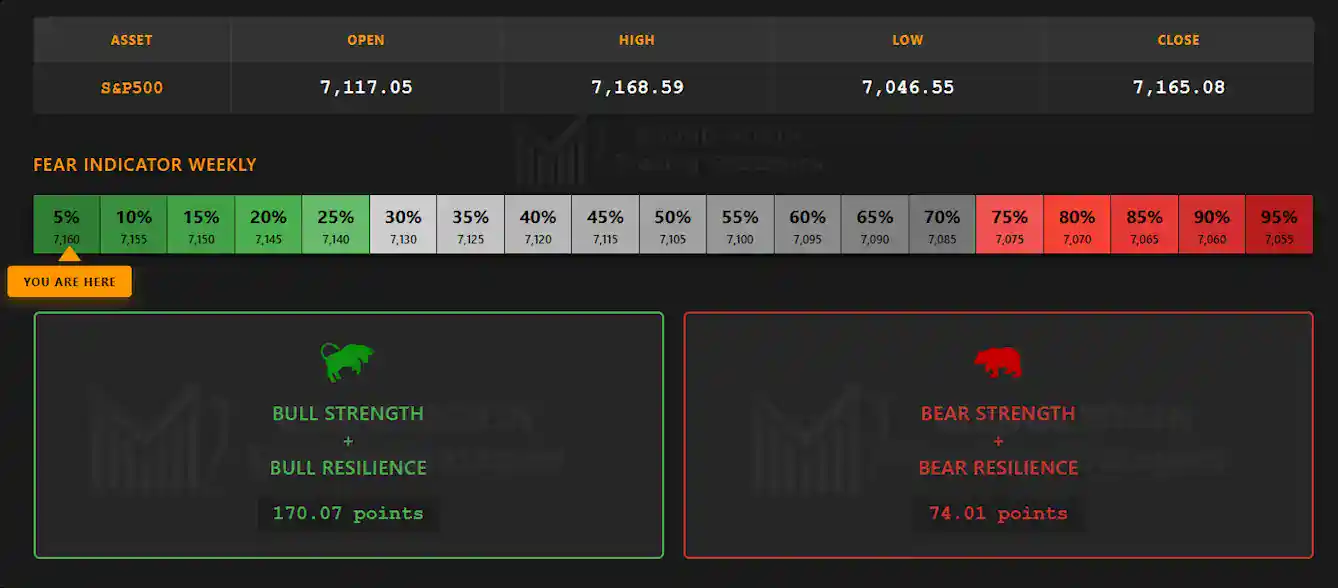
infographic: S&P500 weekly – Bulls vs Bears
About 244 total points in play. Two weeks ago the range exceeded 600. The Fear Indicator at 5% captures total complacency carrying over from the previous week.
A mild continuation, enough for a new all-time closing high but, this week, without the conviction of a market that is pushing.
The Big Picture
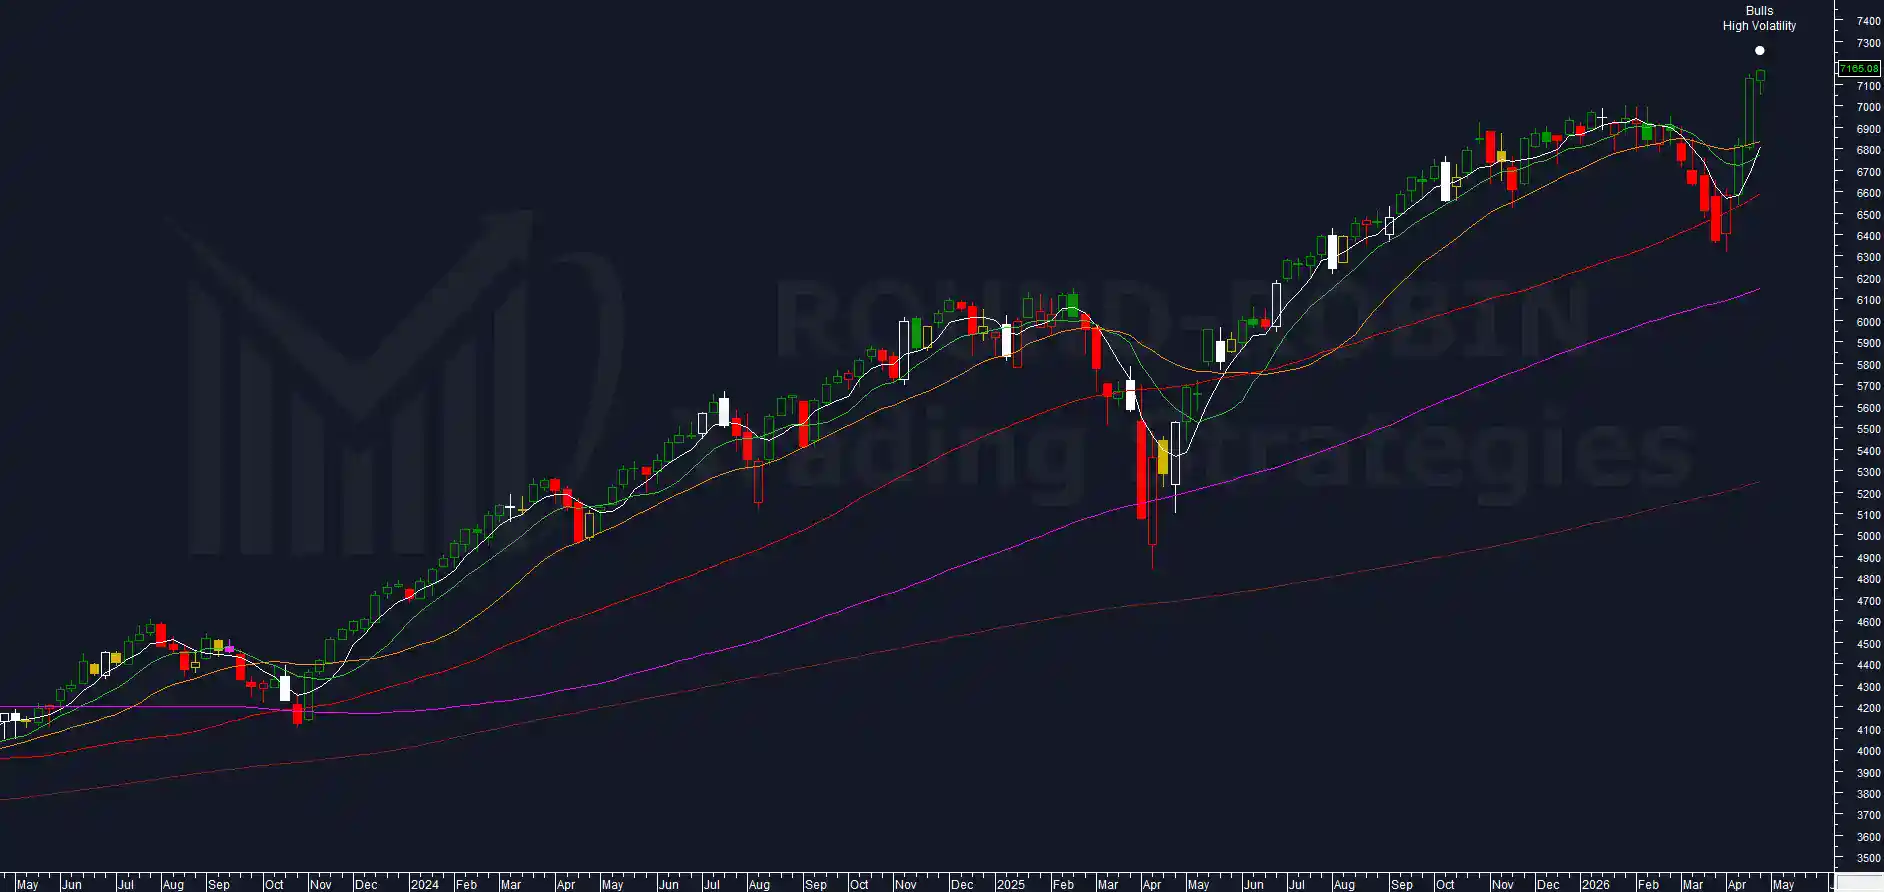
chart: S&P500 weekly
Weekly close at 7,165.08.
The MA5W and the MA10W are still below the MA20W. The fast moving averages have not recovered the bearish cross generated by the March correction. Price is running alone.
The overextension on the MA5W has reached 3.44%. The 2025 peak was 2.90%, reabsorbed with a sideways and bearish move on the highs.
To find higher values you need to go back to the post-COVID bounce or to 2009.
These are not standard situations, they are not low frequency, they are rare.
Volatility Indicator
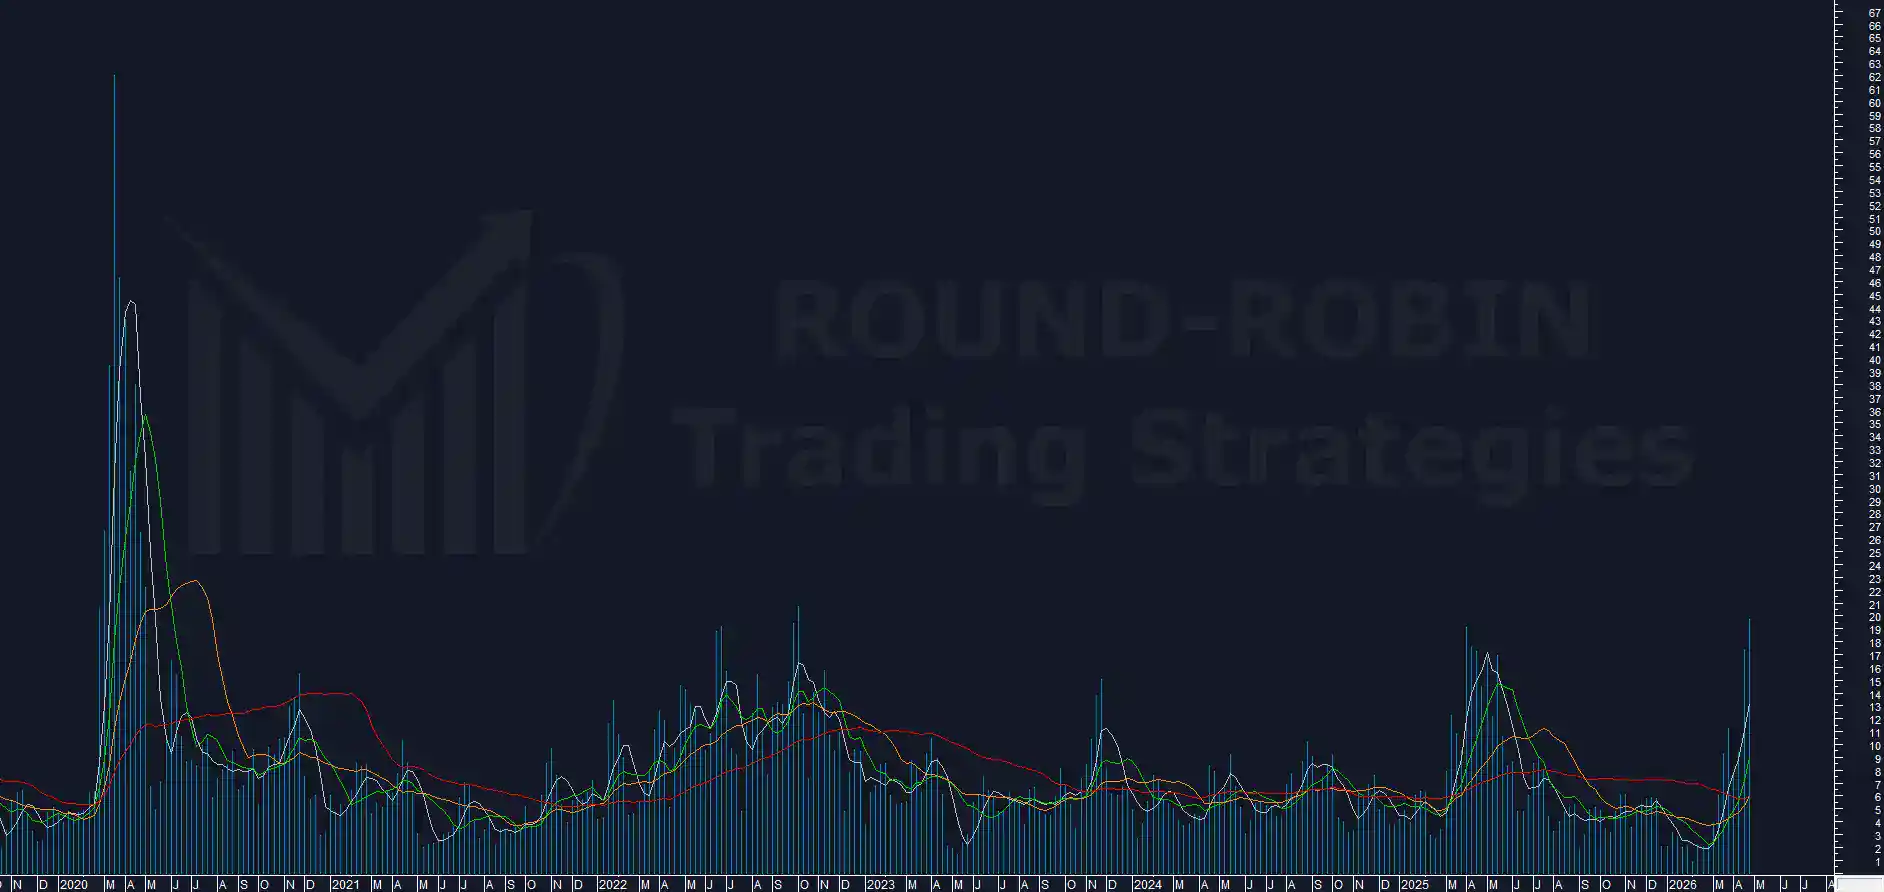
chart: S&P500 – Volatility Indicator
19.80%. A top value for the last decade, excluding the COVID crash.
Every peak in the 18-20% area over the past ten years was recorded exclusively in bear markets and often produced a reversal.
To find a comparable peak in a bull market you need to go back to the week of March 24, 2000.
The market registered a top, crashed in the following three weeks from 1,552 to 1,339, bounced and eventually started the Dotcom bear market.
The 2000 precedent
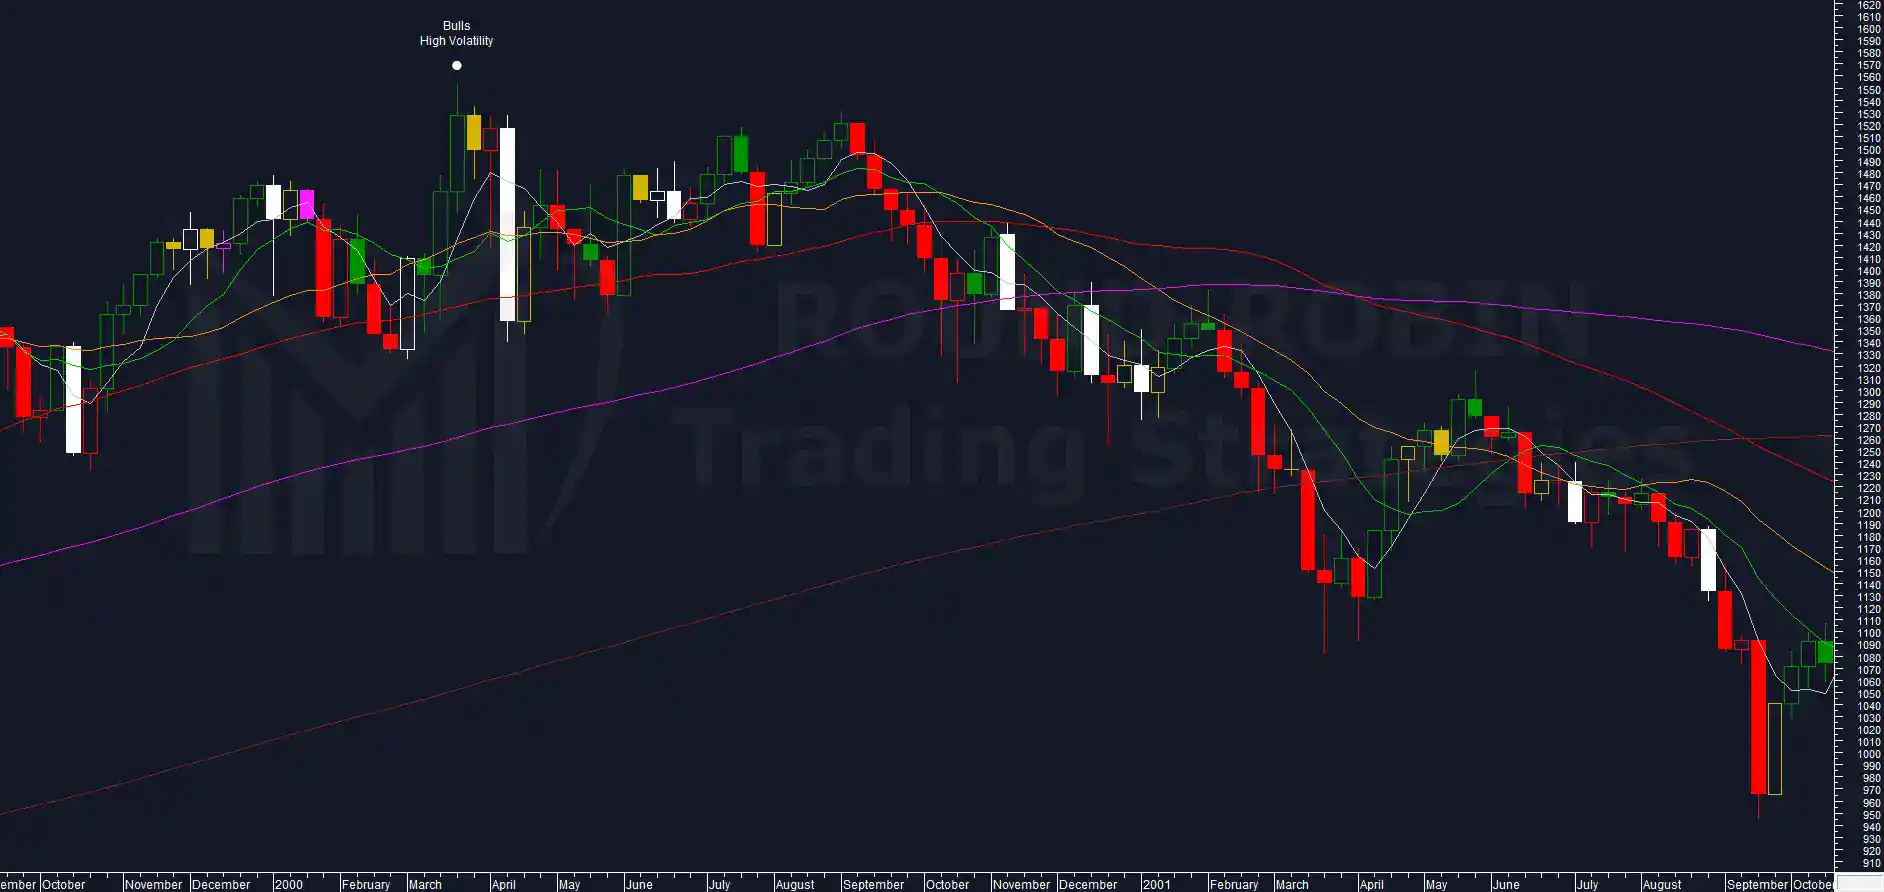
chart: S&P500 – Bulls High Volatility March 2000
In January 2000 the market set an all-time high. A correction followed, then a violent V-shaped recovery and a large candle that broke the previous top decisively. Then the crash, a long distribution phase and the start of the Dotcom bear market in early 2001.
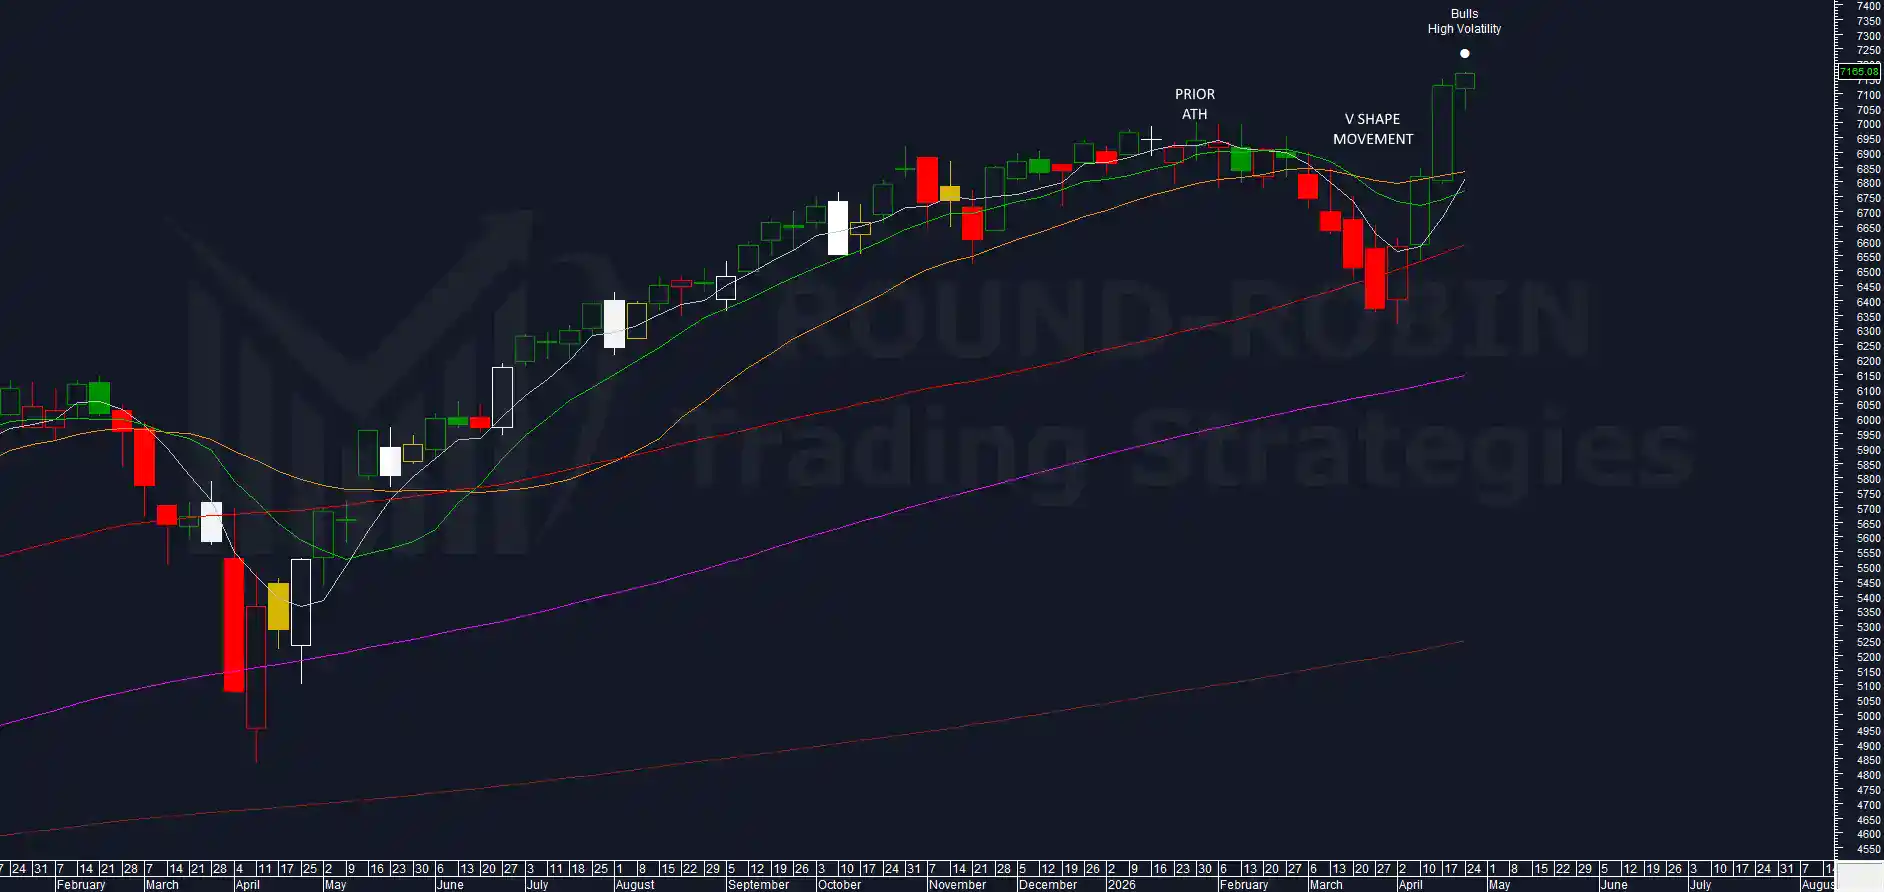
chart: S&P500 – Bulls High Volatility 2026
Today: all-time high in January 2026, correction ending in late March, V-shaped move, new record.
There are other cases where a bull volatility peak on the highs led to continuation. But in different contexts: the break of the previous high came gradually, barely exceeded for weeks before moving higher.
What sets this peak apart, like the one in 2000, is that it arrived with a V-shaped move and a violent break of the previous top with a single candle.
Overextension on MA200W
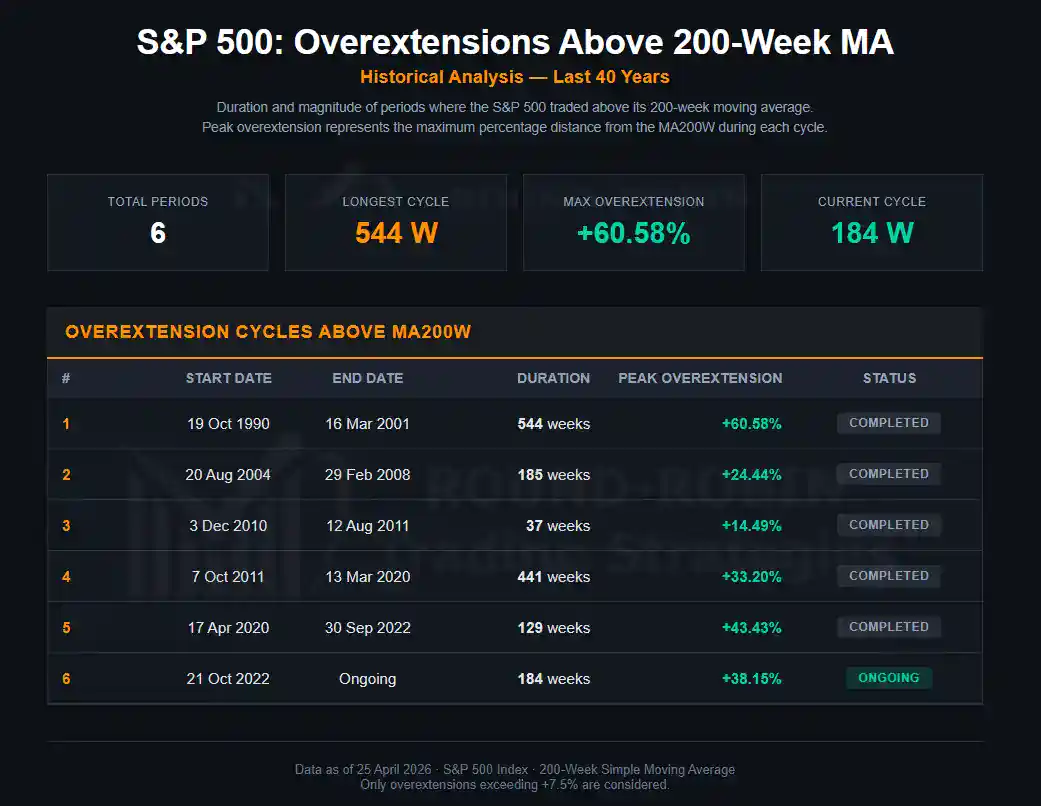
Table: S&P 500 Overextension Cycles Above MA200W (1990-2026)
Week 184 of the current cycle. The overextension moves back to 34.21%, above 30%.
In the February deep dive we wrote that +38.15% was the second highest value ever recorded in 40 years of data, surpassed only by the 2000 peak (+60.58%). We wrote that in 40 years every overextension of this magnitude has been historically reabsorbed and that the ultimate target is the MA200W.
In the Chart of the Week Week 11 the overextension had dropped to 28.22%, below 30% for the first time. The compression was proceeding cycle after cycle toward its historical reabsorption.
In a matter of weeks the market reversed the compression. The V-shaped recovery pushed the overextension back above 30% and toward the 2025 peak.
BCP3
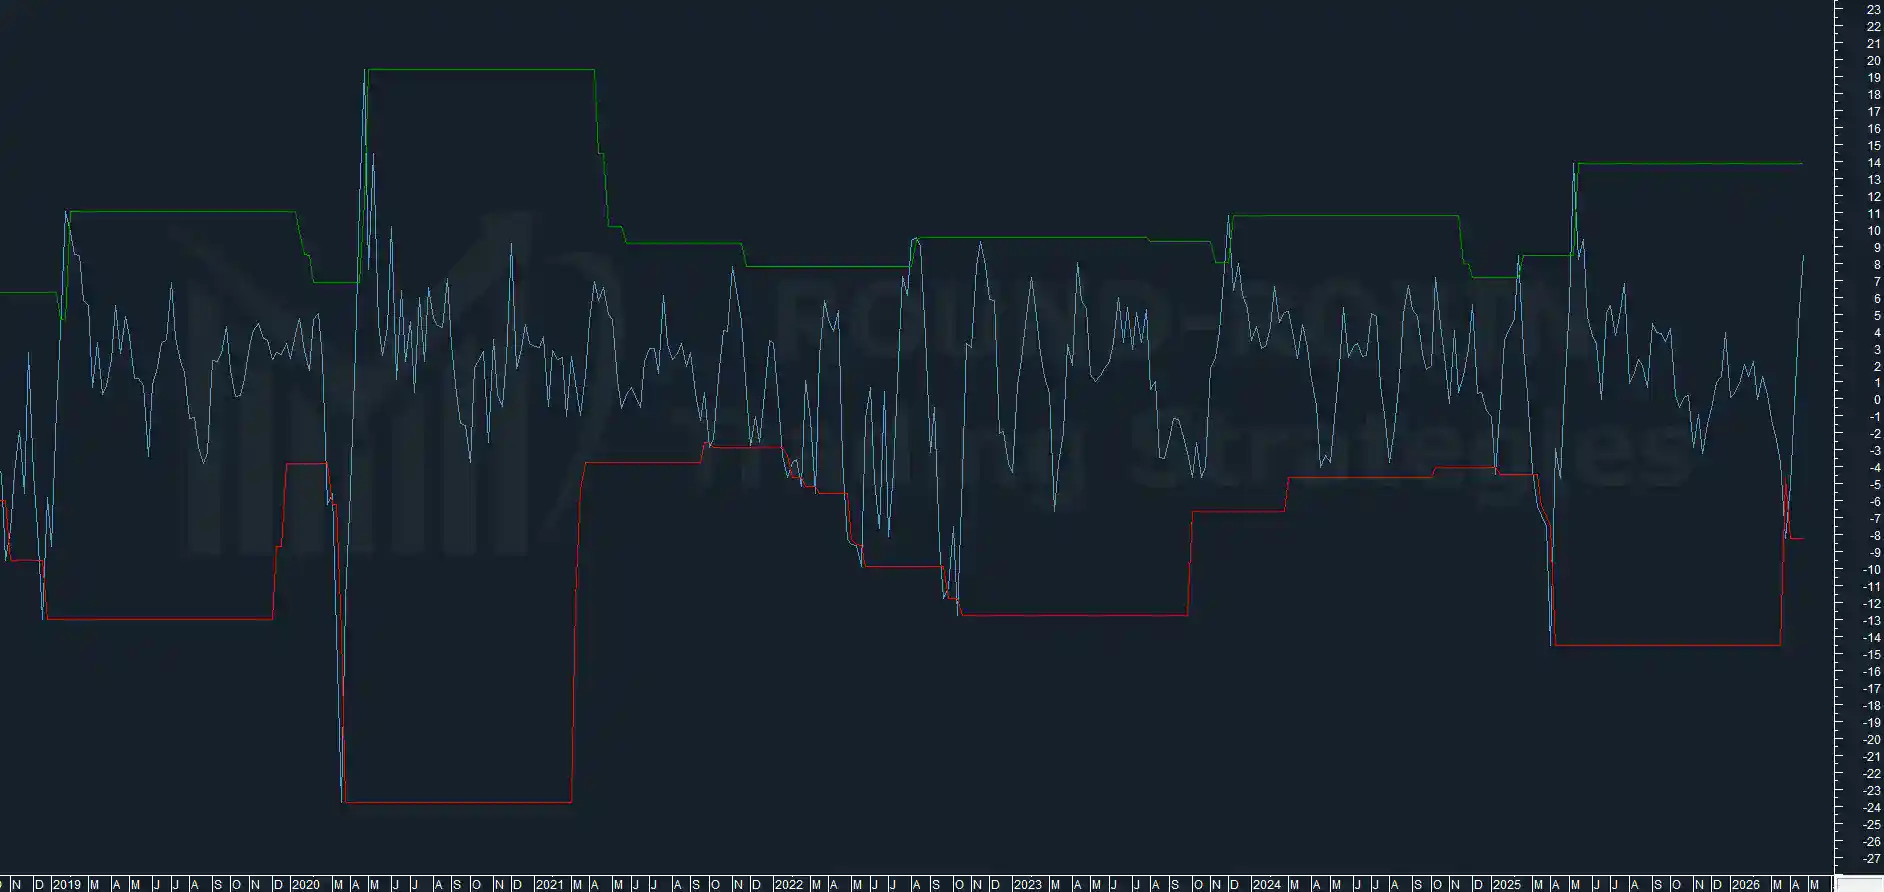
chart: S&P500 – BCP3
The S&P 500 swing has not peaked yet but will almost certainly do so next week.
A further element in favour of a rally that has completed or that will struggle to confirm its momentum.
Conclusion
Our system enters Short. It does so on historical excesses, not on a price signal.
From a pure technical analysis standpoint, a reversal pattern with a clear price signal is needed.
Should one materialise, the highest probability trade is selling Short out-of-the-money CALL options at 1-2 months.
Bullish arguments are not lacking.
The clean break of the previous all-time high and of a sideways range on the highs lasting from September 2025 to February 2026 is gold for trend followers and permabulls.
A quantitative approach however signals that something the markets are hiding.
Multiple indices, with different systems applied, without generating price signals have triggered short signals.
The first was the Nikkei 225. Others will follow in this week’s Charts Flash.
This typically occurs before major market moves, often in the direction of the systems.
But when it doesn’t, it goes violently the other way.
These are not normal situations. If wrong, it is wrong by a lot. There will be no room for noise.
Leave a Reply