


Weekly monitoring of the Italian benchmark index.
Why do we do this?
Check out our strategy page.
My proprietary DBBT indicator identifies misalignments between current price and expected technical level on major indices.
Every week, the FTSE MIB is in our crosshairs.
The hunt is on.
A shortened week, due to the May 1st public holiday.
In the background, two central banks confirmed their wait-and-see stance: the Fed held rates unchanged for the third consecutive meeting in the 3.50%-3.75% range, while the ECB confirmed its references at 2.00% on the deposit rate, 2.15% on the main refinancing operations and 2.40% on the marginal lending facility.
Not a surprise, but with a subtext the markets did not miss: Lagarde openly stated that the board had discussed the rate hike option with intensity, deferring any decision to June pending clearer data on the energy and inflation front.
The macro backdrop framed a week that on the technical side had its own precise logic: unwinding of daily excesses, with Thursday’s session representing the moment of greatest tension.
After a sharp gap down open, the market reversed decisively, climbing back above the 48,000 level.
The FTSE MIB closes the week at 48,245.54.
Bulls vs Bears
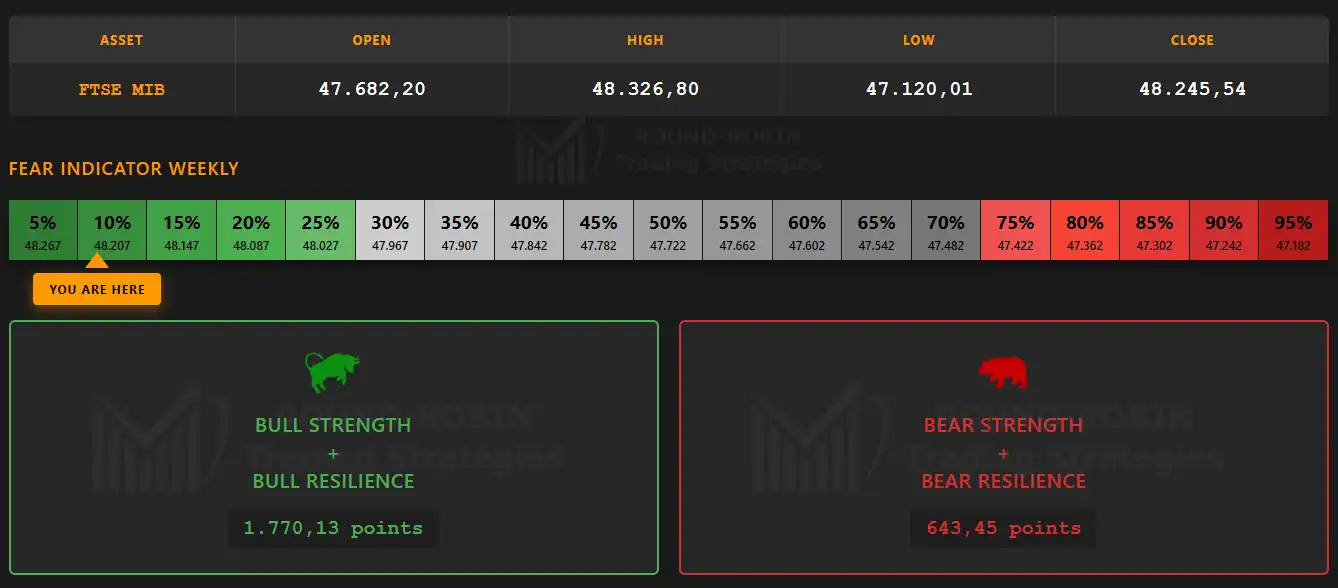
infographic: FTSE MIB weekly – Bulls vs Bears
A counterintuitive week, to say the least.
The close is positive relative to the prior week: +1.24% from 47,656.11 to 48,245.54.
Bulls beat bears again, but the context tells a different story: compressed range, lower highs and lower lows, Fear Indicator at 5%.
A low reading not because the market has turned euphoric again, but because there was no battle.
A week without clear directional signals, where bull prevalence is more the result of an absence of pressure than of a convinced recovery.
The Big Picture
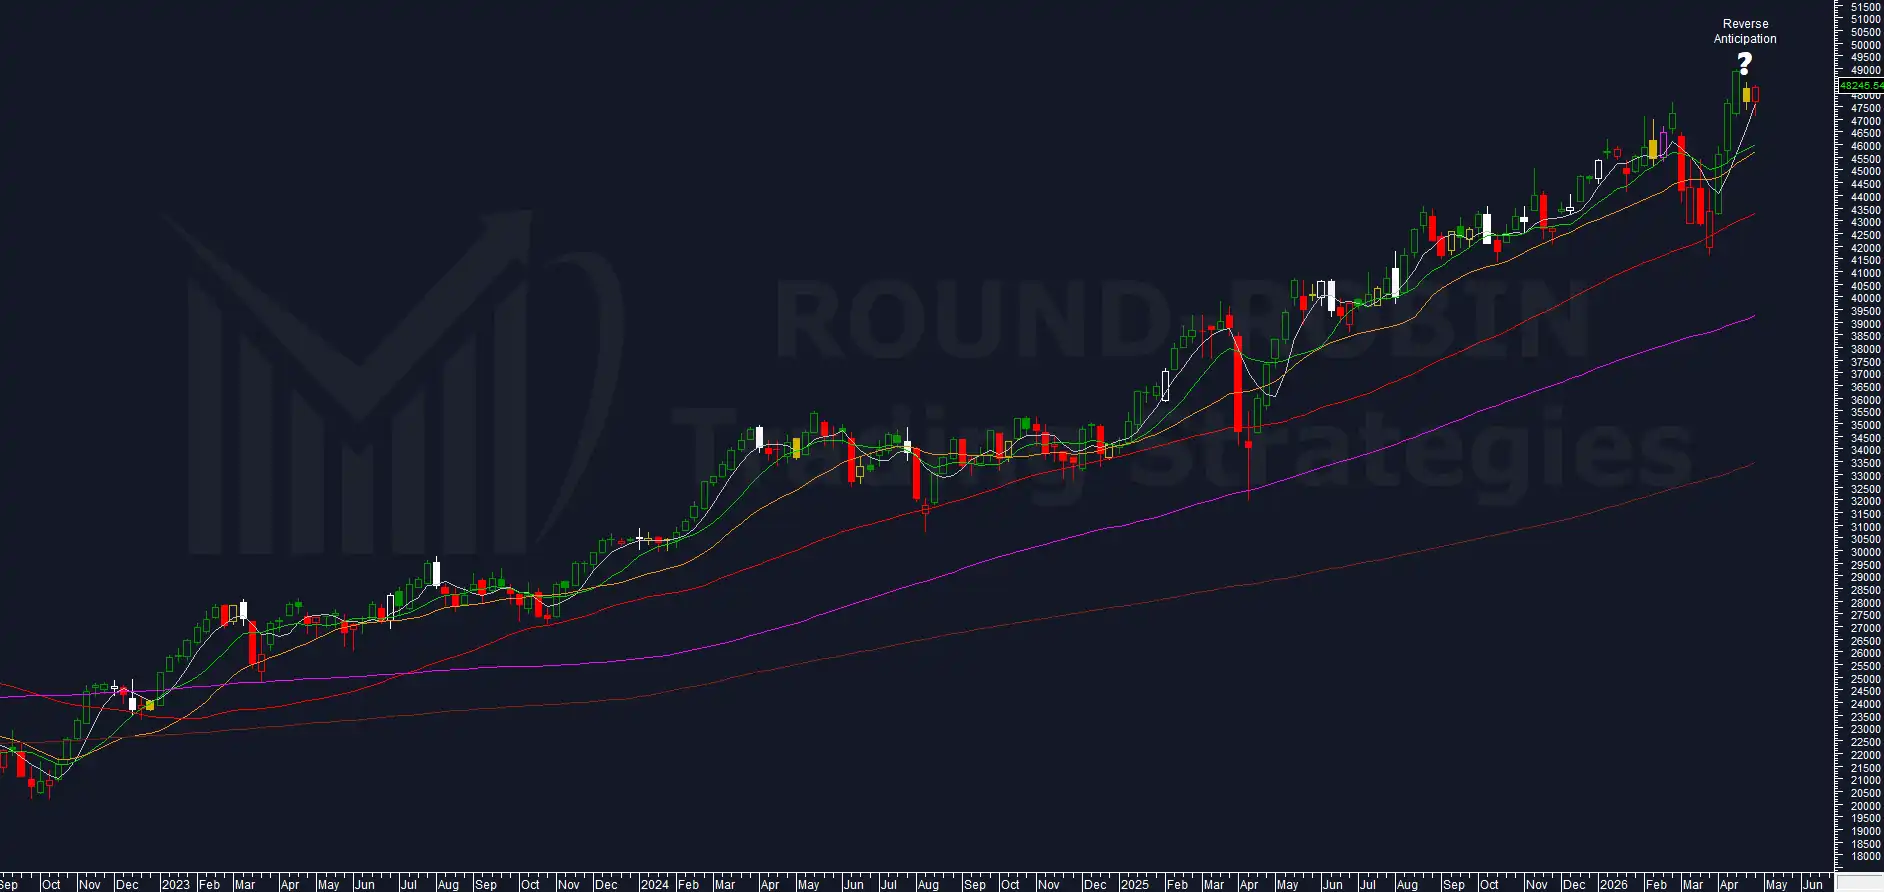
chart: FTSE MIB weekly
Let’s start from where we left off in the previous analysis.
The 47,100 area was the key level flagged as the first reference to watch: the weekly low stopped at 47,120.01.
The level held, by 20 points.
The overextension on the MA5W has retraced, but the index managed to hold above the moving average and close above it: no small detail in a week of unwinding.
The prior week’s high of 48,439.61 was not exceeded: the statistically expected bearish outside candle did not form, but only just.
Once again the FTSE MIB does not print two consecutive negative weekly closes.
Once again it does not print two consecutive weeks closing below the open.
A pattern repeating with a frequency worth noting.
Volatility Indicator

chart: proprietary Volatility Indicator
Collapses to 9.53%.
In two weeks the reading has more than halved.
A compression consistent with two opposing scenarios: consolidation ahead of a continuation, or silent distribution ahead of a bearish move.
The indicator alone does not resolve the ambiguity, but read alongside the week’s other elements it tilts the reading.
Range Weekly %
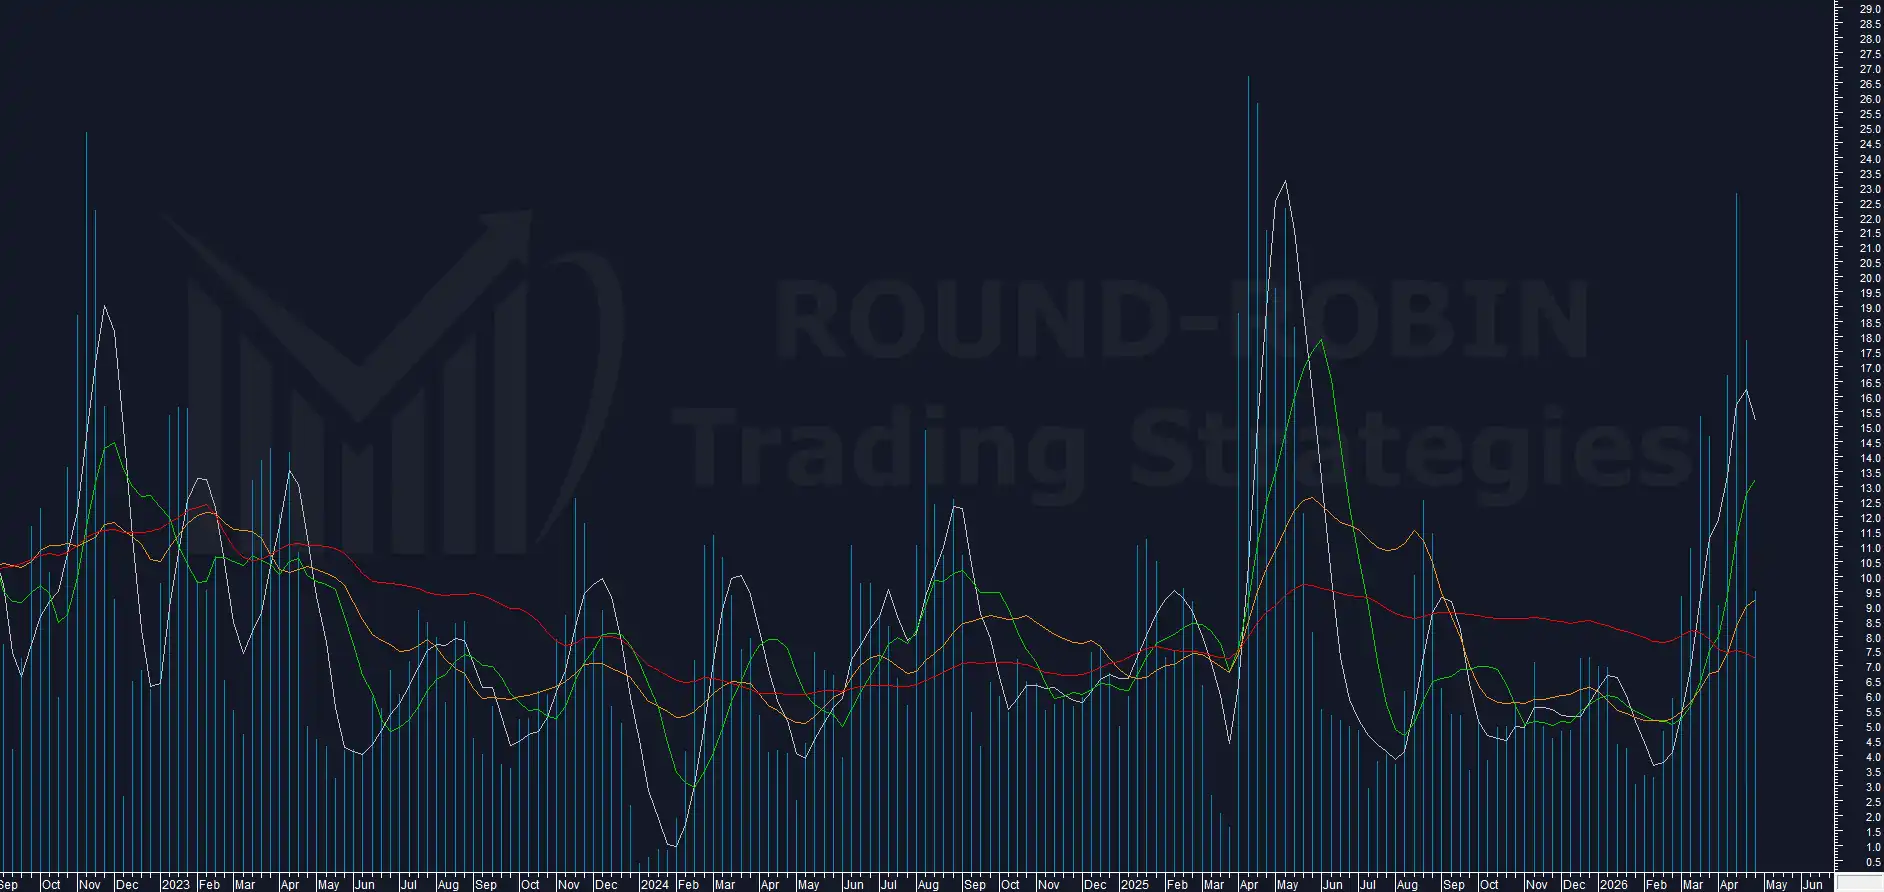
chart: FTSE MIB – range % weekly
Remains low, at 2.56%.
Consistent with the shortened week and a market that sought no extension in either direction.
The compressed range, combined with the drop in volatility, outlines a phase in which the market is not building anything: it is waiting.
BCP3
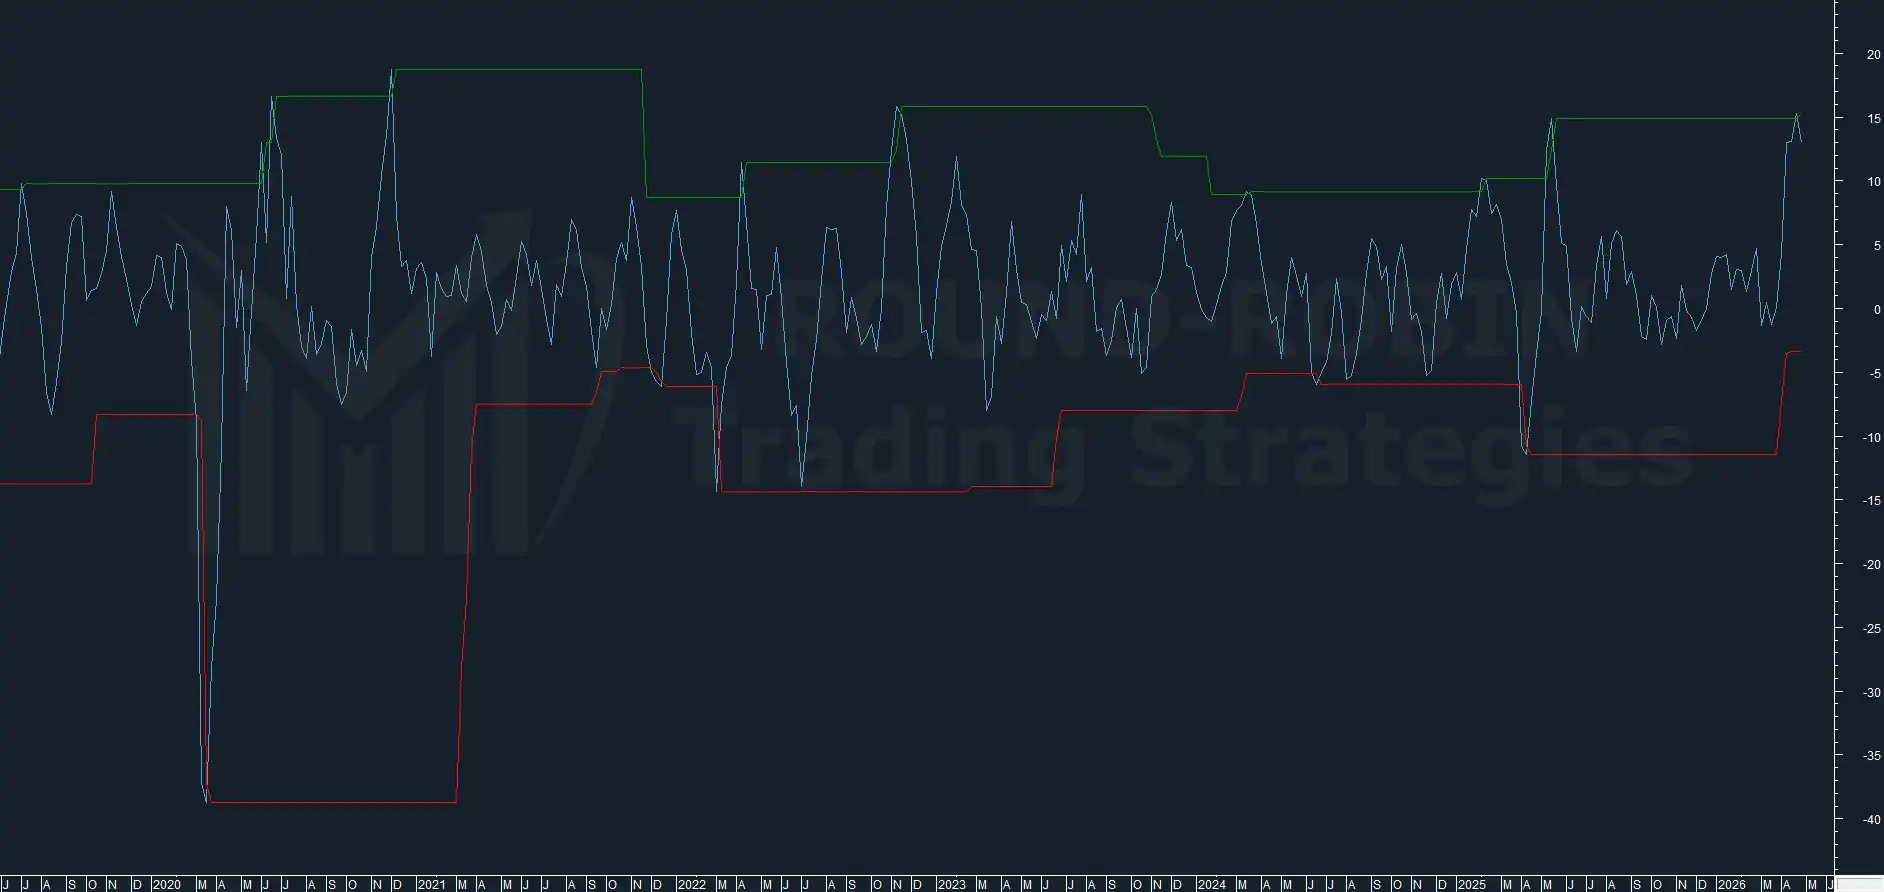
chart: FTSE MIB – BCP3 weekly
As expected, the indicator hooks lower, dropping to 12.97% from the prior week’s top of 15.25%.
The reading reached last week proved to be an extreme: historically, readings above 15% have always preceded sideways or bearish phases lasting several weeks.
The BCP3 now begins the expected retracement.
And it is precisely this dynamic that allows a more defined reading of the compression seen in the previous two indicators: not pre-continuation consolidation, but distribution.
Conclusion
The short entry from the prior week had been defined as aggressive.
It was: solid through Thursday morning, then the violent intraday reversal put it under pressure.
The technical implications, however, have not changed.
The elements remain toppish: the week added no confirmations, but provided no signals capable of invalidating the scenario either.
Collapsed volatility, compressed range, BCP3 beginning to roll over: read together, they still point toward a bearish swing as the most probable scenario.
As already stated: when compression builds and technical signals converge, you are either right or wrong by a lot.
No reinforcing signals have emerged to justify increasing the position.
The scenario remains unchanged, and so does the position.
Leave a Reply