


Quick observations on the charts that caught our eye this week.
This week’s flash covers EUROSTOXX50, Brent Crude Oil, Bitcoin, Nikkei 225 and DAX.
Gold and Silver remain flat with no relevant changes and are not updated.
EUR/USD shows no significant developments.
EUROSTOXX50 prints lower highs and lower lows after four consecutive weeks of gains.
Brent recovers with higher highs and higher lows and reclaims the MA10W.
Bitcoin at its third consecutive week of recovery with a slight break of the MA20W.
The Nikkei 225 marks a new all-time high and a new record close.
The DAX prints an inside week with a close below the open.
Let’s dig a little deeper.
⚡ EUROSTOXX50
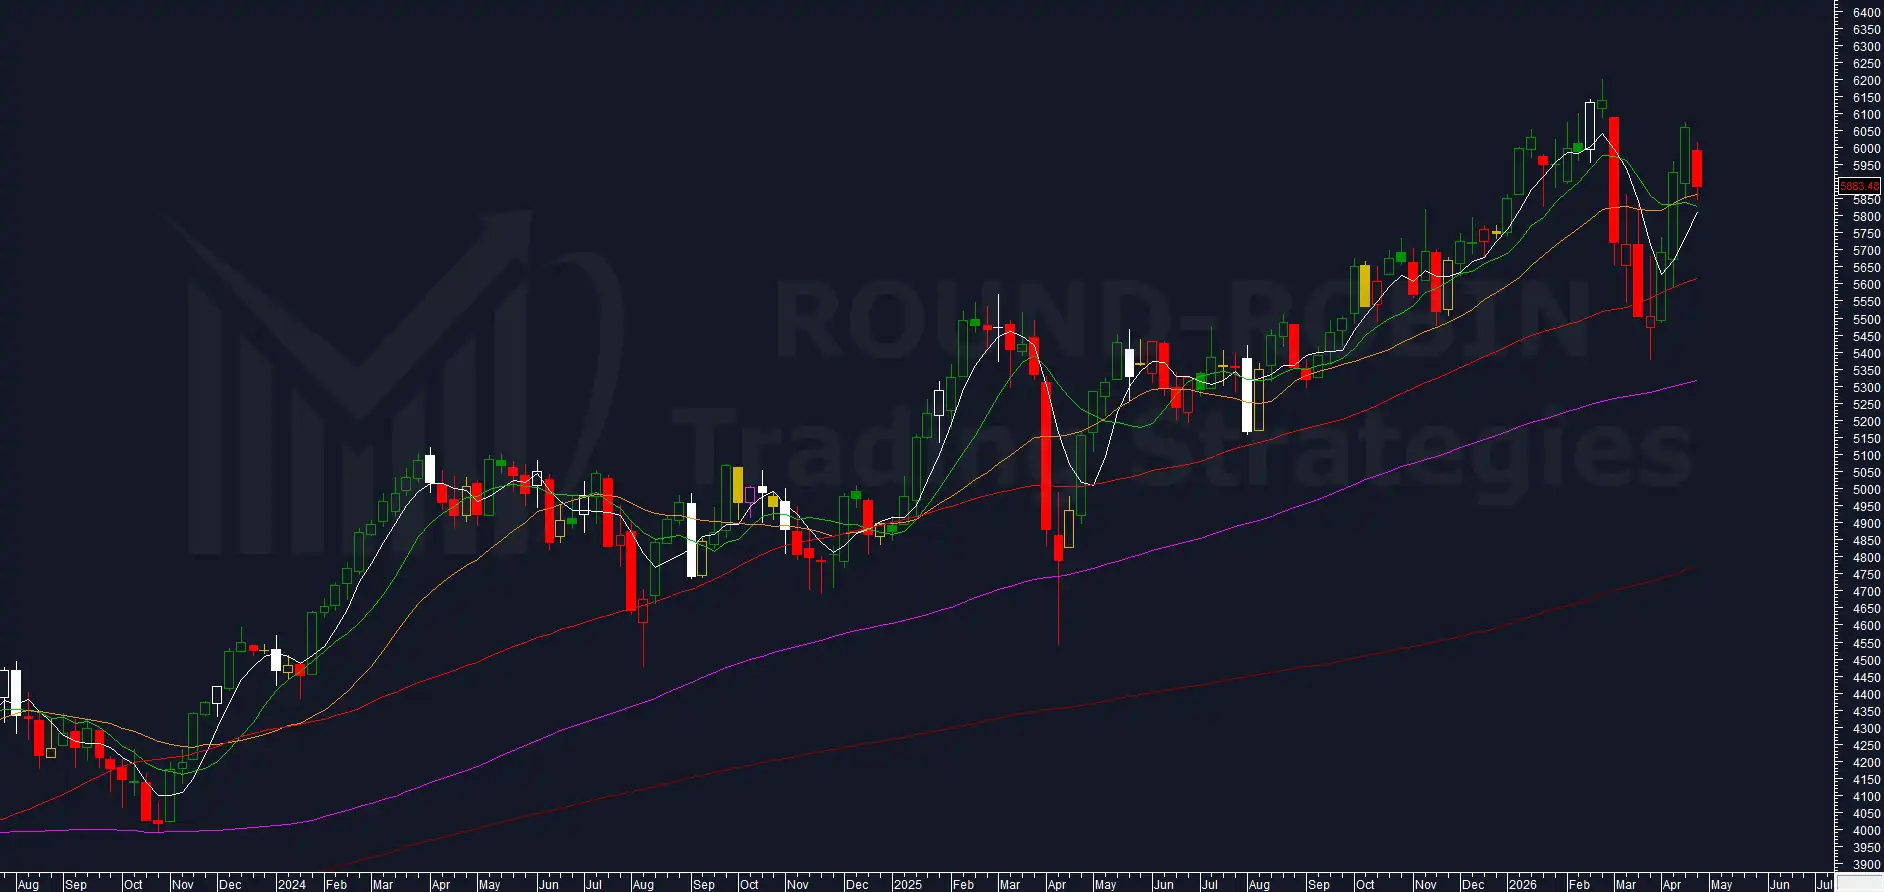
chart: EUROSTOXX50 weekly
In last week’s Charts Flash we wrote that the body counting and close counting were at the natural ceiling of four consecutive weeks and that proximity to recent highs could produce a consolidation with a close below the open.
Lower highs and lower lows, weekly close at 5,883.48. The limit was respected.
The MA20W still holds as support.
The close is however below the previous week’s open, even if marginally. The first sign of exhaustion in the bullish push.
The system enters Short.
⚡ BRENT CRUDE OIL
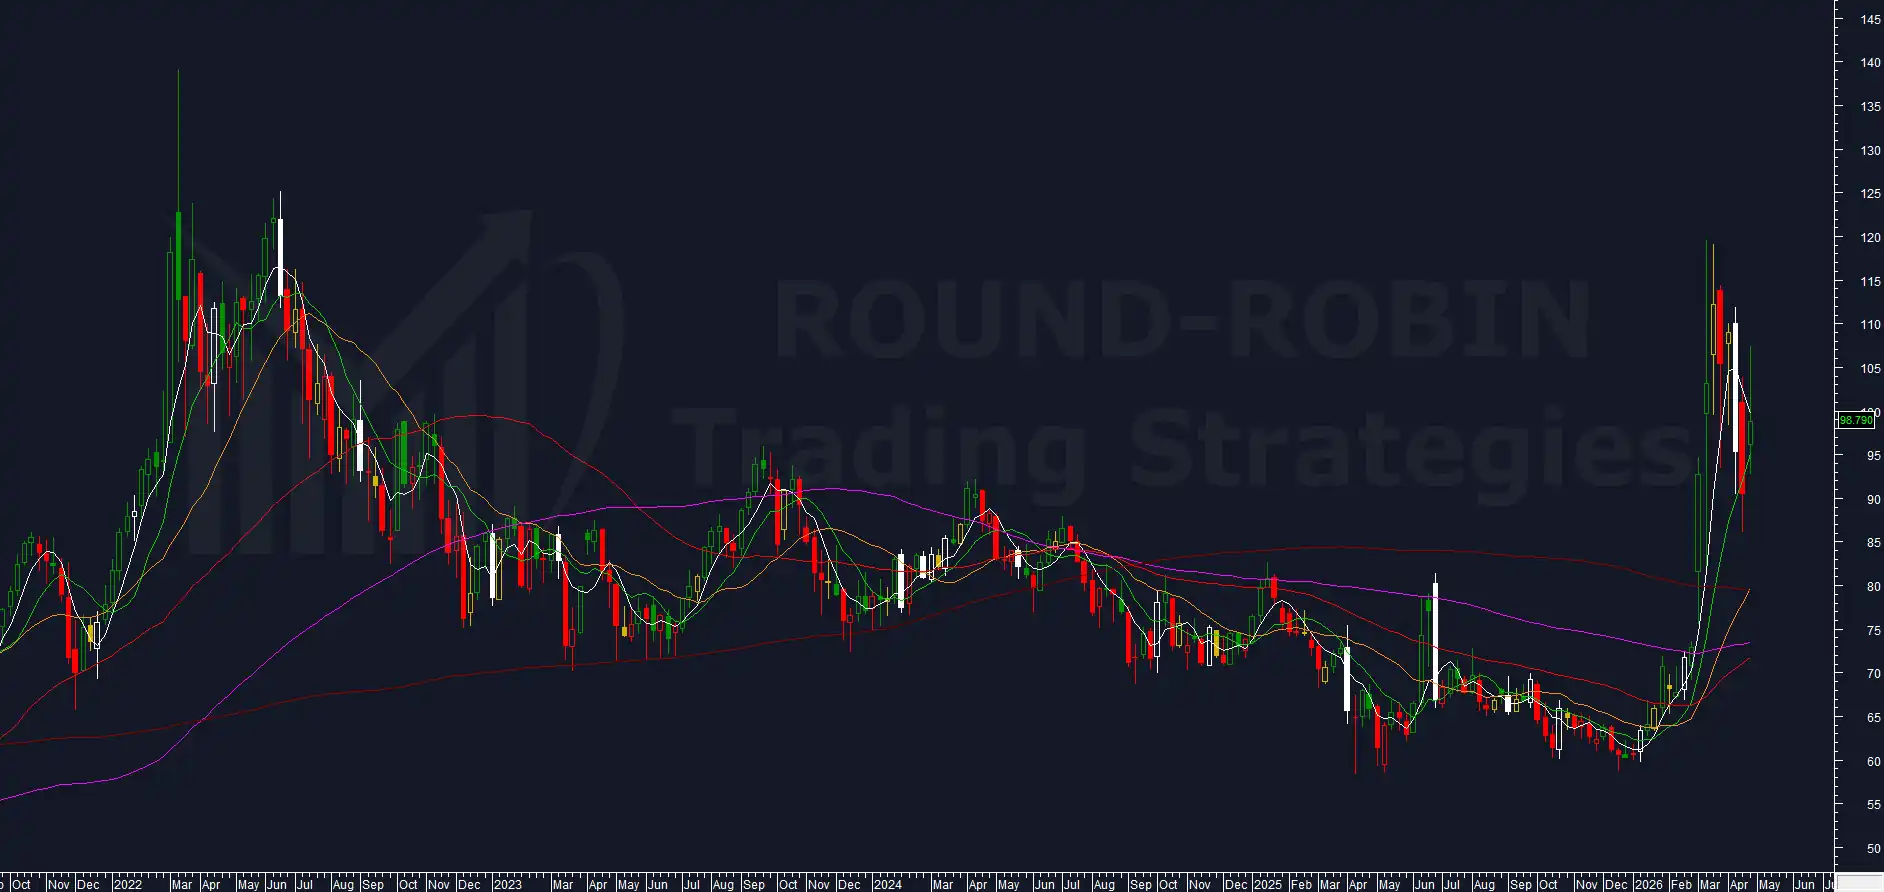
chart: BRENT CRUDE OlL weekly
Last week the system was Short but close to the exit trigger, with a close above the MA5W as a sufficient condition for the exit.
Higher highs and higher lows, weekly close at 98.79.
The long upper shadow is attributable to the contract rollover.
The recovery of the MA10W is sufficient to trigger the exit short.
The system goes back to Flat. No further signals.
⚡ BITCOIN
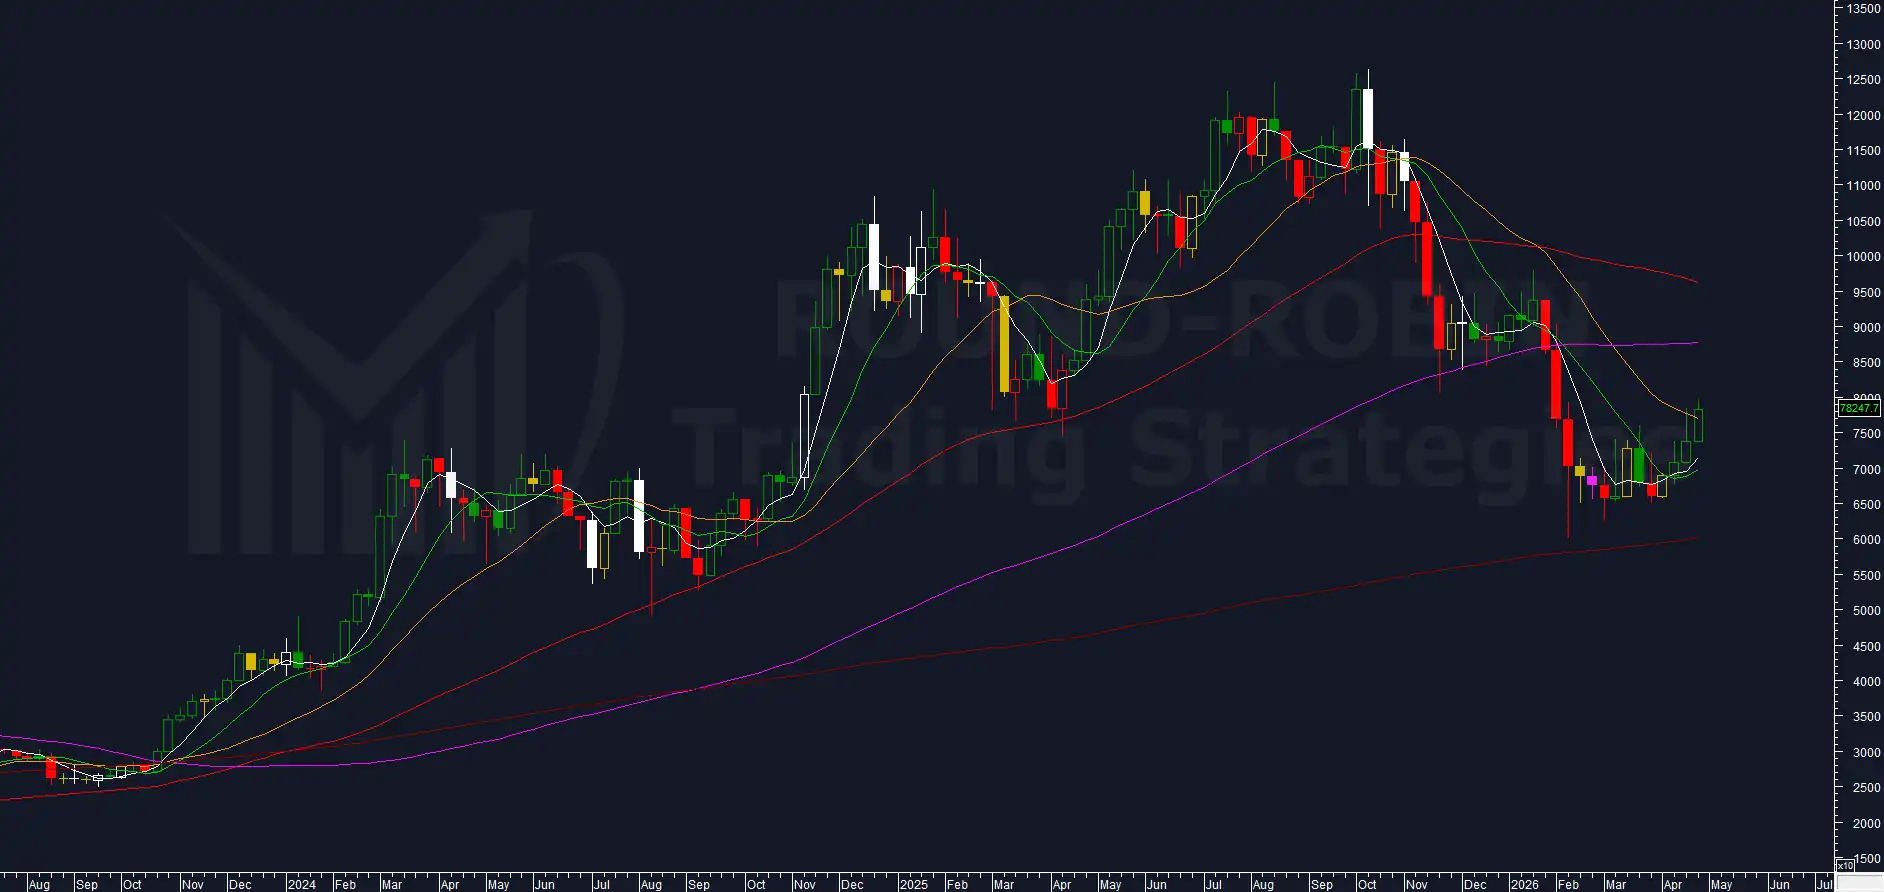
chart: BITCOIN weekly
chart: BITCOIN weekly
Last week price was rejected at the MA20W, with the short still active on the condition that the level was not breached.
Third consecutive week of higher highs and higher lows.
Weekly close at 78,200 with a slight break of the MA20W, sufficient condition to trigger the exit short. Too early to go Long, but enough to send the system flat.
Volatility remains relatively low and weekly ranges stable below 10%.
⚡ NIKKEI 225
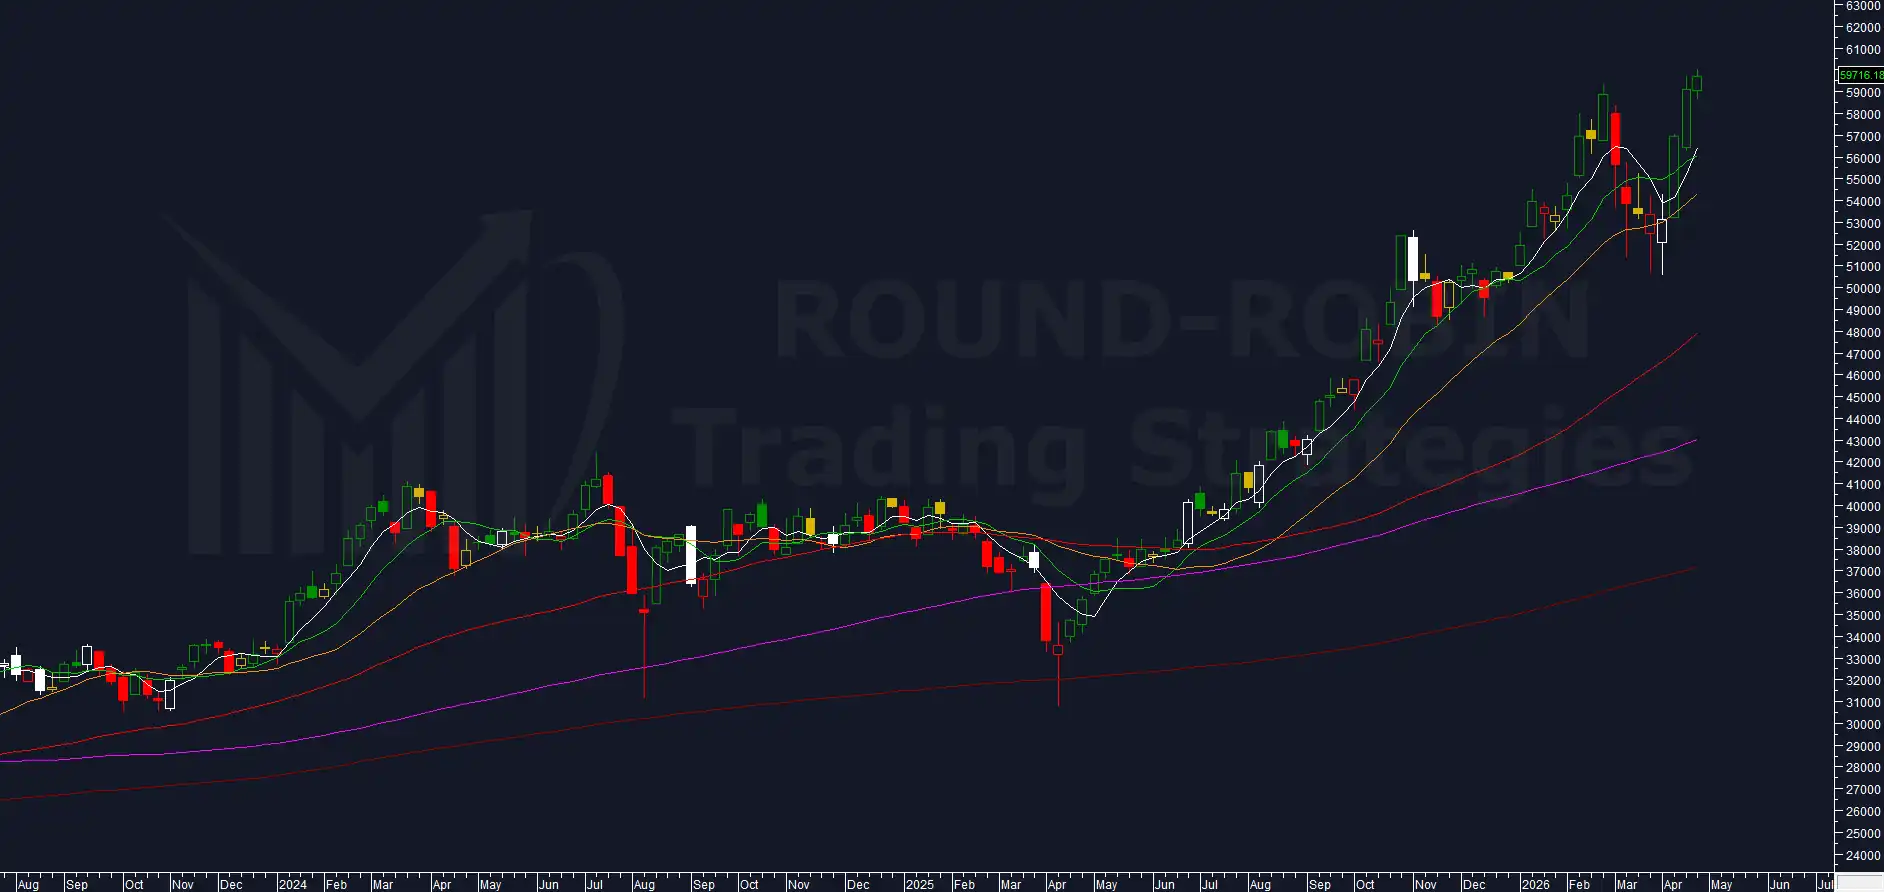
chart: NIKKEI225 weekly
Another week higher, albeit with a contained move.
New all-time closing high at 59,716.16 and new all-time high.
A move sufficient to push the overextension on the MA200W to 57.60%, a new all-time record. The previous was 57.39%.
In last week’s Chart of the Week we opened a long position.
The system increases its Short positions.
⚡ DAX
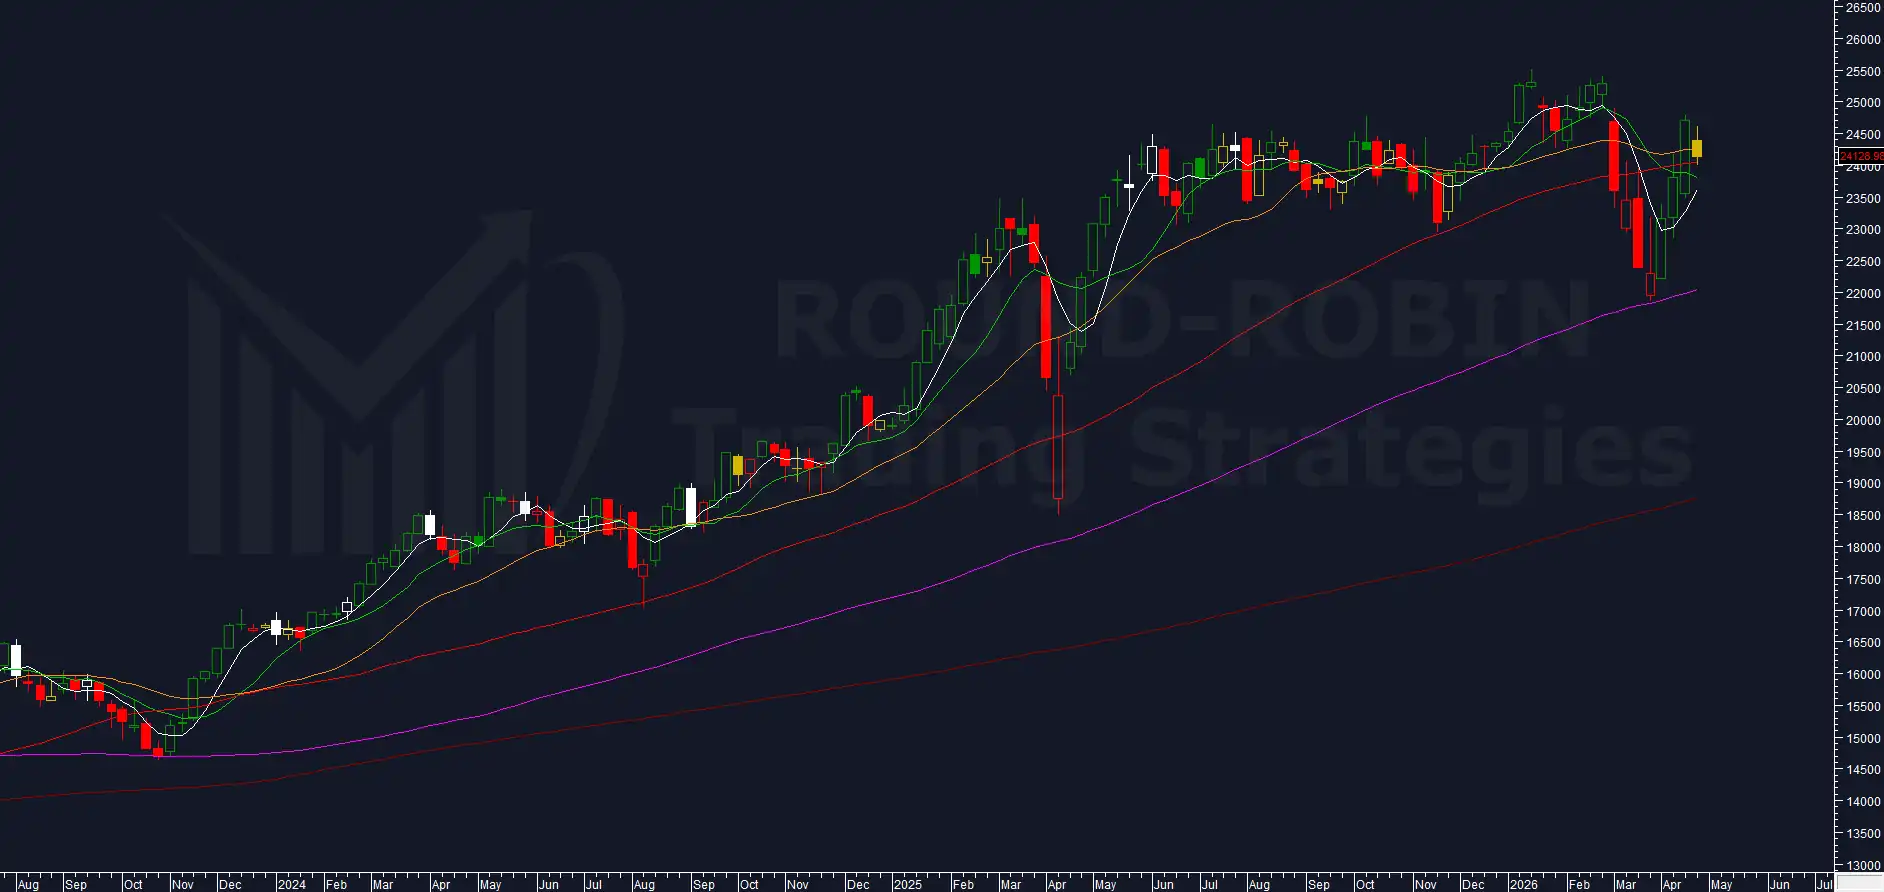
chart: DAX weekly
In Charts Flash Week 15 the system had exited its long after failing to recover the MA50W and the MA20W.
Last week no significant move.
Inside week with a weekly close at 24,128.98, below the open.
A move sufficient to push price back below the MA20W.
Not a true price signal, but the persistence of the Volatility Indicator around 15% is sufficient for the system’s Short entry.
There is still room for a bullish swing but it should be limited.
Leave a Reply