


Weekly appointment with the most watched charts in the world.
Over the past two editions the Chart of the Week had focused on the S&P 500, with the system entering short on quantitative excesses and waiting for a price signal coherent with the statistical setup.
This week the focus shifts to Brent Crude Oil. Not because of a new operational signal, which still remains absent, but because oil now represents one of the most delicate points of the current inter-market picture.
The main global indices continue to display bullish structures, but with profoundly different characteristics. In the United States and Japan the dominant theme remains overextension: S&P 500 and Nikkei 225 are sitting at extremely elevated distances from their respective MA200W, on statistically rare levels. In Europe the picture appears more articulated: DAX, Eurostoxx50 and FTSE MIB maintain bullish structures but are starting to show compression and distribution dynamics at the highs.
In this context Brent continues instead to lag behind. And it is precisely this lag that represents the most interesting data point of the week.
Should oil confirm its bullish setup, the inverse correlation that historically tends to re-emerge in phases of inter-market tension could turn into the catalyst for the correction expected on the indices. Conversely, a structural breakdown of Brent would leave room for a further continuation of the global risk-on move.
Oil, in other words, is not yet confirming anything. But this very lack of confirmation is itself becoming the main element to monitor.
Bulls vs Bears
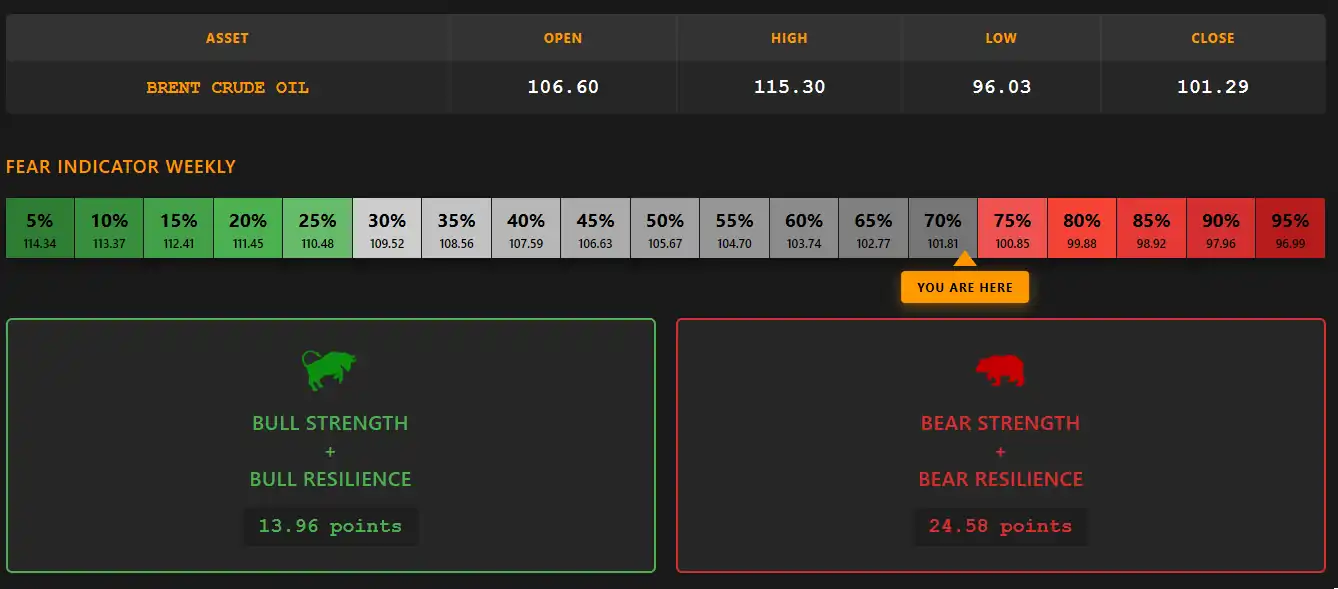
infographic: Brent Crude Oil weekly – Bulls vs Bears
The week is closed in favor of the bears, with a strength ratio close to 1.76:1.
The Fear Indicator also remains in the 70% area, a reading consistent with short-term bearish pressure higher than the probability of an immediate attack on recent highs.
The weekly price action confirms this stance: the initial bullish attempt was entirely reabsorbed in the second half of the candle.
The Big Picture
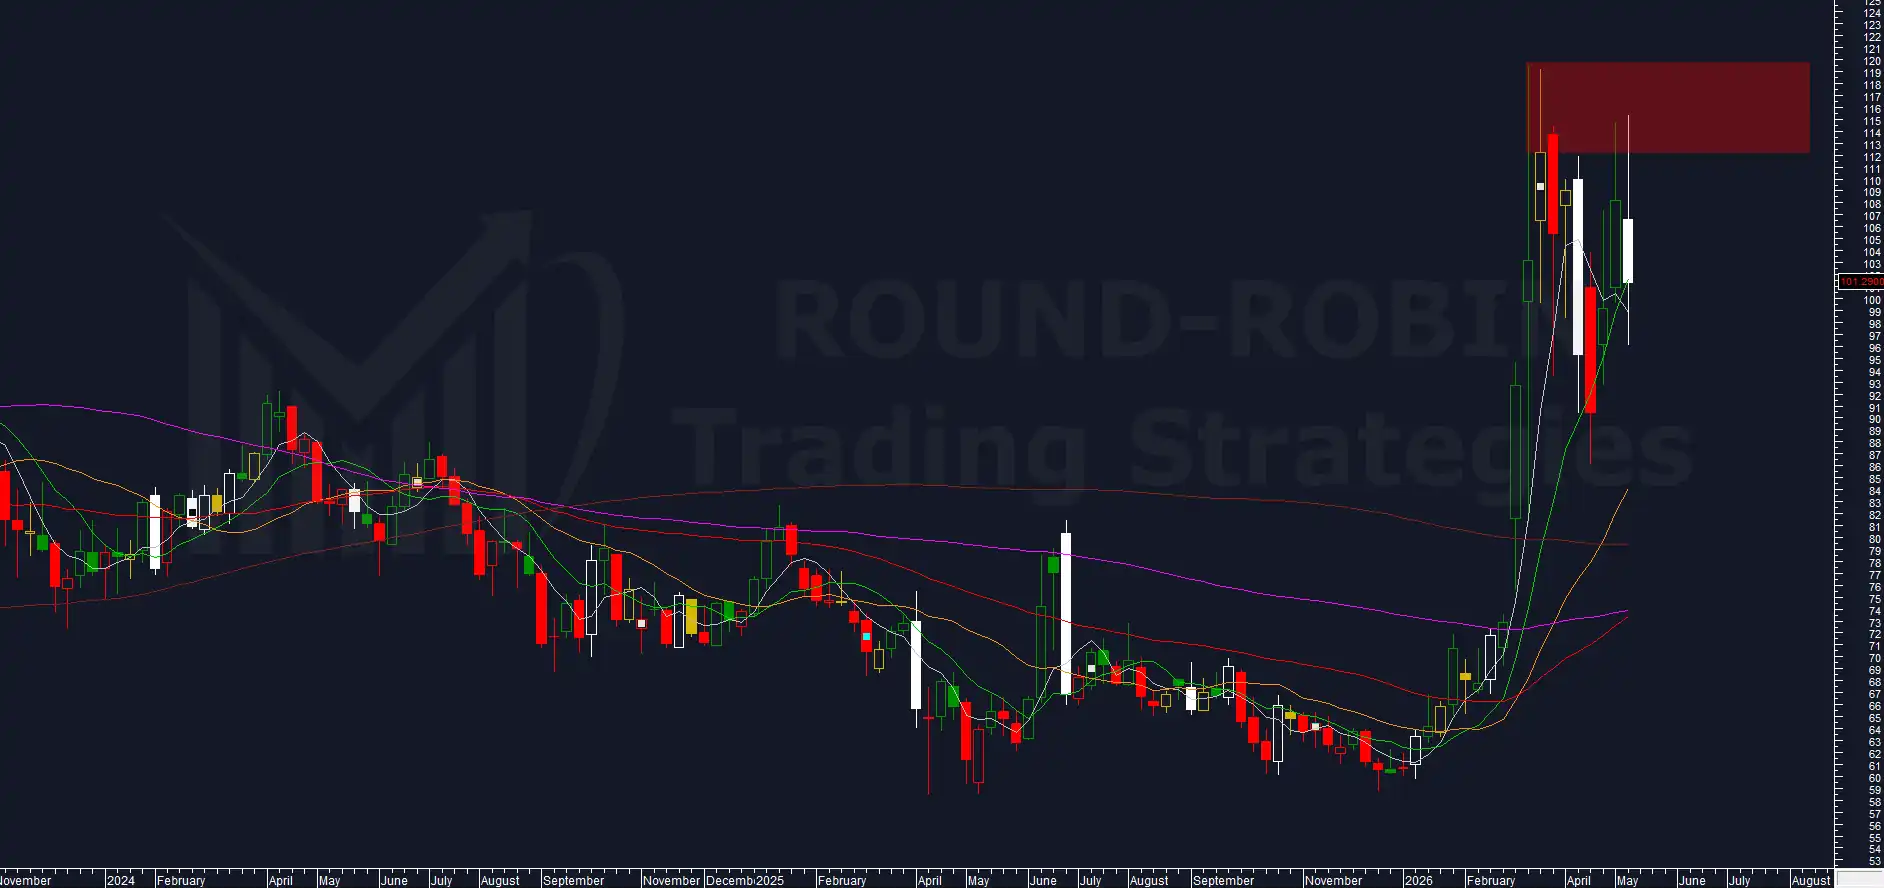
chart: Brent Crude Oil weekly
Weekly open at 106.60, high at 115.30, low at 96.03, close at 101.29.
The weekly candle is a complete outside week relative to the previous one: higher high, lower low, weaker close. The rejection of the 112-120 area once again confirms the presence of supply in the main medium-term bear zone, while the reaction developed above 96 highlights the persistence of demand on the short term.
On a structural level, however, the picture remains more neutral than the outside alone might suggest. The body of the current candle is in fact entirely contained within the previous bullish body, an element that reduces the directional weight of the structure and reinforces the interpretation of volatility expansion without definitive confirmation of the trend.
The high at 115.30 also represents the second consecutive penetration of the 112-120 bear area immediately followed by a rejection. On the opposite side, the low at 96.03 constitutes a short-term reaction above the true structural support located between 86 and 90 dollars, an area where just three weeks ago Brent had closed at 90 with a low at 86.
The moving averages also confirm this transition phase: the MA5W has completed the bearish cross over the MA10W, but the progressive convergence of the fast averages towards price suggests that part of the quantitative excess is being reabsorbed through time rather than through a genuine bearish acceleration.
The system remains Flat. No new operational signal.
Range Weekly%
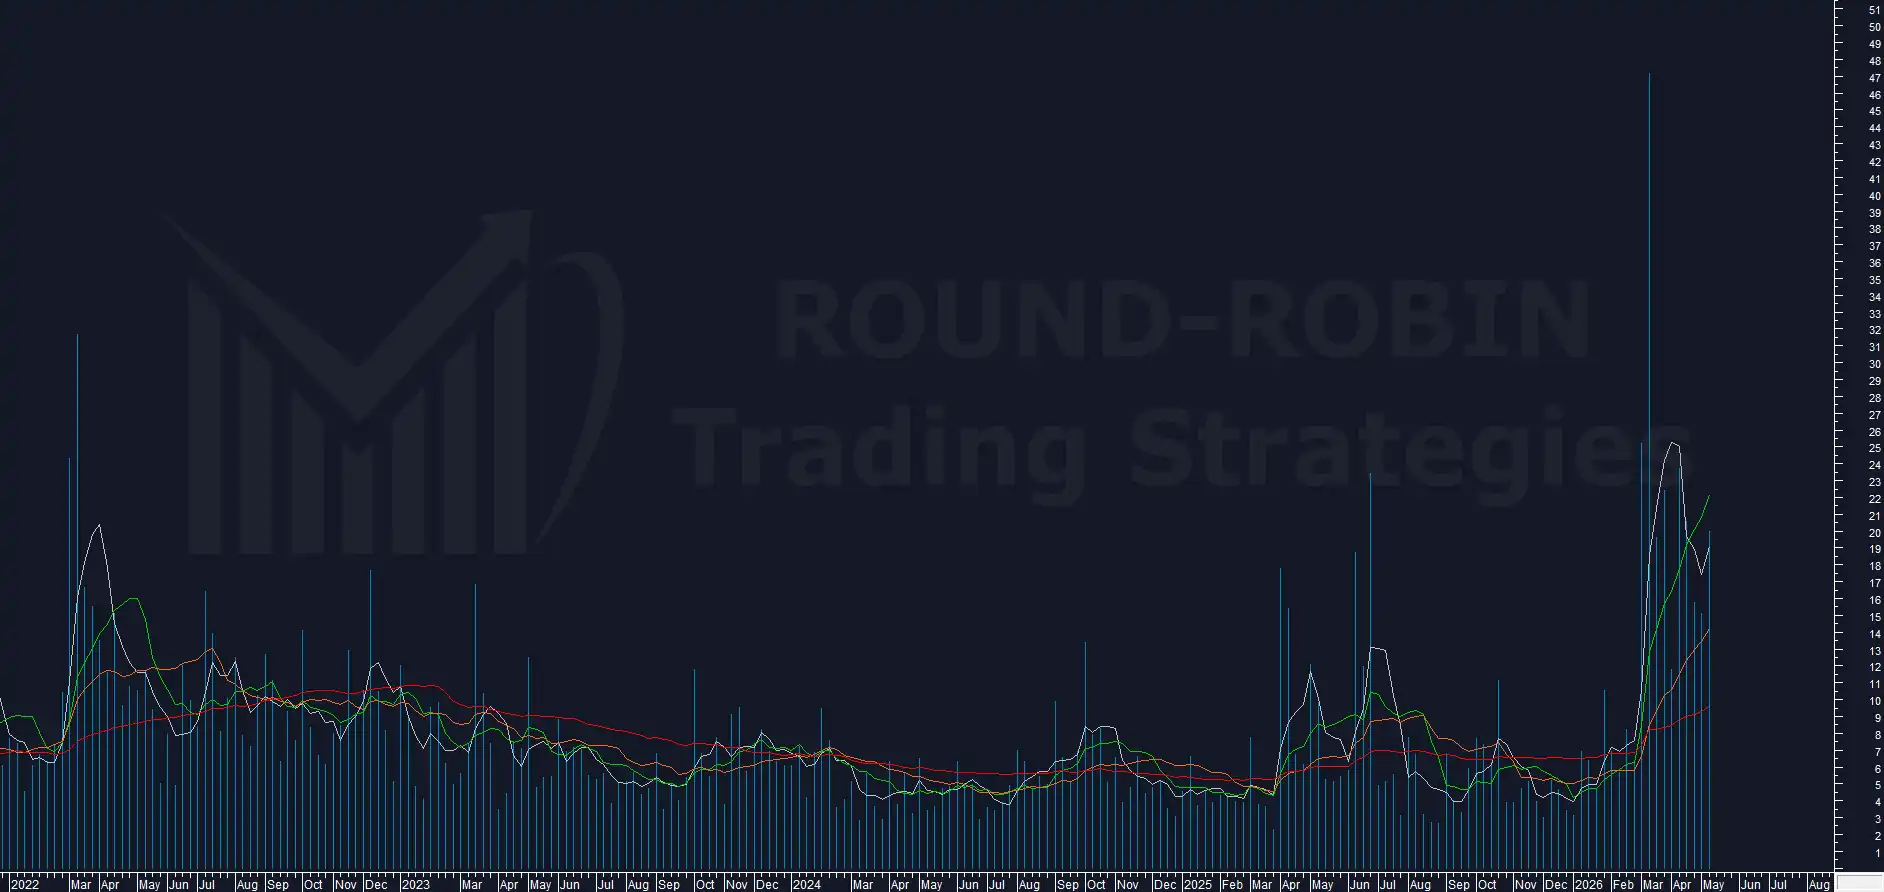
chart: Brent Crude Oil – range % weekly
Range% accelerates to 20.07%, returning to levels already observed in previous phases of directional tension.
Since mid-February the indicator has continued to hold steadily above its short and long-term moving averages, on levels historically compatible with impulsive moves and phases of volatility expansion.
The reading taken in isolation, however, is not enough. The meaning of Range% only emerges when observed alongside the behavior of the Volatility Indicator.
Volatility Indicator
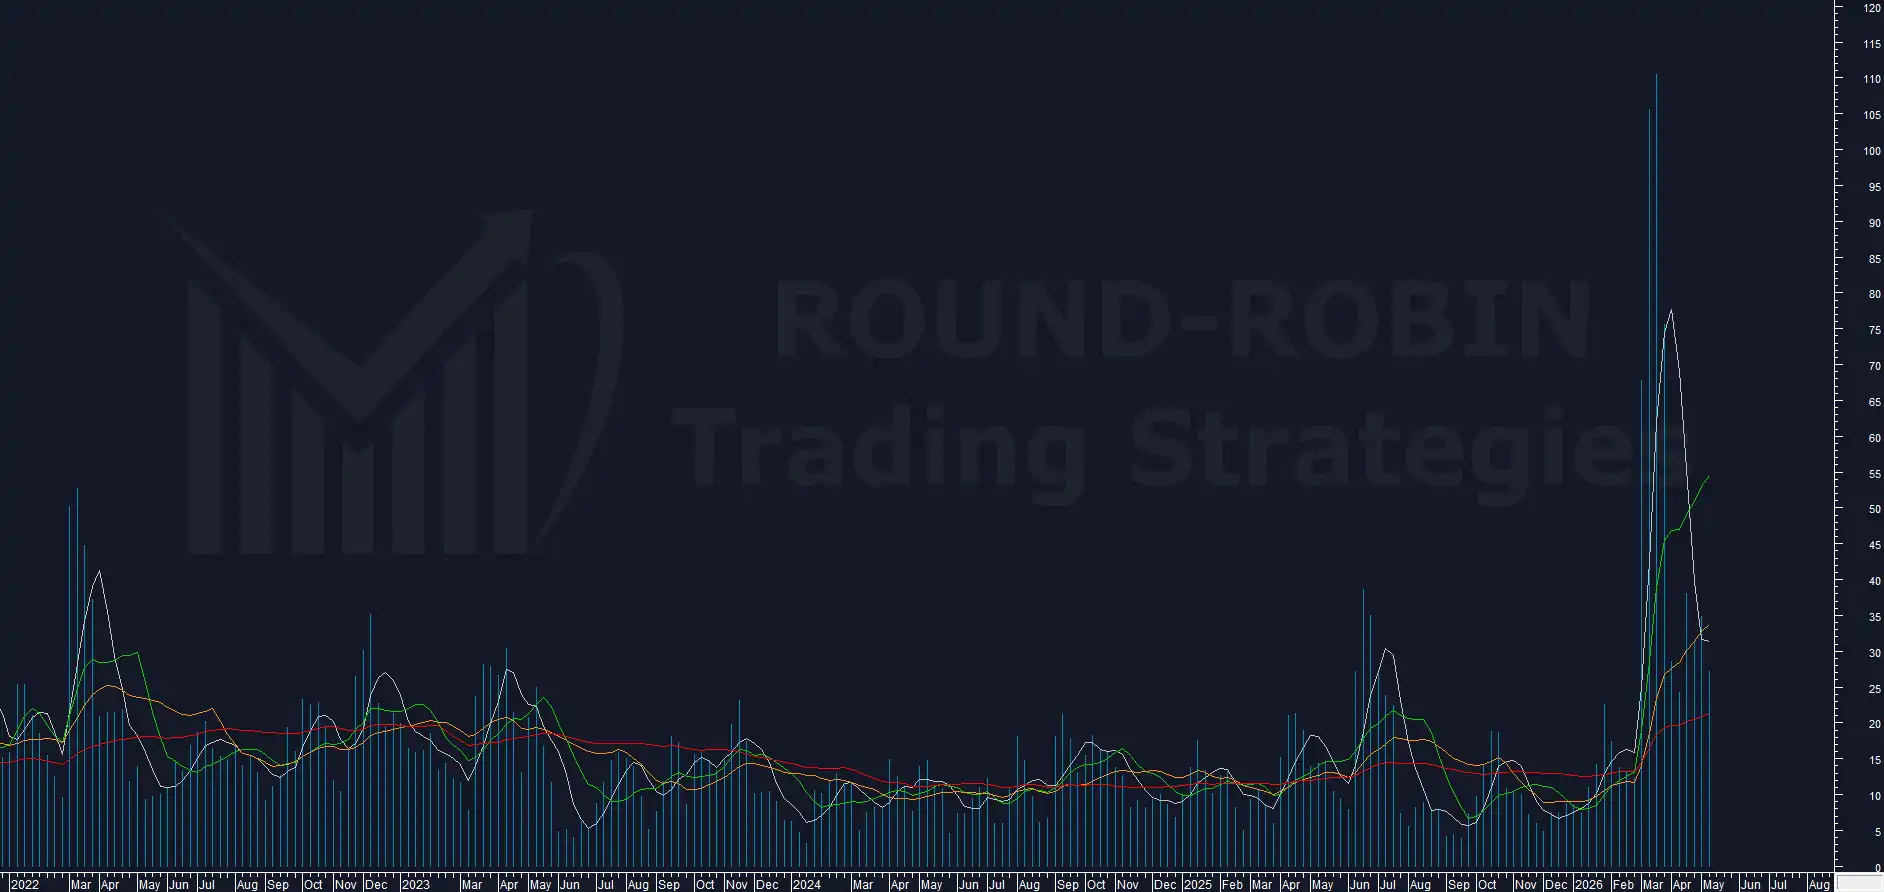
chart: Brent Crude Oil – proprietary Volatility Indicator
The Volatility Indicator is retracing from the recent peak. The fast curve corrects rapidly while the slower component continues to contract.
Since 2022 Brent has shown a relatively recurring dynamic: the strongest directional accelerations have been accompanied by simultaneous expansion of Range% and Volatility Indicator, while phases of trend weakening have generally coincided with a coordinated contraction of the two indicators.
The current configuration does not fully fit either of the two historical setups. Range% remains elevated while the internal structure of volatility continues to normalize.
This is a configuration compatible both with an accumulation phase ahead of a bullish breakout and with an as yet incomplete distribution. In the absence of directional confirmations, the market therefore continues to move in a transition zone.
BCP3
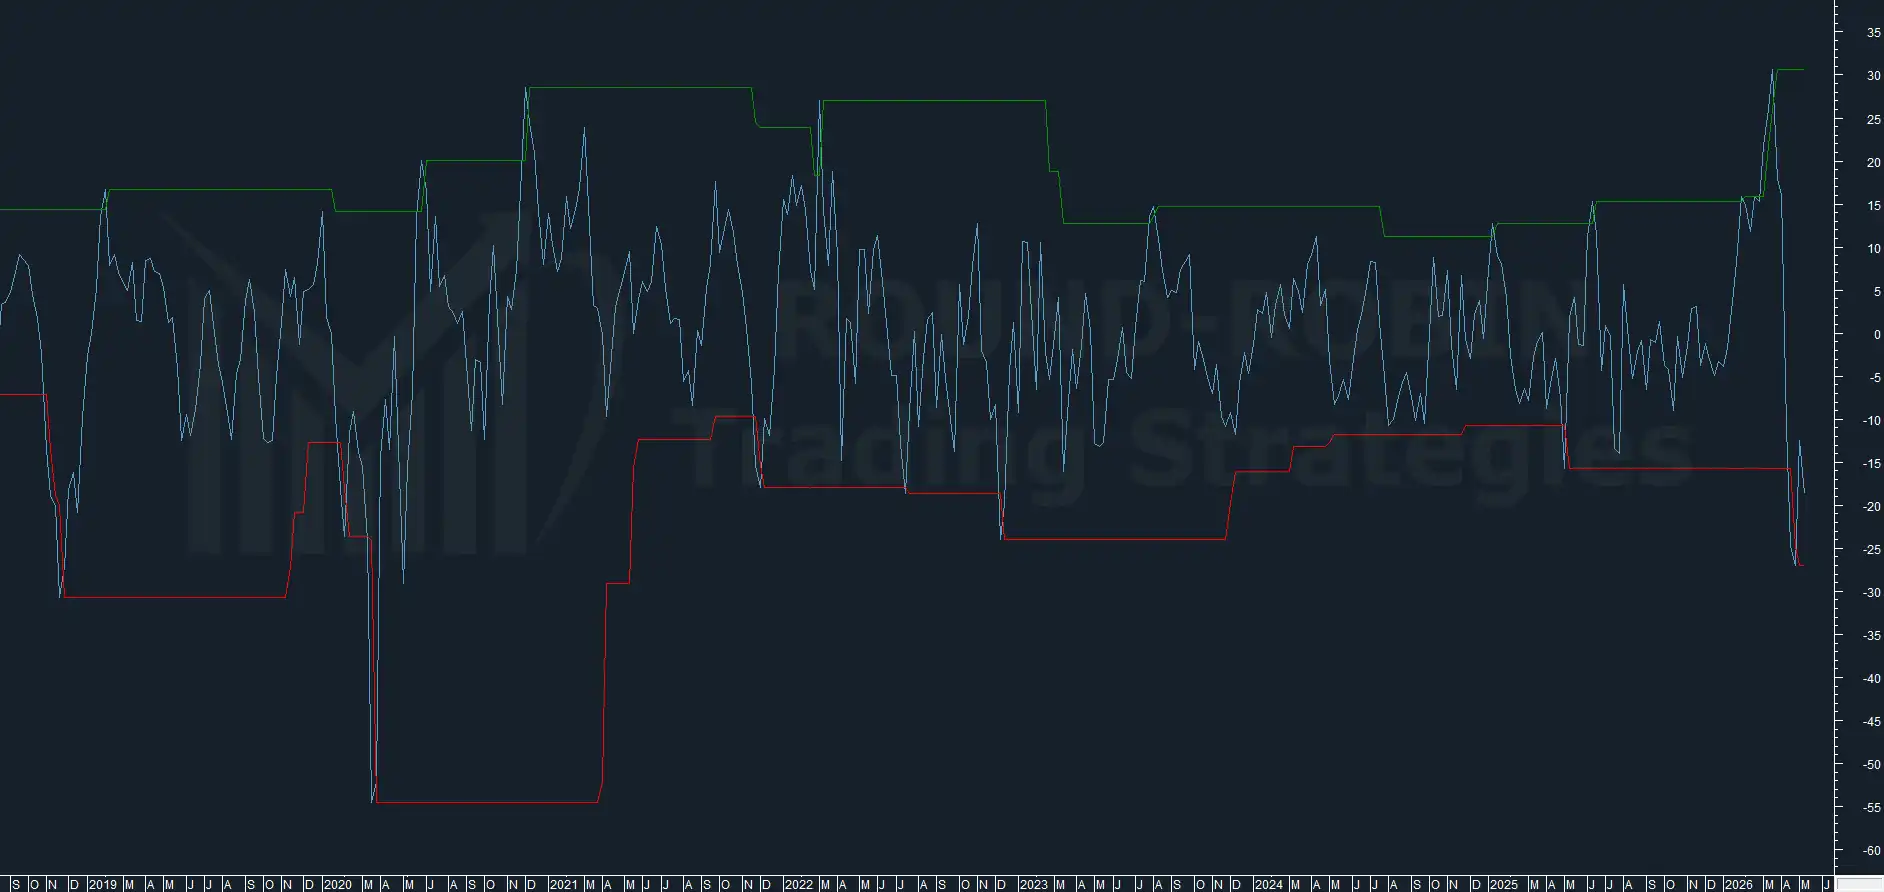
chart: Brent Crude Oil – BCP3
The BCP3 continues to sit below the lower band of its channel.
Historically, from 2020 onwards, similar configurations have almost always anticipated the construction of bullish bases on Brent. The only significant exception remains the pandemic collapse of 2020, when the indicator continued to deteriorate accompanying the oil crash towards extreme lows.
The closest parallel to the current setup appears instead to be 2021: at that time too the BCP3 had decisively broken the lower band before reversing and accompanying the subsequent Brent rally towards the 120 area.
On the basis of BCP3 alone, the statistically prevailing scenario therefore continues to be that of a bullish swing rather than an impulsive continuation of the downside.
Correlation with Indices
The central point of the analysis is not Brent as an isolated asset, but the relationship between oil and the current configuration of the global equity indices.
The indices have already expressed most of the structural information available. In the United States and Japan through historically elevated overextensions. In Europe through mature and increasingly compressed bullish structures.
Brent, on the other hand, has not yet confirmed either of the two main scenarios.
A bullish break above the 120 area would reinforce the hypothesis of a reactivation of the inverse correlation, with a possible start of the reabsorption phase of the excesses on the indices.
Conversely, a violation of the structural area between 86 and 90 would indicate that the global market still has room to extend the risk-on move before a genuine distributive phase.
Finally, a third scenario exists: simultaneous continuation of the upside on both oil and indices. This would not be impossible, but would represent a significant deviation from the prevailing dynamics observed in comparable precedents and would force a re-reading of the entire inter-market framework.
Conclusions
The system remains Flat on Brent.
The most important element of the week, however, is not the operational signal, still absent, but rather the role that oil is taking on in the global context.
The indices have already expressed most of their excesses. Brent has not.
For this reason oil remains today one of the most important variables to monitor: not because it is anticipating an imminent move, but because the direction of its future resolution could determine which of the various inter-market scenarios will end up prevailing in the coming weeks.
The key levels remain unchanged: 120 area on the upside, 86-90 area on the downside.
It will be the breakout of one of these levels, observed together with the simultaneous reaction of the global indices, that will provide the first true structural signal of the next phase of the market.
Leave a Reply