


The S&P 500 returns as Chart of the Week for the third time in five weeks. In the COTW two weeks ago the market was at a crossroads with the Short system down roughly 65 points and the MA200W overextension at 34.94%. In last week’s Charts Flash the crossroads had resolved to the upside with the fifth consecutive week of higher highs and higher lows.
This week the S&P 500 is the only index to have posted a new all-time high on the weekly high (7,517.12) and to have also set a new closing high at 7,408.50, up 9.56 points. Let’s see what the indicators have to say.
Bulls vs Bears
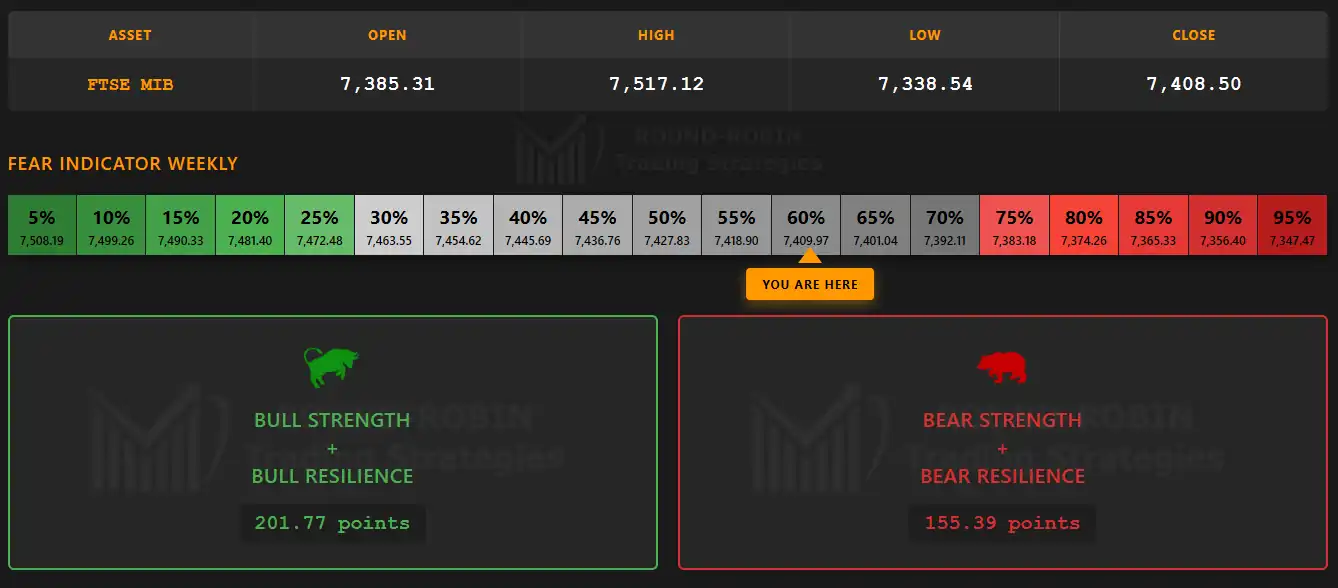
infographic: FTSE MIB weekly – Bulls vs Bears
Bulls win the week with a 1.30:1 ratio (201.77 versus 155.39). Compared to previous weeks the victory is narrow, a very slight loss of strength entirely normal after the most recent rally.
The Fear Indicator rises to 60%. After weeks in the comfort zone, it crosses the attention zone for the first time without however entering the alarm zone.
The Big Picture
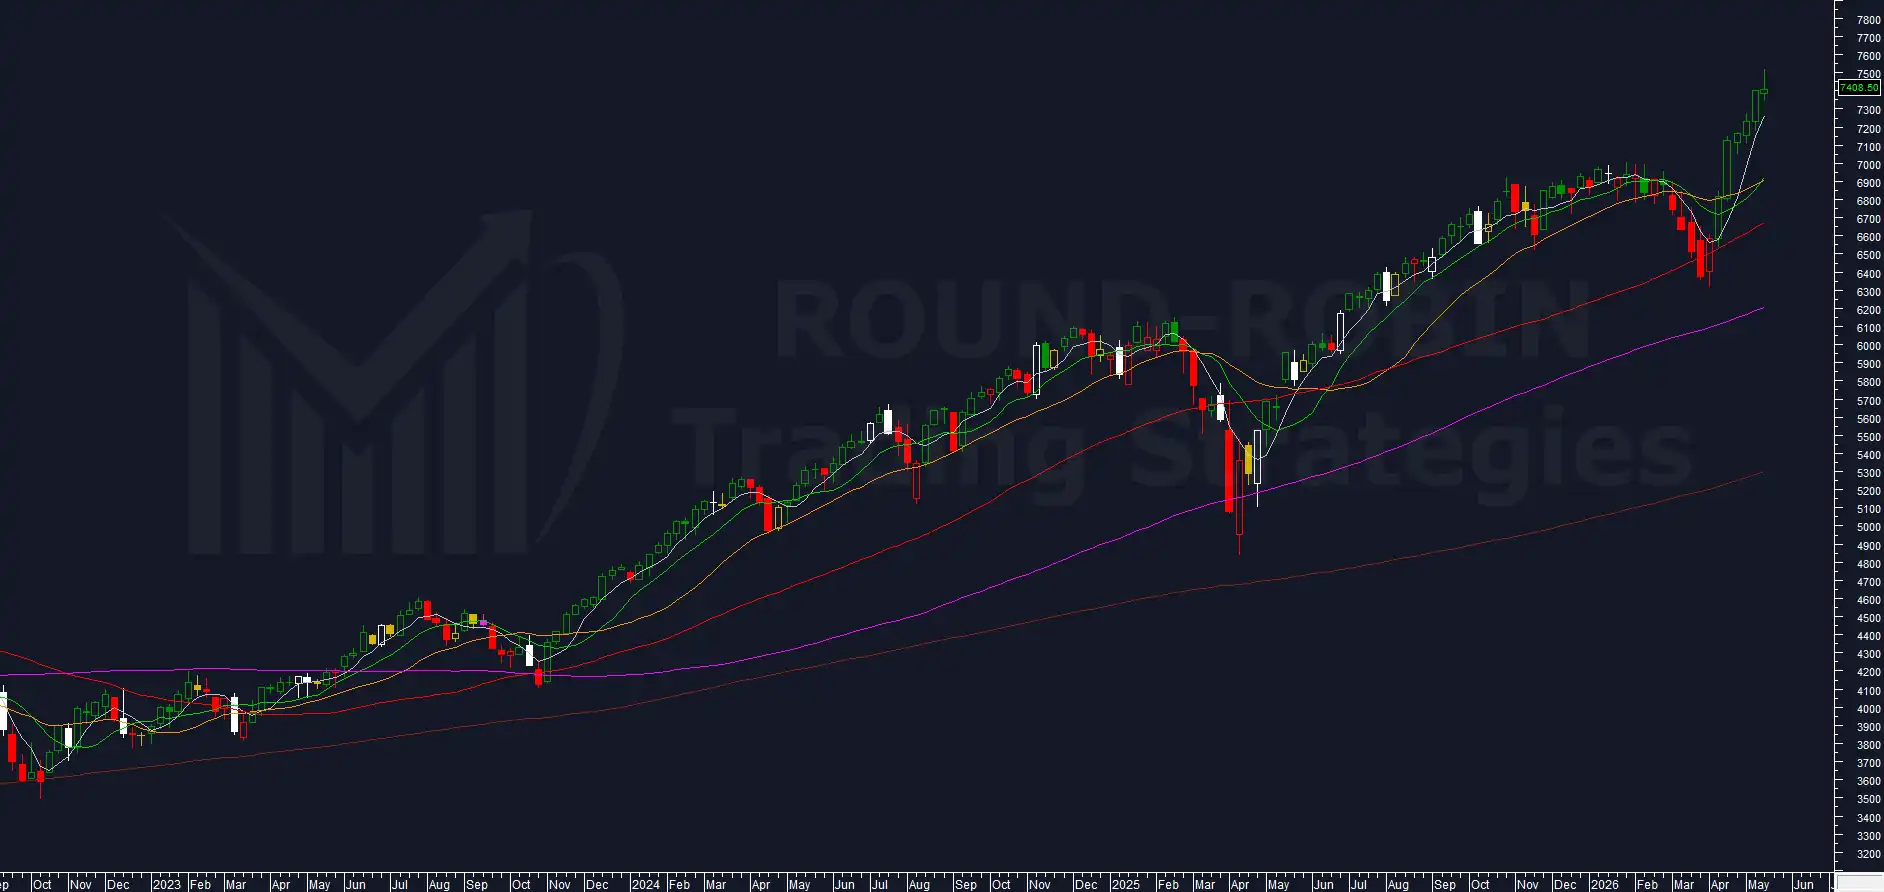
chart: SP500 weekly
Sixth consecutive week with higher highs and higher lows, seventh with close above open, fifth overextended above the MA5W.
Despite the system’s Short position still being intact, the American index has given no sign of weakening the bull structure. The record for consecutive positive weeks is 9, achieved on 2 occasions in the last 26 years (4 times 8 consecutive). The record for consecutive weeks with close above open is 9, achieved 4 times in the last 26 years.
This week the MA10W completed a bullish cross above the MA20W. All moving averages are now correctly aligned and positively inclined.
Volatility Indicator
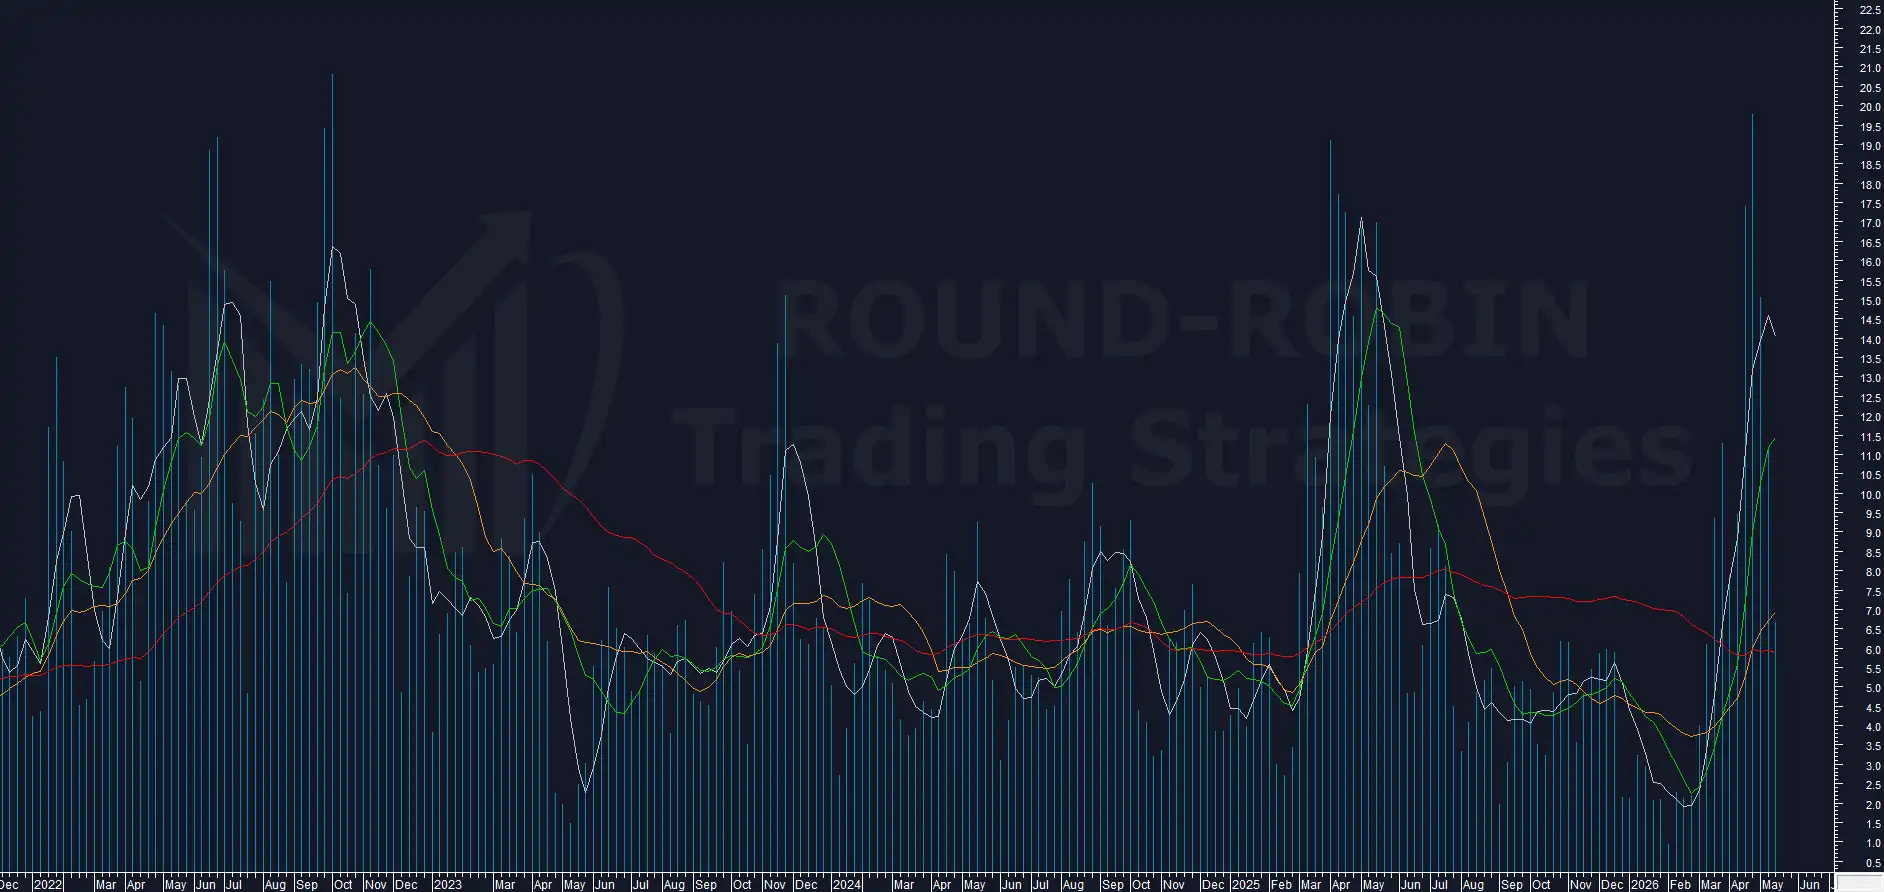
chart: Volatility Indicator – SP500 weekly
At 6.69%, third consecutive week in decline. It now sits on long-term average values (MA50W).
Range Weekly%
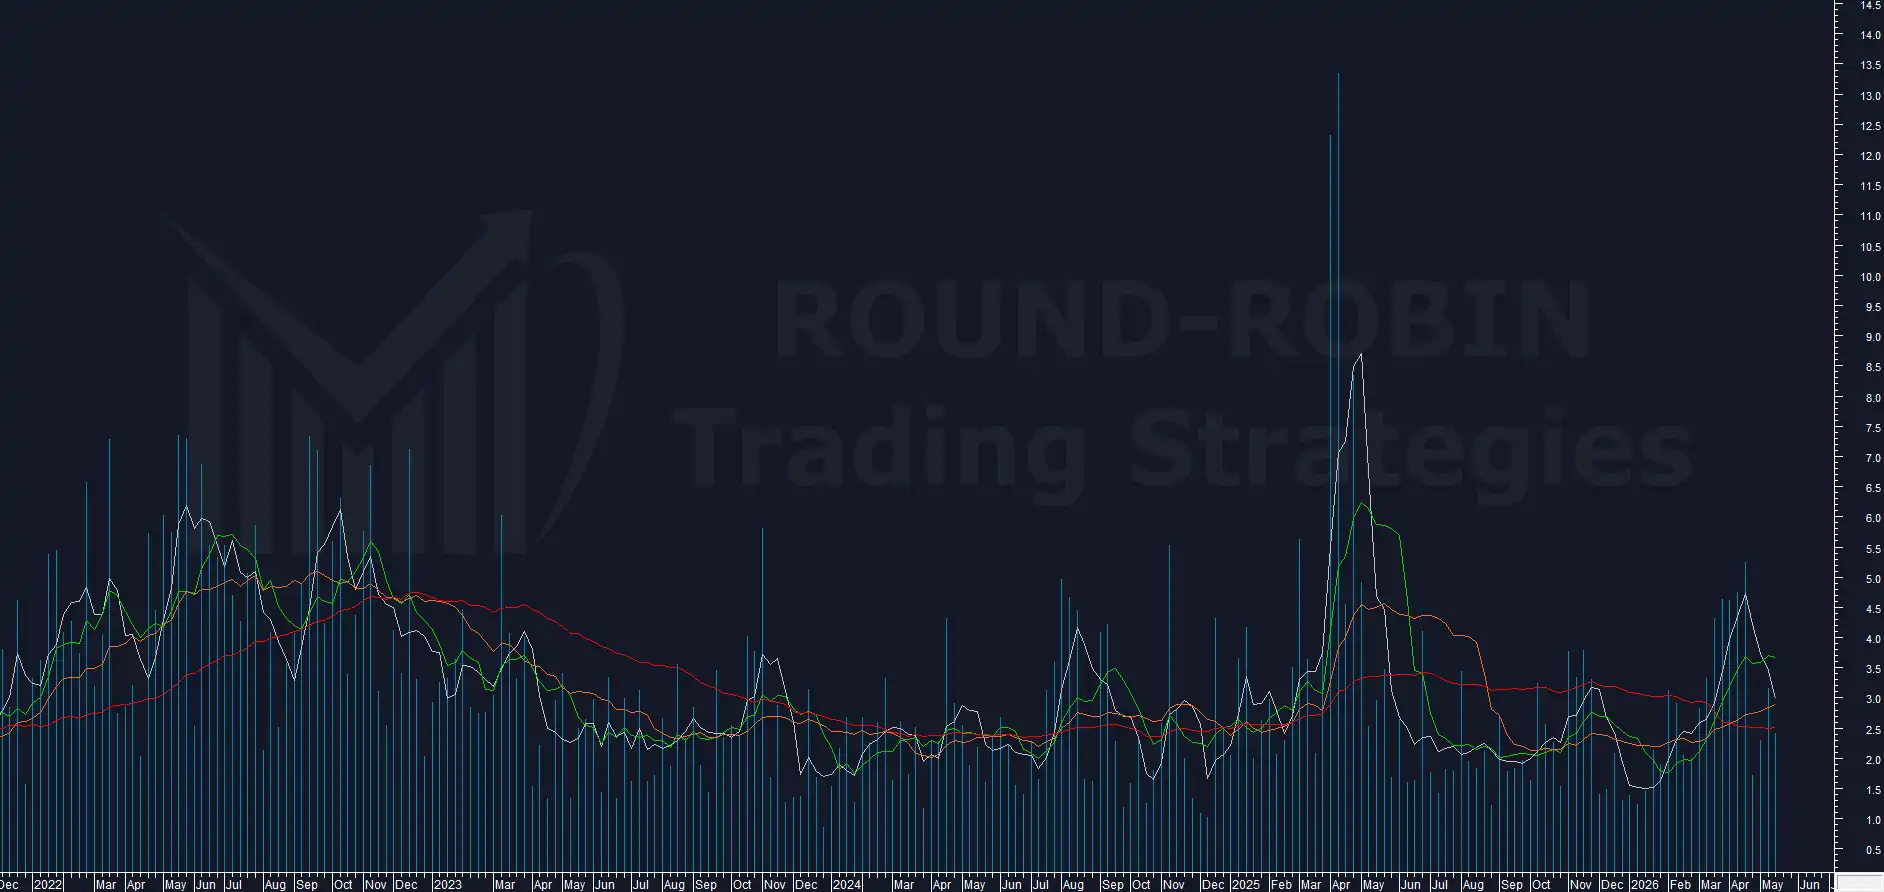
chart: FTSE MIB – range % weekly
Range also declining, at 2.43%. The simultaneous decline in volatility and range, combined with the other elements present on the S&P 500, continues to favor a scenario of momentum exhaustion, compatible with both a corrective pause and a broader distributive structure.
BCP3
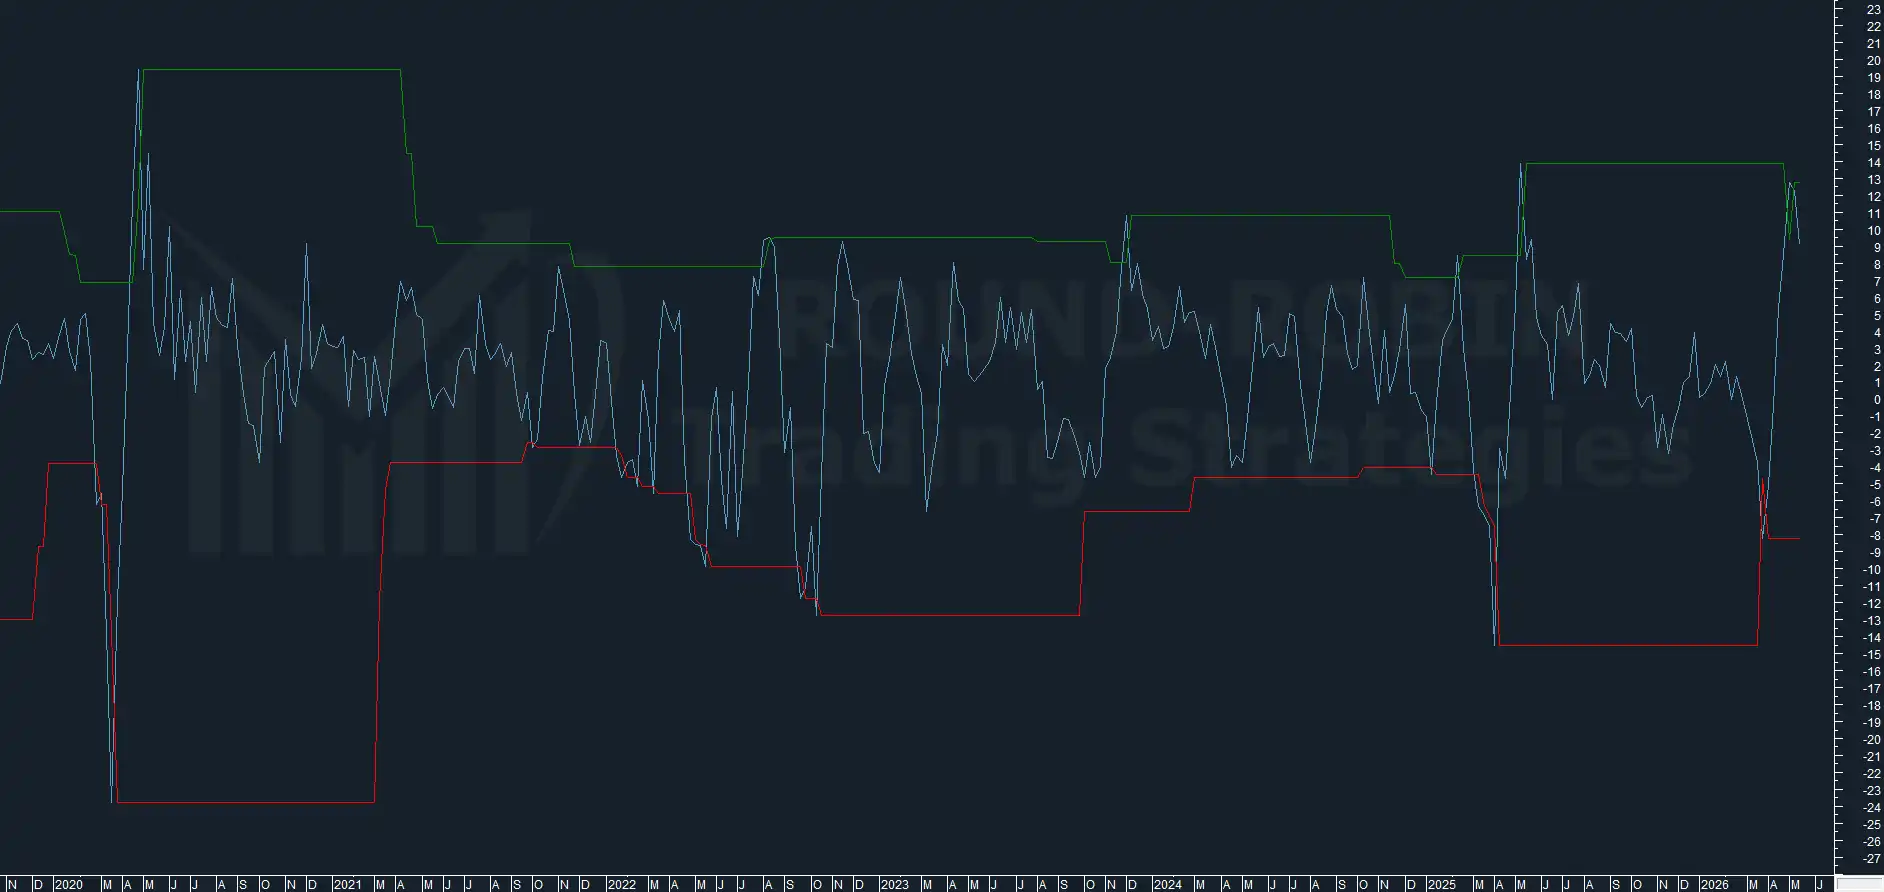
chart: BCP3- SP500 weekly
Hooks credibly at 9.12% this week, confirming high probabilities of correction at least in the short term.
Overextension MA200W
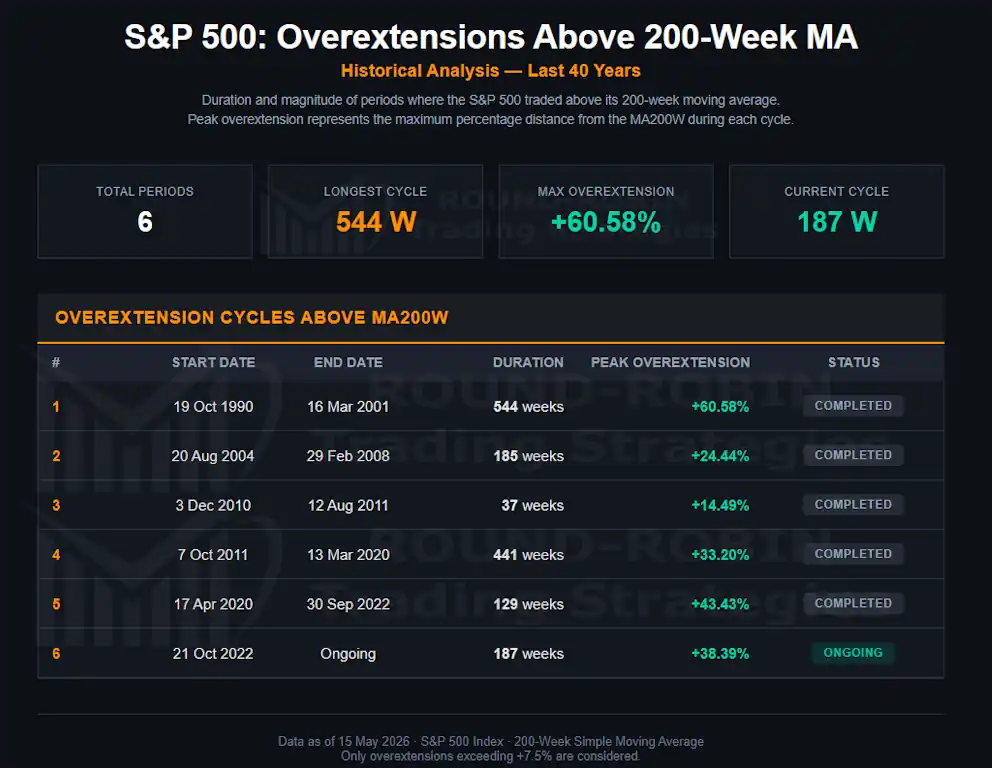
Table: S&P 500 Overextension Cycles Above MA200W (1990-2026)
We are at week 187 and the overextension on the MA200W has reached a new high at +38.39%.
The previous high, in October 2025, had led to three weeks of decline and a rounding on the highs that ultimately culminated in the February-March 2026 selloff. There is no guarantee this will repeat, but these are limit values for this bull movement that started in October 2022 and worth considering.
In the last 25 years only in 2021 did the overextension exceed 40% (post Covid vaccine). Barring exogenous shocks, the expectation is that these values will produce similar effects, having occurred within the same bull movement.
Conclusions
The technical structure remains clearly bullish and, until proven otherwise, the trend is right.
At the same time, the market finds itself once again in a statistically extreme zone: elevated overextension, volatility in compression, range in contraction and excess indicators beginning to rotate.
There is no price reversal signal yet, but the risk/reward for new long exposure continues to deteriorate week after week.
The system’s Short position therefore remains unchanged. Not to anticipate an absolute top, but because under these conditions the market has historically tended to prepare a corrective directional move, rather than an orderly trend continuation.
As always, it will be the market that decides whether these extremes will be absorbed sideways or through a true corrective phase.
Leave a Reply